
The Texas RRC Oil and Gas production data is out. All the RRC data below is through October 2015 and all the EIA data below is through September 2015.
Important: All the Texas RRC data is incomplete, especially the latter months. They will be revised upward as the Texas RRC gathers more data. The EIA data is what the EIA expects the final data will look like.
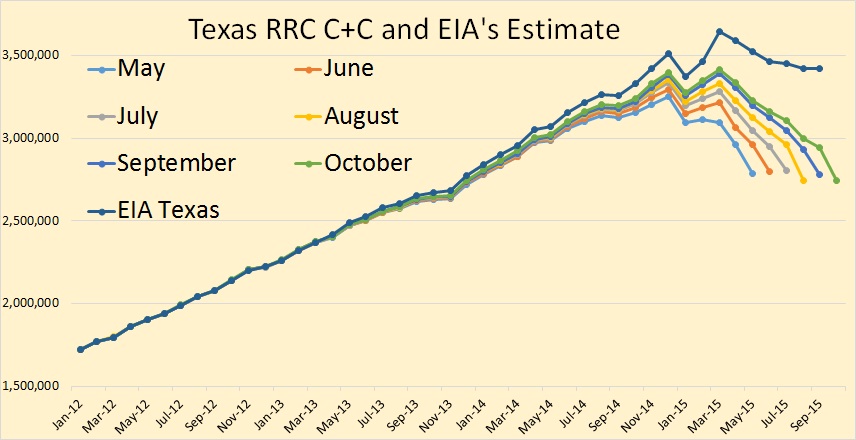
The RRC Crude + Condensate data for October shows a slight decline in October. The EIA says Texas C+C was flat, August to September.
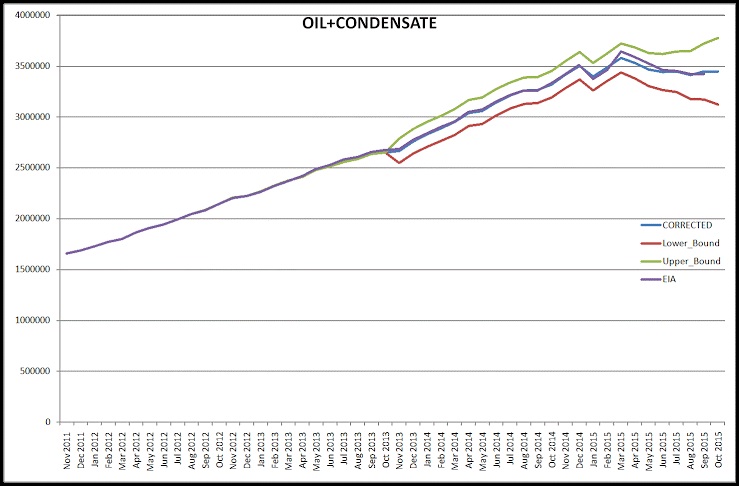
The above chart is what Dr. Dean Fantazzini estimates the final Texas C+C data will look like.
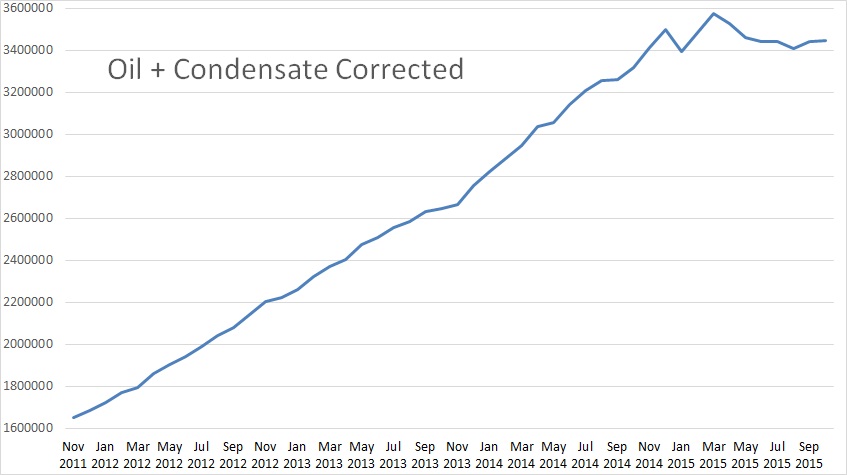
Here I have amplified Dean’s estimate in order to give us a close up of what he expects the final data C+C data will look like.
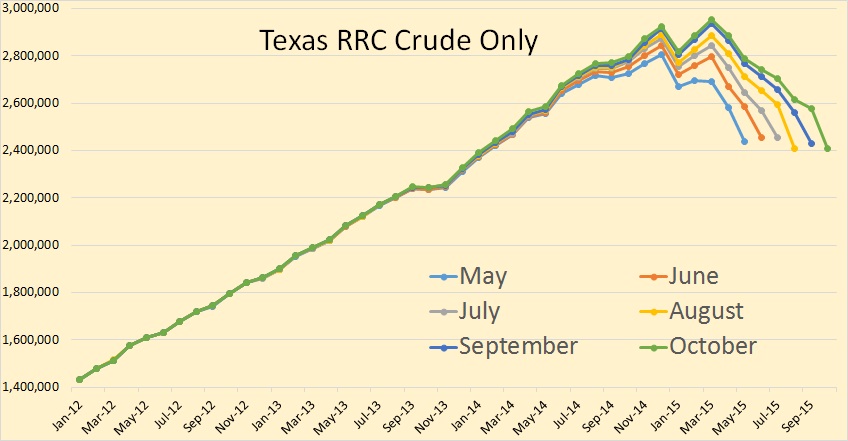
Texas RRC data shows crude only with a slight decline in October.
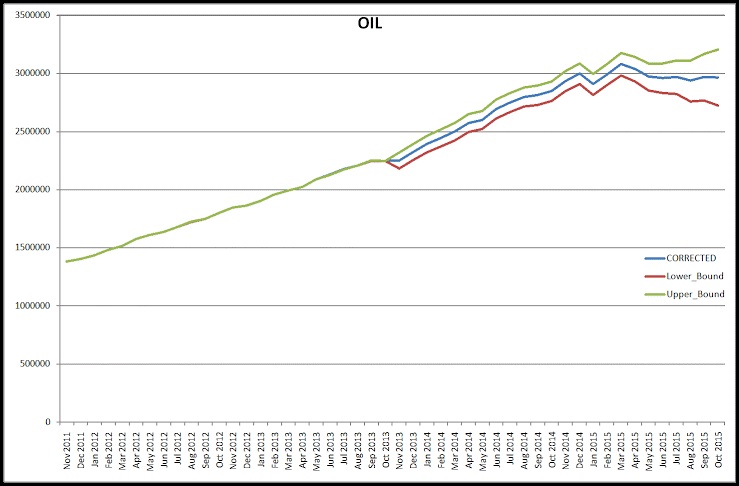
This is Dean’s estimate of the final Texas October crude only production.
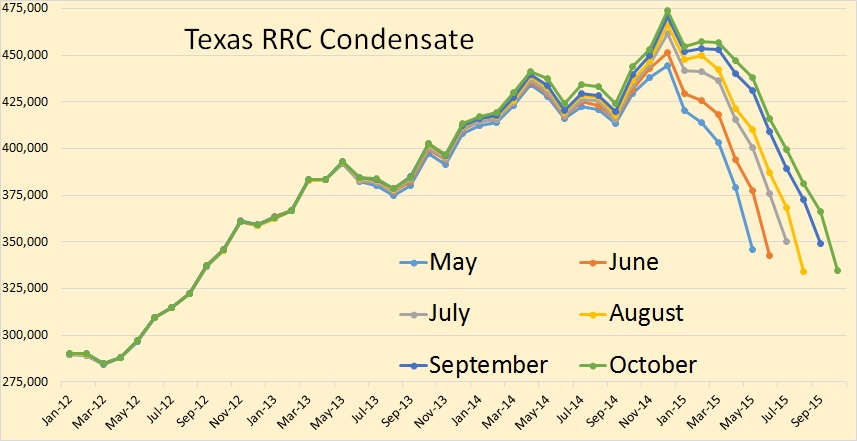
The RRC data shows October condensate a bit lower than September.
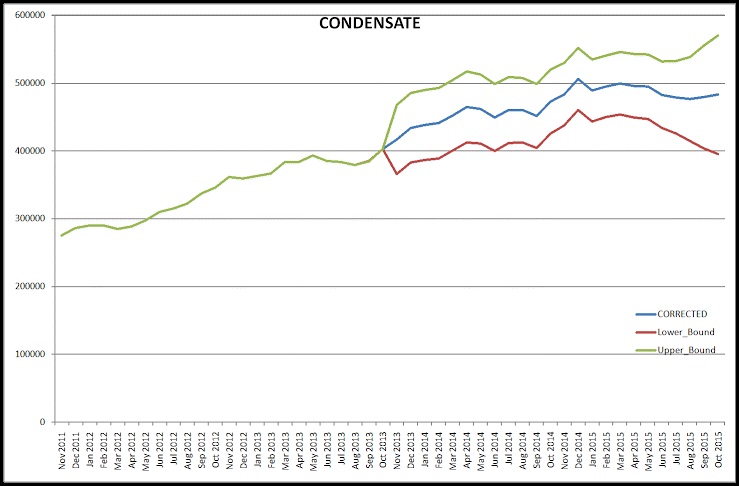
Dean however sees a slight uptick in October condensate.
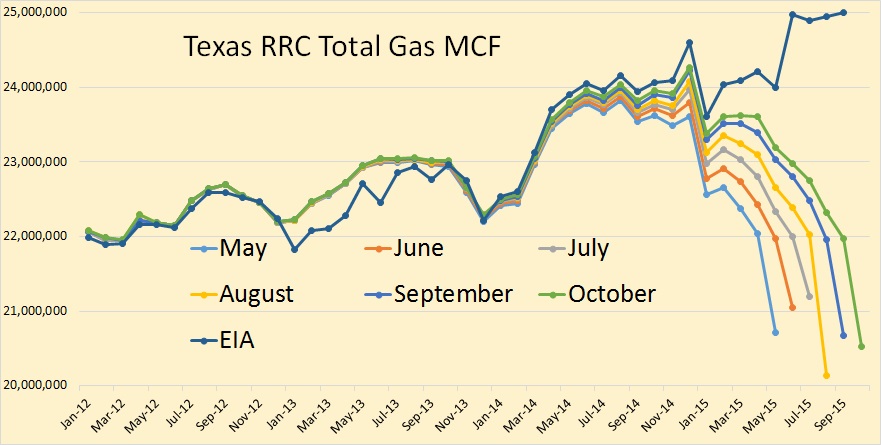
Here we have Texas RRC total gas through October along with the EIA’s estimate of Texas final gas production through September. Notice that the EIA shows a huge uptick in June with a slight down tick in July with a slight uptick in August. The RRC data simply gives no hint that this will be the case when the final data comes in. The RRC data shows a huge down tick in August.
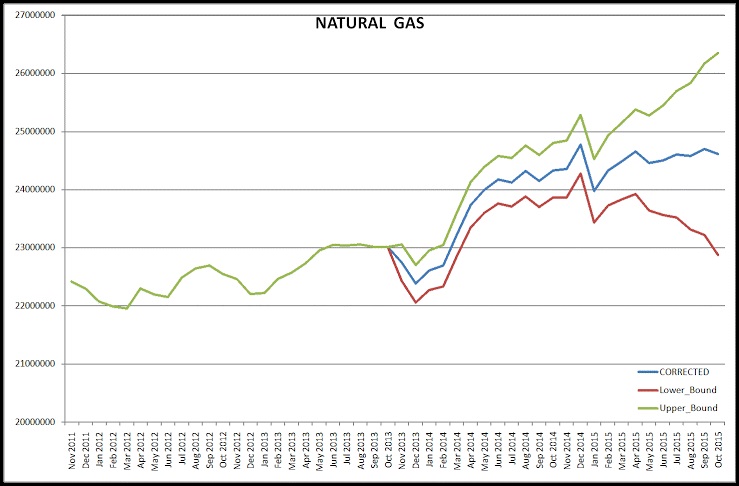
Here is Dean’s projection for the final Texas total gas production. He does not see the huge June uptick that the EIA sees.
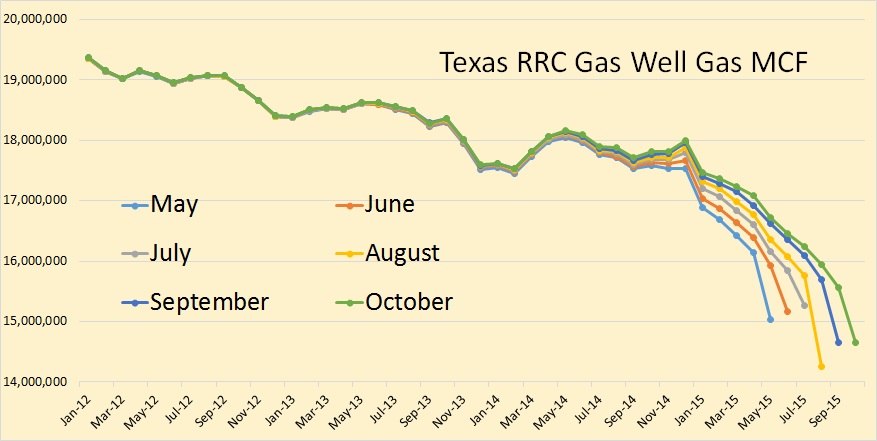
Texas RRC has Texas gas well gas in a slow decline.
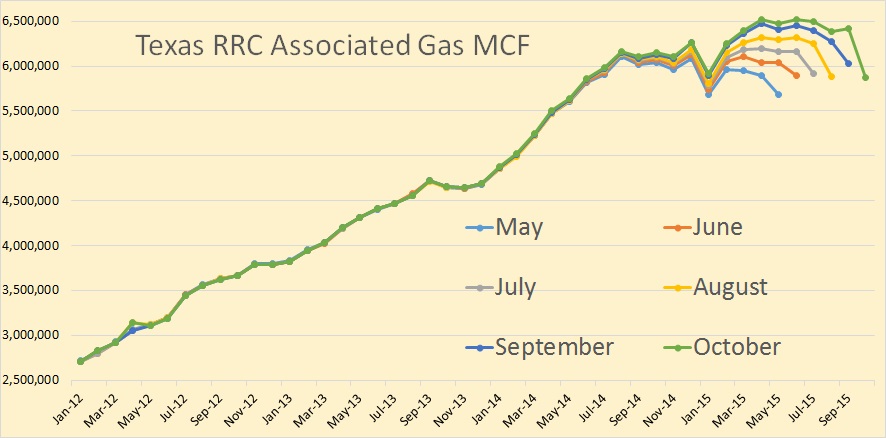
Texas associated gas is what has kept Texas gas production increasing. With the decline in oil rigs and new wells, it is likely that Texas associated gas will start to decline.
Dredd on Sat, 19th Dec 2015 11:16 am
A bit like the king tides … a glimpse at the future … ebb and flow (The King of King Tides Approaches).