Peak Oil is You

Donate Bitcoins ;-) or Paypal :-)
Page added on November 30, 2015
US oil, natural gas reserves increased in 2014

From the U.S. Energy Information Administration today:
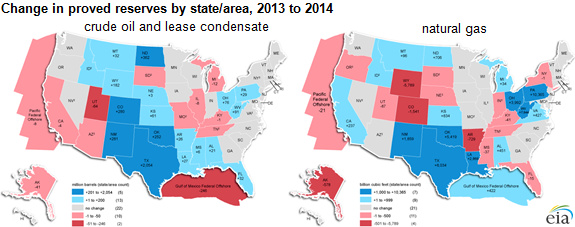
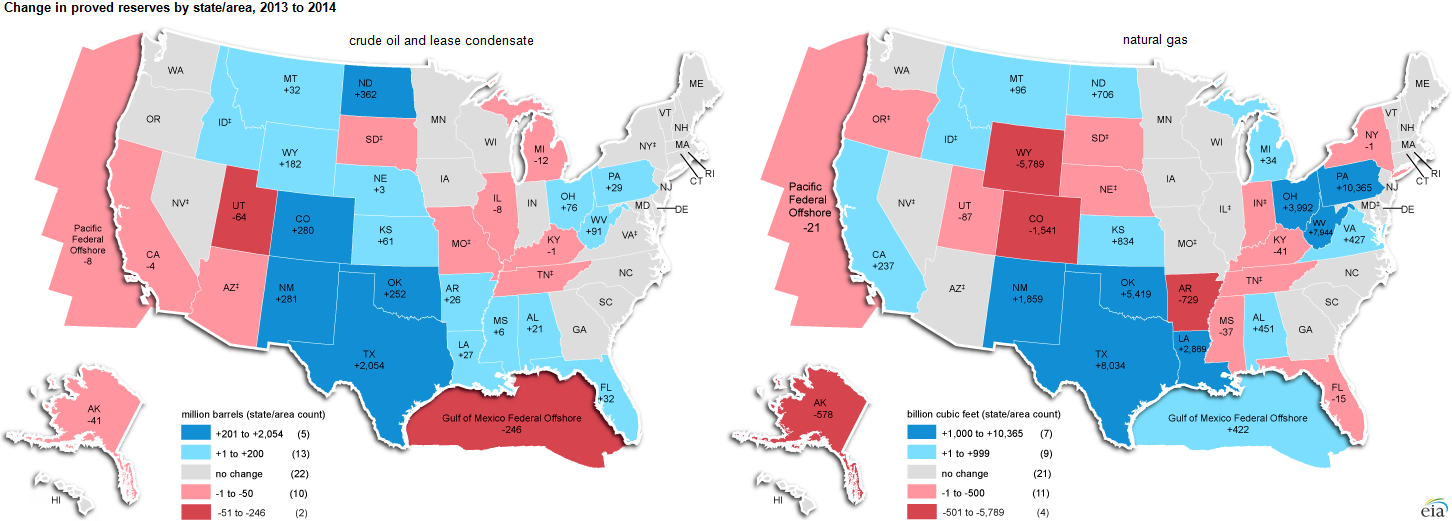
U.S. crude oil and lease condensate proved reserves increased by 9% to 39.9 billion barrels, and natural gas proved reserves increased by 10% to 389 trillion cubic feet in 2014, according to EIA’s U.S. Crude Oil and Natural Gas Proved Reserves report. U.S. crude oil and lease condensate proved reserves reached the highest level since 1972, and natural gas proved reserves surpassed last year’s record level.
Proved reserves are volumes of oil and natural gas that geologic and engineering data demonstrate with reasonable certainty to be recoverable under existing economic and operating conditions. Because they depend on economic factors, proved reserves shrink or grow as commodity prices and extraction costs change. EIA’s estimates of proved reserves are based on an annual survey of domestic oil and natural gas well operators.
Texas had the largest increase in proved reserves of crude oil and lease condensate, representing 60% of the nation’s total net increase in 2014. This increase was driven by development of tight oil plays (e.g., Wolfcamp, Bone Spring) in the Permian Basin and the Eagle Ford Shale play. North Dakota had the second-largest increase, 362 million barrels, which came mostly from the Bakken tight oil play in the Williston Basin.
Note: Click to enlarge.
Proved natural gas reserves were added onshore in the Lower 48 states in several of the nation’s shale formations, particularly the Marcellus Shale play in Pennsylvania and West Virginia, the Eagle Ford Shale play in Texas, the Woodford Shale play in Oklahoma, and the Utica Shale play in Ohio. Natural gas in shale plays now represents slightly more than half the U.S. total natural gas proved reserves.
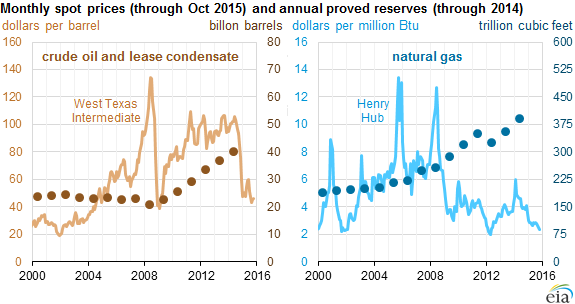
Sustained lower prices for crude oil and natural gas in 2015 are anticipated to reduce oil and natural gas proved reserves in EIA’s next annual report (for year-end 2015). Lower prices have curtailed oil and natural gas drilling and have made recovery economics more challenging. Although resource estimates are not necessarily reduced by lower prices, the calculation of proved reserves is sensitive to price.
8 Comments on "US oil, natural gas reserves increased in 2014"
Truth Has A Liberal Biias on Mon, 30th Nov 2015 11:53 pm
Lol a vast proportion of ‘the easy stuff’ currently in production isn’t even profitable under existing economic conditions. If it wasn’t for ZIRP, suckers and Wallstreet it’d have been tits up months ago. I hope KSA hangs on just long enough to trainwrecked the LTO-Wallstreet-Fed alliance before they themselves go broke and end up like Syria. Once KSA goes to shit that’ll be 30 million more people walking to Europe.
BillC on Tue, 1st Dec 2015 12:11 am
It’s a good idea to have plenty of oil on hand just in WWIII breaks loose.
Ralph on Tue, 1st Dec 2015 6:58 am
Proved reserves need to be economically extractable at the current market price. Given the fact that the price has fallen 65% since the 2014 accounting period, I would expect a dramatic decline in proved reserves once the 2015 figures are out.
In any case proved reserves are more of an accounting exercise than a realistic measure of oil under the ground. Historically oil companies have managed the rate of transition of resource and probable reserves to proven status in order to maximise shareholder return.
rockman on Tue, 1st Dec 2015 7:58 am
Ralph – Exactly. We all do understand that the EIA uses the price of oil to determine how much of a known accumulation of oil can be counted as “proved”, don’t we? IOW a potential reservoir that could produce 1 million of oil commercially at $90/bbl has 1 million bbls of proven reserves. But if only half that oil can be commercially recovered at $45/bbl then the EIA would assign only 500k bbls of proved reserves. More important: nearly all the increased US onshore oil reserves came from pubcos drilling the shales. As the price of oil decreases the US govt (thru the SEC regs) requires all those companies to redetermine the proved status of every bbl of oil. IOW the 2014 proved reserve numbers were determines using the 2014 oil prices. And in the coming months all those “proved reserves” will be redetermined using the 2015 oil prices. Given the decrease in new wells, the depletion of existing wells and much lower 2015 oil prices which way do we think the proved reserve number will be going?
Boat on Tue, 1st Dec 2015 8:32 am
Biiasman,
Lol a vast proportion of ‘the easy stuff’ currently in production isn’t even profitable under existing economic conditions.
So that’s why there is a glut. That’s why every day drilling rigs all over the world go to work producing the most oil ever.They want to lose money to prove their gov leaders are idiots. Or their companies are idiots.
I wonder if their mission statement reflects the doomers ideas. Get out there and lose money. The government can’t loan enough money. Will the drilling crowd please send out 10 rigs to unproductive land. LOl
Meanwhile, back at the ranch, the storage tanks are still filling.
JN2 on Tue, 1st Dec 2015 9:16 am
Is anyone else amazed that in the age of the iPhone we’ve just published 2014 data and it’s almost 2016?
JN2 on Tue, 1st Dec 2015 9:20 am
Boat, re storage tanks filling: did you see BobInget’s link yesterday? Author claims current global inventory is just 7 months supply. Compared to 1986 when it was 11+ years!
Boat on Tue, 1st Dec 2015 10:50 am
JN2
When oil prices are high there is very little inventory. It costs money to store.