https://fred.stlouisfed.org/graph/?g=Fib2
Producer prices inflate slower than consumer prices. In fact, they've fallen by half since 1950 relatively.
This is usually attributed to electronics and whatnot. But any capital improvement should flow to consumer prices, indicating that more inputs are needed for the same output- like predicted by EROI.
Rail miles, vehicle production, housing starts, oil wells, any measure of per capita capital stock has fallen since 1950 and so have living standards.


PeakOil is You
Consumer producer price wedge and EROI
Consumer producer price wedge and EROI
![]() by mustang19 » Fri 09 Jul 2021, 01:54:58
by mustang19 » Fri 09 Jul 2021, 01:54:58
- mustang19
- Permanently Banned
- Posts: 816
- Joined: Fri 06 Nov 2020, 20:43:52
Re: Consumer producer price wedge and EROI
![]() by Pops » Fri 09 Jul 2021, 08:58:19
by Pops » Fri 09 Jul 2021, 08:58:19
Hmm. Math isn't my thing but why divide?
If you subtract CPI index from PPI index the picture is more interesting...
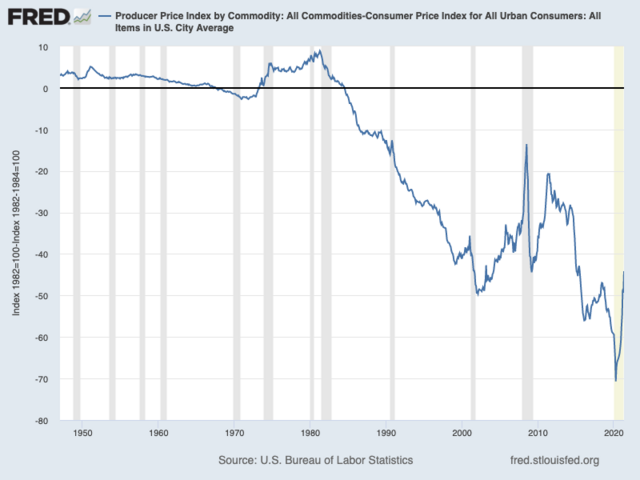
First thing is that the two were fairly balanced until US conventional peak / OPEC / end of gold standard, so either something structural changed or the resetting of the index that happened in 1980 either made the two more accurate or dramatically less so.
Second is that in the last months the spread has narrowed PPI closer to CPI (the index difference shrinking) so you can expect a big surge in consumer prices soon because that difference is profits I think.
Don't know if that's right or not or if you can do that to indexes of different things (raw materials and services vs consumer goods and services) but that's never stopped me before, LOL
If you subtract CPI index from PPI index the picture is more interesting...
First thing is that the two were fairly balanced until US conventional peak / OPEC / end of gold standard, so either something structural changed or the resetting of the index that happened in 1980 either made the two more accurate or dramatically less so.
Second is that in the last months the spread has narrowed PPI closer to CPI (the index difference shrinking) so you can expect a big surge in consumer prices soon because that difference is profits I think.
Don't know if that's right or not or if you can do that to indexes of different things (raw materials and services vs consumer goods and services) but that's never stopped me before, LOL
The legitimate object of government, is to do for a community of people, whatever they need to have done, but can not do, at all, or can not, so well do, for themselves -- in their separate, and individual capacities.
-- Abraham Lincoln, Fragment on Government (July 1, 1854)
-- Abraham Lincoln, Fragment on Government (July 1, 1854)
-

Pops - Elite

- Posts: 19746
- Joined: Sat 03 Apr 2004, 04:00:00
- Location: QuikSac for a 6-Pac
Re: Consumer producer price wedge and EROI
![]() by mustang19 » Fri 09 Jul 2021, 13:06:38
by mustang19 » Fri 09 Jul 2021, 13:06:38
Pops wrote:Hmm. Math isn't my thing but why divide?
If you subtract CPI index from PPI index the picture is more interesting...
First thing is that the two were fairly balanced until US conventional peak / OPEC / end of gold standard, so either something structural changed or the resetting of the index that happened in 1980 either made the two more accurate or dramatically less so.
Second is that in the last months the spread has narrowed PPI closer to CPI (the index difference shrinking) so you can expect a big surge in consumer prices soon because that difference is profits I think.
Don't know if that's right or not or if you can do that to indexes of different things (raw materials and services vs consumer goods and services) but that's never stopped me before, LOL
The wedge shows up when there's a lot of discoveries and materials prices are falling. This does, however not reflect a change in supply and consumer prices inflate to make up the difference.
The falling resource prices before the 90s were used to argue for abundance when they were really just a shift toward consumer inflation.
- mustang19
- Permanently Banned
- Posts: 816
- Joined: Fri 06 Nov 2020, 20:43:52
Re: Consumer producer price wedge and EROI
![]() by AdamB » Fri 09 Jul 2021, 15:24:19
by AdamB » Fri 09 Jul 2021, 15:24:19
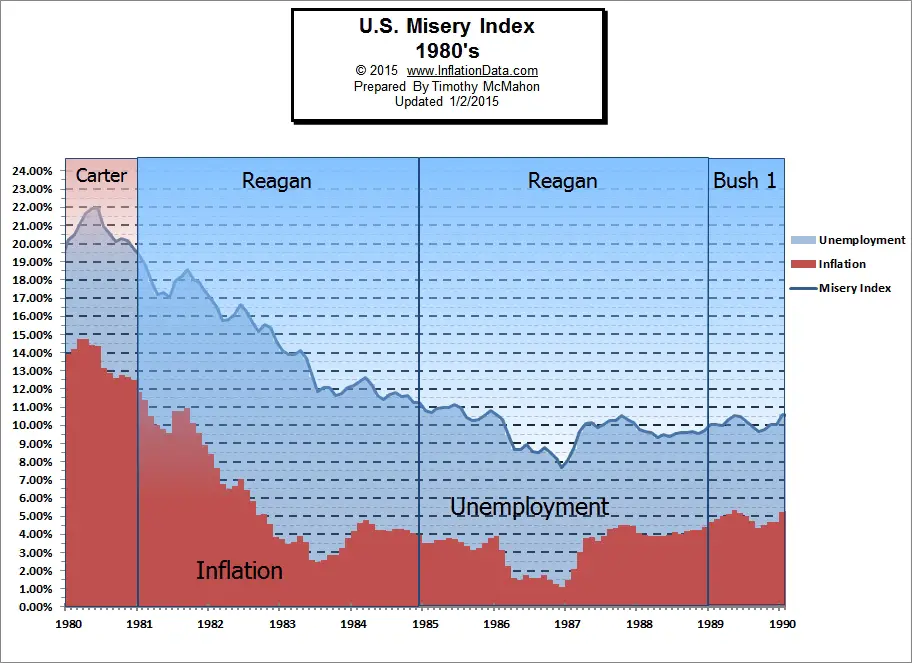
mustang19 wrote:The falling resource prices before the 90s were used to argue for abundance when they were really just a shift toward consumer inflation.
So..you want to troll claiming that inflation was going up in the 1980's? Huh.
Plant Thu 27 Jul 2023 "Personally I think the IEA is exactly right when they predict peak oil in the 2020s, especially because it matches my own predictions."
Plant Wed 11 Apr 2007 "I think Deffeyes might have nailed it, and we are just past the overall peak in oil production. (Thanksgiving 2005)"
Plant Wed 11 Apr 2007 "I think Deffeyes might have nailed it, and we are just past the overall peak in oil production. (Thanksgiving 2005)"
-

AdamB - Volunteer

- Posts: 9292
- Joined: Mon 28 Dec 2015, 17:10:26
Re: Consumer producer price wedge and EROI
![]() by mustang19 » Fri 09 Jul 2021, 16:11:33
by mustang19 » Fri 09 Jul 2021, 16:11:33
AdamB wrote:mustang19 wrote:The falling resource prices before the 90s were used to argue for abundance when they were really just a shift toward consumer inflation.
So..you want to troll claiming that inflation was going up in the 1980's? Huh.
No, that wasn't my claim. I merely pointed out that the cheapening of commodities didn't pass to consumer prices. But it barely matters anyway. Commodities going up or down relative to cpi will lower living standards regardless, because gas costs will dominate if it goes up. Commodity prices go down until eroi is so bad it's limiting production.
- mustang19
- Permanently Banned
- Posts: 816
- Joined: Fri 06 Nov 2020, 20:43:52
Re: Consumer producer price wedge and EROI
![]() by AdamB » Fri 09 Jul 2021, 18:05:56
by AdamB » Fri 09 Jul 2021, 18:05:56
mustang19 wrote:AdamB wrote:mustang19 wrote:The falling resource prices before the 90s were used to argue for abundance when they were really just a shift toward consumer inflation.
So..you want to troll claiming that inflation was going up in the 1980's? Huh.
No, that wasn't my claim.
Hence why I quoted your claim and then answered it. So you couldn't then claim I didn't know it.
Resource prices tended to fall pre-1990 because the world was awash in the go-go 80's, there was oil and resources aplenty..and a shift DOWNWARD of consumer inflation in the US.
mustang19 wrote:I merely pointed out that the cheapening of commodities didn't pass to consumer prices.
So you are saying the chart provided for the 1980's presented....was wrong? Were you around during the inflation of the 70's, and didn't notice the lack thereof progressing into the 80's?
mustang19 wrote:But it barely matters anyway.
Of course it doesn't. You have changed topics to troll on, and within a post or two proven it by declaring that the topic you want to talk about, wasn't really what you want to talk about, and your alleged claim "barely matters anyway". I agree. You should think about what you want to talk about more, in order to accomplish your stated goal of trolling.
Plant Thu 27 Jul 2023 "Personally I think the IEA is exactly right when they predict peak oil in the 2020s, especially because it matches my own predictions."
Plant Wed 11 Apr 2007 "I think Deffeyes might have nailed it, and we are just past the overall peak in oil production. (Thanksgiving 2005)"
Plant Wed 11 Apr 2007 "I think Deffeyes might have nailed it, and we are just past the overall peak in oil production. (Thanksgiving 2005)"
-
AdamB - Volunteer
- Posts: 9292
- Joined: Mon 28 Dec 2015, 17:10:26
Re: Consumer producer price wedge and EROI
![]() by mustang19 » Fri 09 Jul 2021, 18:50:29
by mustang19 » Fri 09 Jul 2021, 18:50:29
AdamB wrote:mustang19 wrote:AdamB wrote:mustang19 wrote:The falling resource prices before the 90s were used to argue for abundance when they were really just a shift toward consumer inflation.
So..you want to troll claiming that inflation was going up in the 1980's? Huh.
No, that wasn't my claim.
Hence why I quoted your claim and then answered it. So you couldn't then claim I didn't know it.
Resource prices tended to fall pre-1990 because the world was awash in the go-go 80's, there was oil and resources aplenty..and a shift DOWNWARD of consumer inflation in the US.mustang19 wrote:I merely pointed out that the cheapening of commodities didn't pass to consumer prices.
So you are saying the chart provided for the 1980's presented....was wrong? Were you around during the inflation of the 70's, and didn't notice the lack thereof progressing into the 80's?mustang19 wrote:But it barely matters anyway.
Of course it doesn't. You have changed topics to troll on, and within a post or two proven it by declaring that the topic you want to talk about, wasn't really what you want to talk about, and your alleged claim "barely matters anyway". I agree. You should think about what you want to talk about more, in order to accomplish your stated goal of trolling.
Producer prices fell from the 50s and grew after inflation was low.
- mustang19
- Permanently Banned
- Posts: 816
- Joined: Fri 06 Nov 2020, 20:43:52
Re: Consumer producer price wedge and EROI
![]() by AdamB » Fri 09 Jul 2021, 19:19:36
by AdamB » Fri 09 Jul 2021, 19:19:36
mustang19 wrote:Producer prices fell from the 50s and grew after inflation was low.
So now you are talking about producer prices falling since the 50's and before the 90's, and grew after inflation was low. Fine.
Producer price index chart from the Fed since 1920 The index only fell from Jan 86 through Dec 87. The rest of the time it was increasing from 1951 through 1997. So you apparently have no clue what producer prices were doing between 1950 and 1990.
US inflation rate, 1930 through about 2015
Please point out the time period inflation was flow, when the producer price index was falling. Easy answer...we know that the producer price index was only dipping and recovering Jan 86 through Dec 87, we check the inflation rate for that time period, and discover, if I squint, that inflation seemed to be decreasing slightly in that time frame. But it was by no means low, when compared to all inflation post the 1970's stagflation.
Anything else you want to say that we can disprove in a matter of minutes of googling data instead of listening to a bloviating troll? Do you really know nothing, or do you hit yourself in the head with a hammer prior to posting in order to imitate a mentally challenged child?
Plant Thu 27 Jul 2023 "Personally I think the IEA is exactly right when they predict peak oil in the 2020s, especially because it matches my own predictions."
Plant Wed 11 Apr 2007 "I think Deffeyes might have nailed it, and we are just past the overall peak in oil production. (Thanksgiving 2005)"
Plant Wed 11 Apr 2007 "I think Deffeyes might have nailed it, and we are just past the overall peak in oil production. (Thanksgiving 2005)"
-
AdamB - Volunteer
- Posts: 9292
- Joined: Mon 28 Dec 2015, 17:10:26
Re: Consumer producer price wedge and EROI
![]() by mustang19 » Fri 09 Jul 2021, 19:25:36
by mustang19 » Fri 09 Jul 2021, 19:25:36
AdamB wrote:mustang19 wrote:Producer prices fell from the 50s and grew after inflation was low.
So now you are talking about producer prices falling since the 50's and before the 90's, and grew after inflation was low. Fine.
Producer price index chart from the Fed since 1920 The index only fell from Jan 86 through Dec 87. The rest of the time it was increasing from 1951 through 1997. So you apparently have no clue what producer prices were doing between 1950 and 1990.
US inflation rate, 1930 through about 2015
Please point out the time period inflation was flow, when the producer price index was falling. Easy answer...we know that the producer price index was only dipping and recovering Jan 86 through Dec 87, we check the inflation rate for that time period, and discover, if I squint, that inflation seemed to be decreasing slightly in that time frame. But it was by no means low, when compared to all inflation post the 1970's stagflation.
Anything else you want to say that we can disprove in a matter of minutes of googling data instead of listening to a bloviating troll? Do you really know nothing, or do you hit yourself in the head with a hammer prior to posting in order to imitate a mentally challenged child?
I think the op proves enough, I don't care to post a chart.
- mustang19
- Permanently Banned
- Posts: 816
- Joined: Fri 06 Nov 2020, 20:43:52
Re: Consumer producer price wedge and EROI
![]() by AdamB » Fri 09 Jul 2021, 21:41:00
by AdamB » Fri 09 Jul 2021, 21:41:00
mustang19 wrote:I think the op proves enough, I don't care to post a chart.
I think the OP contradicts your claim of inflating producer price index (you know, because it goes DOWN for the decades in question), and "don't care to post" means "don't know how", and worse yet "oops now I realize my words don't match the chart I provided so I certainly don't want to demonstrate visually that I really am trolling".
You really need to learn stuff if you want to troll better Short...oops....I mean Mustang19.
Plant Thu 27 Jul 2023 "Personally I think the IEA is exactly right when they predict peak oil in the 2020s, especially because it matches my own predictions."
Plant Wed 11 Apr 2007 "I think Deffeyes might have nailed it, and we are just past the overall peak in oil production. (Thanksgiving 2005)"
Plant Wed 11 Apr 2007 "I think Deffeyes might have nailed it, and we are just past the overall peak in oil production. (Thanksgiving 2005)"
-
AdamB - Volunteer
- Posts: 9292
- Joined: Mon 28 Dec 2015, 17:10:26
Re: Consumer producer price wedge and EROI
![]() by Pops » Sat 10 Jul 2021, 08:51:31
by Pops » Sat 10 Jul 2021, 08:51:31
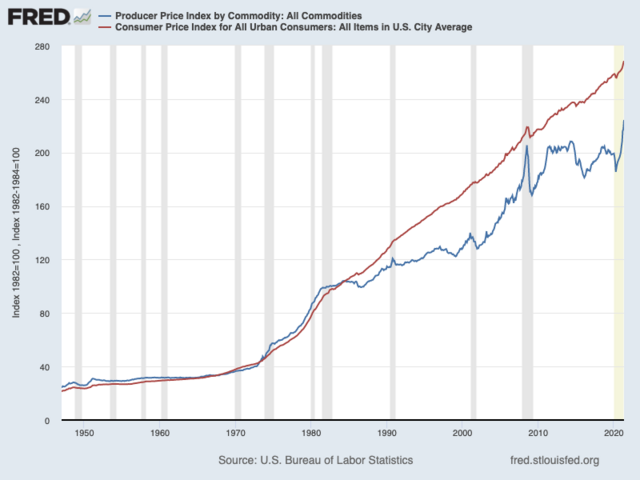
The previous charts were of the difference, here is one showing the values themselves.
I would guess a big part of this is industry weaned itself from oil post US conventional peak and OPEC repricing but consumers and commuters struggled on...
I would guess a big part of this is industry weaned itself from oil post US conventional peak and OPEC repricing but consumers and commuters struggled on...
The legitimate object of government, is to do for a community of people, whatever they need to have done, but can not do, at all, or can not, so well do, for themselves -- in their separate, and individual capacities.
-- Abraham Lincoln, Fragment on Government (July 1, 1854)
-- Abraham Lincoln, Fragment on Government (July 1, 1854)
-
Pops - Elite
- Posts: 19746
- Joined: Sat 03 Apr 2004, 04:00:00
- Location: QuikSac for a 6-Pac
Re: Consumer producer price wedge and EROI
![]() by Outcast_Searcher » Sat 10 Jul 2021, 11:53:39
by Outcast_Searcher » Sat 10 Jul 2021, 11:53:39
Pops wrote:The previous charts were of the difference, here is one showing the values themselves.
I would guess a big part of this is industry weaned itself from oil post US conventional peak and OPEC repricing but consumers and commuters struggled on...
In the real world, if the CPI is roughly up 180% over the past 40 years, while annoying over time, there's a simple and practical method for consumers / workers / retirees, etc. to defend themselves from that.
Simply invest steadily in broad based stock indexes like say, the S&P 500.
https://www.usinflationcalculator.com/
At a nominal growth rate of roughly 10% a year (dividends and capital gains, combined), we get long term US inflation of under 4% a year, so about 6% nominal growth of one's investments. Or using the rule of 72, a doubling of the nominal dollars in one's account every dozen years.
https://www.investopedia.com/ask/answer ... sp-500.asp
So while the dollar has depreciated to where what a dollar bought in 1982 takes about $2.80 to buy now, OTOH, a dollar in 1982 grew to roughly $9 in the stock market (3.3 twelve year doubling periods).
Far better than a sharp stick in the eye. In fact, good enough for steady middle class savers to retire on after a 40 year career, with Social Security as a nice bonus / safety margin.
Inflation seems to be an annoying "feature" over time, that comes with fiat currencies and banking, per modern history. But that doesn't mean it has to be doomed IF people use the information they have, some self discipline, and plan for and deal with it through investment.
And I know, the truly poor don't have the leeway to invest, though with the big $15 an hour wage push, we're rapidly ending that era in the US. That is IF people will choose to live where the cost of living is cheap, vs. choose to live in expensive cities and then blame "the elites" or "the Fed", when they find they don't have enough money for a serious long term savings/investment program.
Given the track record of the perma-doomer blogs, I wouldn't bet a fast crash doomer's money on their predictions.
-

Outcast_Searcher - COB

- Posts: 10142
- Joined: Sat 27 Jun 2009, 21:26:42
- Location: Central KY
Re: Consumer producer price wedge and EROI
![]() by mustang19 » Sat 10 Jul 2021, 12:29:10
by mustang19 » Sat 10 Jul 2021, 12:29:10
Outcast_Searcher wrote:Pops wrote:The previous charts were of the difference, here is one showing the values themselves.
I would guess a big part of this is industry weaned itself from oil post US conventional peak and OPEC repricing but consumers and commuters struggled on...
In the real world, if the CPI is roughly up 180% over the past 40 years, while annoying over time, there's a simple and practical method for consumers / workers / retirees, etc. to defend themselves from that.
Simply invest steadily in broad based stock indexes like say, the S&P 500.
https://www.usinflationcalculator.com/
At a nominal growth rate of roughly 10% a year (dividends and capital gains, combined), we get long term US inflation of under 4% a year, so about 6% nominal growth of one's investments. Or using the rule of 72, a doubling of the nominal dollars in one's account every dozen years.
https://www.investopedia.com/ask/answer ... sp-500.asp
So while the dollar has depreciated to where what a dollar bought in 1982 takes about $2.80 to buy now, OTOH, a dollar in 1982 grew to roughly $9 in the stock market (3.3 twelve year doubling periods).
Far better than a sharp stick in the eye. In fact, good enough for steady middle class savers to retire on after a 40 year career, with Social Security as a nice bonus / safety margin.
Inflation seems to be an annoying "feature" over time, that comes with fiat currencies and banking, per modern history. But that doesn't mean it has to be doomed IF people use the information they have, some self discipline, and plan for and deal with it through investment.
And I know, the truly poor don't have the leeway to invest, though with the big $15 an hour wage push, we're rapidly ending that era in the US. That is IF people will choose to live where the cost of living is cheap, vs. choose to live in expensive cities and then blame "the elites" or "the Fed", when they find they don't have enough money for a serious long term savings/investment program.
Stock market barely gains anything. Even if you held SPY in 1990 you'd make 3x after taxes. That's almost the same as treasuries.
And that was an ideal market, if you go back further it gets worse. During the 70s the market barely grew as prices doubled.
- mustang19
- Permanently Banned
- Posts: 816
- Joined: Fri 06 Nov 2020, 20:43:52
Re: Consumer producer price wedge and EROI
![]() by AdamB » Sat 10 Jul 2021, 12:35:09
by AdamB » Sat 10 Jul 2021, 12:35:09
mustang19 wrote:And that was an ideal market, if you go back further it gets worse. During the 70s the market barely grew as prices doubled.
Do old retired trolls reminisce much about a world that doesn't exist today? Because...who cares? It ain't the 70's, and you've demonstrated you can't even talk quantitatively about the past without getting it wrong in your sweeping generalizations. Not a surprise in an engineer that can't engineer, I understand, so if we need your opinion on how to write code for a .bat file in DOS, we'll let you know.

Plant Thu 27 Jul 2023 "Personally I think the IEA is exactly right when they predict peak oil in the 2020s, especially because it matches my own predictions."
Plant Wed 11 Apr 2007 "I think Deffeyes might have nailed it, and we are just past the overall peak in oil production. (Thanksgiving 2005)"
Plant Wed 11 Apr 2007 "I think Deffeyes might have nailed it, and we are just past the overall peak in oil production. (Thanksgiving 2005)"
-
AdamB - Volunteer
- Posts: 9292
- Joined: Mon 28 Dec 2015, 17:10:26
Re: Consumer producer price wedge and EROI
![]() by Outcast_Searcher » Sat 10 Jul 2021, 12:43:36
by Outcast_Searcher » Sat 10 Jul 2021, 12:43:36
mustang19 wrote:Stock market barely gains anything. Even if you held SPY in 1990 you'd make 3x after taxes. That's almost the same as treasuries.
You're so incompetent it's hard to even know what you're babbling. But saying "the stock market hardly gains anything" and saying that the market gains are "almost the same as treasuries" over time is so clearly wrong, that I'll respond. Even though I'm sure that with you, no learning will happen.
So, assuming you mean that from 1990 to now, the stock market only tripled, that's just COMPLETELY wrong, and it's easy to see that, if you'd only look instead of making random stuff up.
https://www.macrotrends.net/2324/sp-500 ... chart-data
Just using round numbers, in 1990, the S&P 500 was around 695, so let's call it 700. Now the S&P 500 is about 4370, but let's round down and call it 4350.
A 4th typical grader could eyeball 700 and 4350 and see that 4350 is OVER 6 times 700. MS Calc says it's
6.21. So that's over TWICE what you're claiming, and that's WITHOUT dividends.
With dividends reinvested, that's actually 1149% total return for the S&P 500 index from Jan 1990 to June 2021. Or roughly 8.4% a year.
https://dqydj.com/sp-500-return-calculator/
And tax rates vary wildly, depending on circumstances. In a ROTH IRA, no one pays any taxes on returns, ever. Or a middle income person in retirement might have capital gains taxes in the area of 10%. So your after tax claim (unsurprisingly, given so many of your claims) isn't credible AT ALL.
Now, treasuries have had the wind at their back since the early 80's, re total return. due to declining interest rates as a trend. But unlike the stock market, interest rates don't trend the same way forever. (And it's not like once rates get near zero that they have lots of room to continue dropping).
But trying to get a sense of the total return on treasury bonds vs. the S&P 500 index since 1990, I found a site, linked below, which gives reasonable looking figures.
So the total nominal return on the S&P 500 from 1990 through 2020 was about 20.52 times. ($28,895 grew to $592,868). As a sanity check, at a 10+% average annual growth, you'd get a doubling about every 7 years. So that's about 4.4 doublings in 31 years. So a little less than halfway between 2**4, or 16 and 2**5, or 32 is perhaps 22 or so. So that 20.52 matches well with what we'd expect.
For the treasury bonds, $1519 grew to $8921. Or about a 5.87 times total nominal return.
Now, in terms of scale, a small child knows that less than 6 times return is NOWHERE REMOTELY CLOSE to over 20 times return, no matter how you try to spin it with income taxes, etc. In fact, at a glance, the S&P total return was well over THREE times that of treasury bonds, not “almost the same”, as you claimed.
Why do you even bother to post, if that’s the best you can do re “facts” or math? No wonder you don't even try to post credible references.
http://pages.stern.nyu.edu/~adamodar/Ne ... retSP.html
Given the track record of the perma-doomer blogs, I wouldn't bet a fast crash doomer's money on their predictions.
-
Outcast_Searcher - COB
- Posts: 10142
- Joined: Sat 27 Jun 2009, 21:26:42
- Location: Central KY
Re: Consumer producer price wedge and EROI
![]() by mustang19 » Sat 10 Jul 2021, 15:43:50
by mustang19 » Sat 10 Jul 2021, 15:43:50
Outcast_Searcher wrote:mustang19 wrote:Stock market barely gains anything. Even if you held SPY in 1990 you'd make 3x after taxes. That's almost the same as treasuries.
You're so incompetent it's hard to even know what you're babbling. But saying "the stock market hardly gains anything" and saying that the market gains are "almost the same as treasuries" over time is so clearly wrong, that I'll respond. Even though I'm sure that with you, no learning will happen.
So, assuming you mean that from 1990 to now, the stock market only tripled, that's just COMPLETELY wrong, and it's easy to see that, if you'd only look instead of making random stuff up.
https://www.macrotrends.net/2324/sp-500 ... chart-data
Just using round numbers, in 1990, the S&P 500 was around 695, so let's call it 700. Now the S&P 500 is about 4370, but let's round down and call it 4350.
A 4th typical grader could eyeball 700 and 4350 and see that 4350 is OVER 6 times 700. MS Calc says it's
6.21. So that's over TWICE what you're claiming, and that's WITHOUT dividends.
With dividends reinvested, that's actually 1149% total return for the S&P 500 index from Jan 1990 to June 2021. Or roughly 8.4% a year.
https://dqydj.com/sp-500-return-calculator/
And tax rates vary wildly, depending on circumstances. In a ROTH IRA, no one pays any taxes on returns, ever. Or a middle income person in retirement might have capital gains taxes in the area of 10%. So your after tax claim (unsurprisingly, given so many of your claims) isn't credible AT ALL.
Now, treasuries have had the wind at their back since the early 80's, re total return. due to declining interest rates as a trend. But unlike the stock market, interest rates don't trend the same way forever. (And it's not like once rates get near zero that they have lots of room to continue dropping).
But trying to get a sense of the total return on treasury bonds vs. the S&P 500 index since 1990, I found a site, linked below, which gives reasonable looking figures.
So the total nominal return on the S&P 500 from 1990 through 2020 was about 20.52 times. ($28,895 grew to $592,868). As a sanity check, at a 10+% average annual growth, you'd get a doubling about every 7 years. So that's about 4.4 doublings in 31 years. So a little less than halfway between 2**4, or 16 and 2**5, or 32 is perhaps 22 or so. So that 20.52 matches well with what we'd expect.
For the treasury bonds, $1519 grew to $8921. Or about a 5.87 times total nominal return.
Now, in terms of scale, a small child knows that less than 6 times return is NOWHERE REMOTELY CLOSE to over 20 times return, no matter how you try to spin it with income taxes, etc. In fact, at a glance, the S&P total return was well over THREE times that of treasury bonds, not “almost the same”, as you claimed.
Why do you even bother to post, if that’s the best you can do re “facts” or math? No wonder you don't even try to post credible references.
http://pages.stern.nyu.edu/~adamodar/Ne ... retSP.html
You ignore taxes like I said
- mustang19
- Permanently Banned
- Posts: 816
- Joined: Fri 06 Nov 2020, 20:43:52
Re: Consumer producer price wedge and EROI
![]() by AdamB » Sat 10 Jul 2021, 18:41:34
by AdamB » Sat 10 Jul 2021, 18:41:34
mustang19 wrote:You ignore taxes like I said
You get to ignore data, reality, science and whatnot, so sounds like Outcast_Searcher is WAY ahead of you!
Plant Thu 27 Jul 2023 "Personally I think the IEA is exactly right when they predict peak oil in the 2020s, especially because it matches my own predictions."
Plant Wed 11 Apr 2007 "I think Deffeyes might have nailed it, and we are just past the overall peak in oil production. (Thanksgiving 2005)"
Plant Wed 11 Apr 2007 "I think Deffeyes might have nailed it, and we are just past the overall peak in oil production. (Thanksgiving 2005)"
-
AdamB - Volunteer
- Posts: 9292
- Joined: Mon 28 Dec 2015, 17:10:26
Re: Consumer producer price wedge and EROI
![]() by Outcast_Searcher » Sat 10 Jul 2021, 22:07:23
by Outcast_Searcher » Sat 10 Jul 2021, 22:07:23
mustang19 wrote:You ignore taxes like I said
Like I said, for most, real world, long term capital gains taxes are like 10%.
Or they're 20% at MOST, unless Biden gets his way re making them huge. And given the beltway crew, good luck with THAT.
If you're too stupid to adjust things by 10 or 20 percent and not realize that it doesn't make your claim of 3X valid against the reality of more like 20.5X -- you're too "intelligence challenged" to even ride the short bus to school.
So what random nonsense do you want to try now?

For someone who wants to call others "mentally deficient", showing intelligence beyond, say, that of the average bacteria would be called for.

Last edited by Outcast_Searcher on Sat 10 Jul 2021, 23:01:24, edited 1 time in total.
Given the track record of the perma-doomer blogs, I wouldn't bet a fast crash doomer's money on their predictions.
-
Outcast_Searcher - COB
- Posts: 10142
- Joined: Sat 27 Jun 2009, 21:26:42
- Location: Central KY
Re: Consumer producer price wedge and EROI
![]() by mustang19 » Sat 10 Jul 2021, 22:39:16
by mustang19 » Sat 10 Jul 2021, 22:39:16
Outcast_Searcher wrote:You ignore taxes like I sail quote]
Like I said, for most, real world, long term capital gains taxes are like 10%.
Or they're 20% at MOST, unless Biden gets his way re making them huge. And given the beltway crew, good luck with THAT.
If you're too stupid to adjust things by 10 or 20 percent and not realize that it doesn't make your claim of 3X valid against the reality of more like 20.5X -- you're too "intelligence challenged" to even ride the short bus to school.
So what random nonsense do you want to try now?
For someone who wants to call others "mentally deficient", showing intelligence beyond, say, that of the average bacteria would be called for.
In California after Biden the tax rate is 50-60%
- mustang19
- Permanently Banned
- Posts: 816
- Joined: Fri 06 Nov 2020, 20:43:52
Re: Consumer producer price wedge and EROI
![]() by Outcast_Searcher » Sat 10 Jul 2021, 23:18:06
by Outcast_Searcher » Sat 10 Jul 2021, 23:18:06
mustang19 wrote: You ignore taxes like I said
Outcast_Searcher wrote:Like I said, for most, real world, long term capital gains taxes are like 10%.
Or they're 20% at MOST, unless Biden gets his way re making them huge. And given the beltway crew, good luck with THAT.
If you're too stupid to adjust things by 10 or 20 percent and not realize that it doesn't make your claim of 3X valid against the reality of more like 20.5X -- you're too "intelligence challenged" to even ride the short bus to school.
So what random nonsense do you want to try now?
For someone who wants to call others "mentally deficient", showing intelligence beyond, say, that of the average bacteria would be called for.
In California after Biden the tax rate is 50-60%[/quote]
Go ahead, cite your sources, because as usual you're dead wrong.
IF the Biden administration COMPLETELY gets its way, the right is whining that the capital gains tax rate COULD POTENTIALLY end up below 50% -- but ONLY for those making over $1 MILLION a year in adjusted gross income.
Are you REALLY so lame you can't do better than that? NO citations. NO accuracy. NO credibility. NO NOTHING.
But you expect to be taken seriously here?
Hint: being dead wrong post after post with NO SIGN of being right isn't helping your case.
https://www.bankrate.com/investing/long ... gains-tax/
Long-term capital gains tax rates for the 2021 tax year
FILING STATUS 0% RATE 15% RATE 20% RATE
Single Up to $40,400 $40,401 – $445,850 Over $445,850
Married filing jointly Up to $80,800 $80,801 – $501,600 Over $501,600
Married filing separately Up to $40,400 $40,401 – $250,800 Over $250,800
Head of household Up to $54,100 $54,101 – $473,750 Over $473,750
Here's a BIG HINT someone with even your level of perception should be able to understand. 20% is NOT over 50%, even if you count CA tax.
And again, re what Biden has PROPOSED doing (again, a hint: a proposal is NOT law, which if you could read like an adult, you'd know):
https://www.cnbc.com/2021/06/21/biden-t ... world.html
The Biden administration policy targets the richest Americans — the top 0.3% — because they are often able to manipulate the tax system in their favor, according to a White House official. It’s therefore unfair to compare the top tax rate more broadly, the official said.
Biden’s proposal would raise the top federal rate on long-term capital gains and qualified dividends to 39.6%, from 20%, for taxpayers with annual income over $1 million.
You DO understand that those who have adjusted gross income of over $1 million in the US are NOT the normal folks, right?
So what's next, since you never admit when you're wrong. Make up more shiite out of whole cloth, without any citations, of course?
BTW, I had to straighten up your mangling of the quote function and what you typed (said is not sail), re your continued incompetence with using the quote function, so I put what you initially said in blue, just to indicate that. Given that no telling WHAT you'll falsely claim next.
Given the track record of the perma-doomer blogs, I wouldn't bet a fast crash doomer's money on their predictions.
-
Outcast_Searcher - COB
- Posts: 10142
- Joined: Sat 27 Jun 2009, 21:26:42
- Location: Central KY
28 posts
• Page 1 of 2 • 1, 2
Who is online
Users browsing this forum: No registered users and 15 guests