Yup D, you beat me to it, Paul B. is right on top of it:
https://www.youtube.com/watch?v=BAtupbr80pENo place on Earth is warming faster than the high Arctic, and Siberia is rapidly changing before our very eyes. Along with reports on Siberian locals having swimsuit skiing day, papers are headlining new crater formation from methane explosions.
I tell the story of these blowholes, and what they mean in terms of methane release in the Arctic and rapid global climate change.
https://www.youtube.com/watch?v=iP-Ra9yO-TESecret space, conspiracy affairs....
Testimony on chem trails, fukushima, dna damage.....
I thing our corrupt management is going beserk, last ditch efforts to buy time before they scramble to doomstead palaces and start genocide on a massive scale instead of this war of terror, some bombs and wars here and there, depleted uranium use.......
Air alarm is just going off here in Holland, beep on my mobile.....they are prepping for sure, private army to keep them mob alive, survival at all cost, kill others.
https://www.youtube.com/watch?v=aZ1-2tV ... 84.3112951Vast amounts of methane exists within ocean floor sediments on the Eastern Siberian Arctic Shelf, in the form of methane hydrates & free methane gas. Up to recently, gas release to the shallow water column (50 meters deep) & atmosphere has been slow, with the subsea permafrost acting as a million corks on a million champagne bottles to contain the methane. Now, rapid thawing of the permafrost has released 10% of the corks, allowing rapid ongoing increases in methane release.
https://www.youtube.com/watch?v=1dc6t94MdtMRiver on fire! Incredible but true!
60 gas leaks found in Medina apartment.
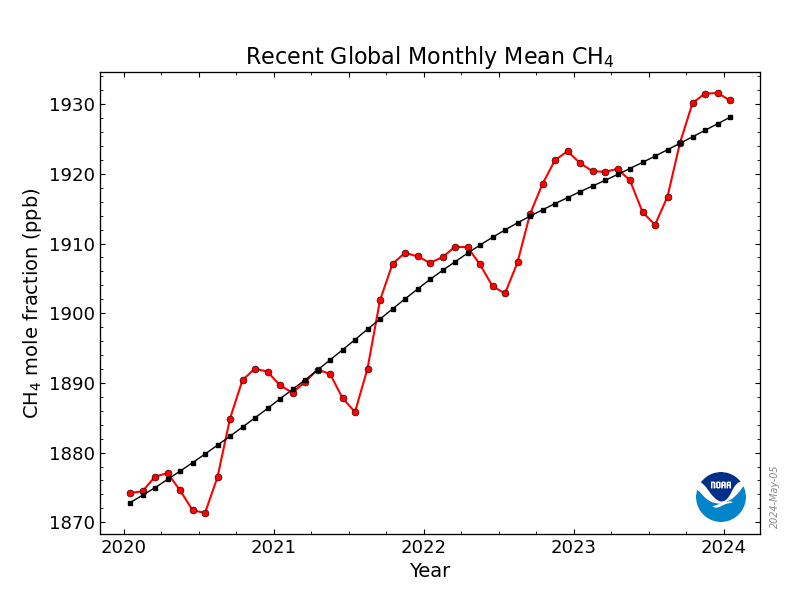
New Report Details Alarming Rise in Methane Gas.
Ancient Earth Wasn't Surrounded By Methane Gas.
Climate change- permafrost meltdown raises risk of catastrophic global warming.
A river on fire!- MP sets fire to methane gas on Condamine river, Australia.
Methane gas threatening to slow efforts to slow climate change.
Methane Leaks From Oil and Gas Wells Now Top Polluters.
Scientists Find 7,000 Methane 'Bubbles' Trapped Underground in Siberia.
Tons of Methane Gas Might Cost the World $60 Trillion.
https://www.youtube.com/watch?v=m5X1MUP9ekURant of Humptydumpty at Eastbumblef...beware of strong language

Sam C. mystery......no mystery is where the methane rise comes from....The far North. Geoengineering idea's, Al Gore, Alex Jones, a second volcano to handle the first that has been going of since last decade.
Since I could find no mention of climate change anywhere in Yahoo News the past week, I will turn my attention in this rant over to a Russia Today (RT) video asking the question whether the human race even has ten years left?
Here is a link to "Sam Carana's" Arctic News blog:
http://arctic-news.blogspot.com/
https://www.youtube.com/watch?v=COdXq2IAxj4See the ground bubble up!
Methane is between 100 and 120 times more potent as a greenhouse gas than carbon dioxide. This being said there is enough methane trapped under the permafrost in the arctic to extinguish all life on earth many times over. This is not a good situation to have on an ever warming planet where the poles are the most susceptible to changes in the environment. Russian scientists have recently discovered more than 200 lakes that are bubbling and releasing methane. Also very large holes and craters that used to have an unknown origin have also been attributed to the methane gas being released. This is a very urgent and dire situation that all of humanity needs to focus on right now or else there wont be a foreseeable future for anyone.
This event, methane up and sea ice gone might be the most important event ever happening on Earth, the fastest most lethal extinction event ever.
The dino's were wiped out by an astroid but the other extinction events were Climate related events, abrupt and likely caused by the methane mechanism.
Unfortunately we will all soon find out how rapid and how lethal it is.
I simply cannot see how we can hold it together for another decade, ships will not carry goodies around the world, trucks will not deliver daily fresh at the grocery stores. Power will fail soon after. World war Z in real time.
People will panic, go mad from hunger, fear, thirst....about every society before us that collapsed turned to cannibalism......bbbbrrrrr.
Now a worldwide collapse for the first and maybe the last time.
https://www.youtube.com/watch?v=HcwTxRuq-ukA U.N. employee is racing against time and fate, as he travels the world trying to stop the outbreak of a deadly Zombie pandemic.
Beware.....super fast zombies...scary as hell.
A better survival doom movie:
https://www.youtube.com/watch?v=X-CGmuLoVJgAn epidemic has wiped out most of humanity, and Ann has been forced to hide in the woods. Accustomed to isolation and a wild environment, she does not know how to react when Chris and Olivia meet in their path. For Ann, killing infected and fleeing permanently is much easier than relating to someone again.
Where to do your last battle, dance on Earth?
Into the wild or downtown?
I think we got less than 5 years to go North with as much gear and people as possible. Canada still the best option, more trees less people.


![[smilie=llorar.gif]](https://peakoil.com/forums/images/smilies/llorar.gif "llorar")
