"rabbling"
I like that, and intend to steal it.


PeakOil is You
U.S. to Slash Marcellus Shale Gas Estimate 80%
Re: U.S. to Slash Marcellus Shale Gas Estimate 80%
![]() by Synapsid » Tue 02 Sep 2014, 20:58:16
by Synapsid » Tue 02 Sep 2014, 20:58:16
- Synapsid
- Tar Sands

- Posts: 780
- Joined: Tue 06 Aug 2013, 21:21:50
Re: U.S. to Slash Marcellus Shale Gas Estimate 80%
![]() by dissident » Sat 02 May 2015, 11:35:26
by dissident » Sat 02 May 2015, 11:35:26
(http://energyskeptic.com/2015/david-hug ... marcellus/)
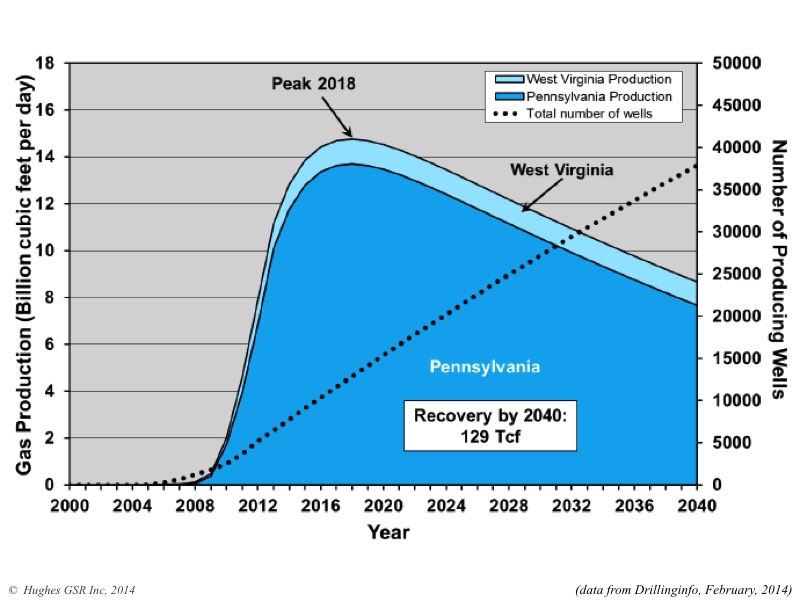
The linear decline out to 2040 looks grossly unrealistic to me. This is a fracked set of plays and the technology contribution to well productivity is maxed out. No conventional reservoir has a linear decline profile so why would a tight gas reservoir with fast well depletion (necessitating much higher rates of drilling) have more persistence. It does not make physical sense. If the peak is in 2018, then production will be down to around 20-25% by 2040.
- dissident
- Expert

- Posts: 6458
- Joined: Sat 08 Apr 2006, 03:00:00
Re: U.S. to Slash Marcellus Shale Gas Estimate 80%
![]() by rockdoc123 » Sat 02 May 2015, 12:21:22
by rockdoc123 » Sat 02 May 2015, 12:21:22
No conventional reservoir has a linear decline profile so why would a tight gas reservoir with fast well depletion (necessitating much higher rates of drilling) have more persistence.
well first off it depends on where in the production history you are looking....large parts of the decline history of reservoirs under exponential decline for all intents and purposes can be treated as linear. Shale production has an early exponential decline phase where rates of 70-80% decline can occur over the first 24-36 months after which the decline is hyperbolic in nature.
the important point, however is that when you are continually adding wells to the mix the decline is a product not just of individual declines but of the total wells. In essence it has a lot to do with the decreasing rate of drilling plus the pace.
This is shown fairly well in an example from the Barnett:

-

rockdoc123 - Expert
- Posts: 7685
- Joined: Mon 16 May 2005, 03:00:00
Re: U.S. to Slash Marcellus Shale Gas Estimate 80%
![]() by Keith_McClary » Sat 02 May 2015, 13:09:00
by Keith_McClary » Sat 02 May 2015, 13:09:00
Synapsid wrote:"rabbling"
I like that, and intend to steal it.
transitive verb
: to insult or assault by or as a mob
Facebook knows you're a dog.
-

Keith_McClary - Light Sweet Crude

- Posts: 7344
- Joined: Wed 21 Jul 2004, 03:00:00
- Location: Suburban tar sands
Re: U.S. to Slash Marcellus Shale Gas Estimate 80%
![]() by dissident » Sat 02 May 2015, 16:25:08
by dissident » Sat 02 May 2015, 16:25:08
Oh, I see now, it's prediction from finger painting. There will be some orderly development of totally identical subprojects which will give us the absurd linear production decline. There will not be any tendency to develop more now instead of self-rationing and the forecasters have crystal balls that give them exact information about the production capacity of any development in the future.
Yeah, right.
The point stands, no existing field (gas and oil) of any size shows a linear production decline. And no collection of projects has this behaviour either. At best you have multiple production peaks.
Yeah, right.
The point stands, no existing field (gas and oil) of any size shows a linear production decline. And no collection of projects has this behaviour either. At best you have multiple production peaks.
- dissident
- Expert
- Posts: 6458
- Joined: Sat 08 Apr 2006, 03:00:00
Re: U.S. to Slash Marcellus Shale Gas Estimate 80%
![]() by rockdoc123 » Sat 02 May 2015, 19:46:16
by rockdoc123 » Sat 02 May 2015, 19:46:16
Oh, I see now, it's prediction from finger painting. There will be some orderly development of totally identical subprojects which will give us the absurd linear production decline. There will not be any tendency to develop more now instead of self-rationing and the forecasters have crystal balls that give them exact information about the production capacity of any development in the future.
Hardly finger painting. The way these projections are put together is by taking current production and curve fitting to type curves for that particular play making the assumption that economics are positive going forward. The planned new wells are modeled with an average type curve. This methodology has proven to be fairly accurate when it was applied to conventional North American gas back in the seventies and eighties. Shale is much more predictable than conventional plays, there is little in the way of geologic risk involved and the statistical mean of wells in a given area will approach the average type curve which has been demonstrated by numerous producers. The gradual linear decline of the entirety of the play will not be governed by the decline of an individual well it is governed by the fact fewer wells are being drilled each year. This is pretty basic math. Plot it up for yourself if you don't believe me.
As to there being no tendency to develop more although the well count has dropped drilling continues, it isn't going to suddenly stop especially so in the Marcellus where much of the play has a breakeven cost below $2/Mcf. You confuse the decline in a field where all the wells are drilled and produced at a max rate for a plateau period after which declines set in. No new wells are being drilled so the overall decline will look mostly exponential with a late hyperbolic portion. This is completely different than when wells are continued to be added through time albeit at ever decreasing rate.
-
rockdoc123 - Expert
- Posts: 7685
- Joined: Mon 16 May 2005, 03:00:00
Re: U.S. to Slash Marcellus Shale Gas Estimate 80%
![]() by ROCKMAN » Mon 04 May 2015, 02:11:58
by ROCKMAN » Mon 04 May 2015, 02:11:58
Just a friendly reminder: any RECOVERABLE reserve estimate that doesn't include a future price curve projection is completely meaningless. Just consider last years projection of recoverable Eagle Ford Shale reserves when oil was $100/bbl vs what it is now at the lower prices.
-
ROCKMAN - Expert
- Posts: 11397
- Joined: Tue 27 May 2008, 03:00:00
- Location: TEXAS
27 posts
• Page 2 of 2 • 1, 2
Return to Peak oil studies, reports & models
Who is online
Users browsing this forum: No registered users and 6 guests