Executive Summary
This study extends the work done for the Australian Greenhouse Office (AGO) on the life-cycle assessment of emissions from heavy vehicles. It does so by using the same methodology and applying it to light vehicles. Petrol, diesel, LPG (dual-fuel) and CNG fuels and a number of vehicle technologies were examined.
On a full-fuel cycle basis, when vehicles are normalised to remove mass differences, the lowest greenhouse gas (GHG) emissions are from hybrid electric vehicles. Diesel vehicles emit less exbodied GHG (exbodied emissions are the sum of the pre-combustion emissions and the tailpipe emissions) than petrol, LPG or CNG vehicles, which also means that a diesel-hybrid would have lower exbodied GHG emissions than a petrolhybrid. Diesel vehicles also have lower exbodied emissions of carbon monoxide and nonmethanic volatile organic compounds (NMVOC) than petrol, LPG, and CNG. However, diesel vehicles emit more particulate matter than any other fuel class.
Exbodied LPG emissions are below those of the equivalent class of petrol vehicle for all types of fuels (propane and autogas) and for all emissions except for carbon monoxide. The equivalent class of petrol vehicle means that second generation LPG vehicles1 are compared with ULP vehicles, whereas third generation LPG vehicles are compared with PULP vehicles. These findings refer to dual-fuel LPG vehicles manufactured on the production line or post-equipped under the control of the car manufacturer. We expect after-market conversions to LPG to perform more poorly, but would also expect dedicated single-fuel LPG to perform better.
CNG vehicles have lower GHG emissions than petrol and second generation LPG vehicles, but higher emissions than diesel and third generation LPG vehicles. Third generation LPG vehicles have the lowest NMVOC, NOx and PM emissions. CNG emissions of NOx and PM are comparable with third generation LPG whereas CNG emissions of NMVOC are slightly higher.
However, these results depend on the drive cycle used to examine the emissions. The above conclusions are based on the European Drive Cycle (EDC) that is required under ADR 79. Under the Artemis Drive Cycle recently introduced as a test drive cycle in Europe, the GHG tailpipe emissions of CNG are less than those of diesel vehicles, whereas the reverse is the case under the EDC and the Australian Urban Drive Cycle (AUDC). This indicates that vehicle technology and catalytic converter technology need to be very tightly designed for optimum performance and minimum emissions. It is for this reason that we expect that dedicated LPG vehicles should be able to be more tightly designed and thus have lower emissions than dual-fuel vehicles.
Present day health concerns associated with motor vehicle emissions are predominantly focussed on particulate matter (PM10, PM2.5, PM1). LPG (third generation) vehicles have the lowest tailpipe emissions of PM10, but on a life-cycle basis the PM10 emissions from LPG and CNG are comparable, and are less than those from diesel, petrol or even hybrid vehicles.
We examined the effect of vehicle mass by examining the exbodied emissions to be expected from a compact-sized vehicle of approximately 1000 kg — compared with the reference family-sized vehicle of 1,700 kg mass. The same relativities hold in both cases, but the absolute values of the emissions are much lower in the case of smaller cars. Thus the reference ULP (less than 150 ppm sulfur) vehicle emits 349 g CO2-e per km on a fullfuel cycle basis; the equivalent Euro 4 PULP vehicle (with less than 50 ppm sulfur) emits 289 g CO2-e per km, whereas a petrol hybrid of the same mass emits 200 g CO2-e per km. However, a compact Euro 4 PULP vehicle of 1130 kg emits 191 g CO2-e per km, a petrol hybrid such as the 2003 Prius emits 128 g CO2-e per km, whereas the Honda insight (950 kg) emits only 101 g CO2-e per km.
A comparison of exbodied emissions is provided in charts ES.1–ES.5, and is also presented in Section 7.2 of the report. The bar charts show the emissions per km for family vehicles (1,700 kg).
The effects of vehicle mass are most marked in the case of fuel consumption and GHG emissions. Emissions of the criteria pollutants are more dependent on vehicle technologies and emission control systems.
A summary of the results of the analysis of emissions per km is presented in Table ES.1.
http://www.greenhouse.gov.au/transport/ ... icles.html


PeakOil is You
Emissions from petrol and alt-fuel vehicles
First unread post • 8 posts
• Page 1 of 1
Emissions from petrol and alt-fuel vehicles
![]() by Graeme » Sat 18 Jun 2005, 14:57:37
by Graeme » Sat 18 Jun 2005, 14:57:37
-

Graeme - Fusion

- Posts: 13258
- Joined: Fri 04 Mar 2005, 04:00:00
- Location: New Zealand
![]() by lorenzo » Sat 18 Jun 2005, 18:29:11
by lorenzo » Sat 18 Jun 2005, 18:29:11
Very good info. I find it often difficult to convince people, especially Americans, that diesel (hybrid) cars are the cleanest. They have this wrong image of diesel being old world, dirty polluting stuff. While the contrary is true.
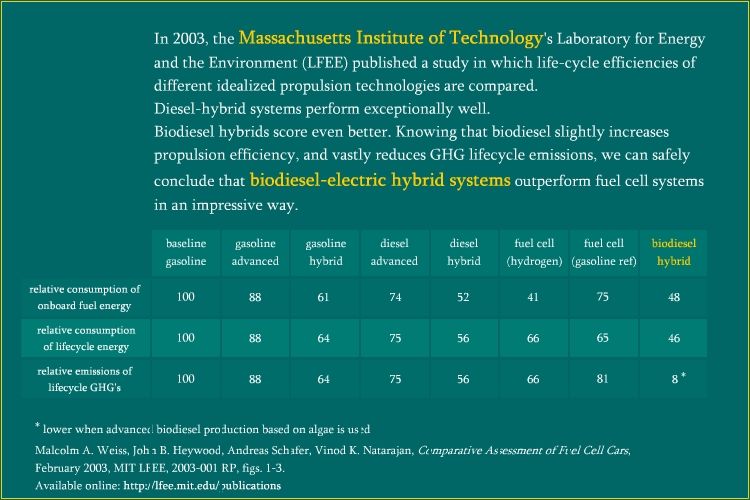
Let me add the results of an MIT study about future propulsion technologies. They conclude that diesel-hybrids are the best option, since they are more efficient and cleaner than either gasoline, gasoline hybrids, gasoline fuel cells or hydrogen fuel cells.
Biodiesel hybrids score best of all.
Please find a graphic presentation of this study, here.
-

lorenzo - Intermediate Crude

- Posts: 2184
- Joined: Sat 01 Jan 2005, 04:00:00
![]() by The_Toecutter » Sat 18 Jun 2005, 20:11:56
by The_Toecutter » Sat 18 Jun 2005, 20:11:56
A battery electric car is the cleanest of all. Even if the electricity is gotten from a coal-fired powerplant, emissions are still lower than a Hinda Insight hybrid per mile of use. From wind or solar, emsisions are effectively zero, aside from the amount of emissions associated with the production of aeolic and solar energy sources, but those emissions are very, very, negligable given the lifespan of aeolic and solar energy sources.
The unnecessary felling of a tree, perhaps the old growth of centuries, seems to me a crime little short of murder. ~Thomas Jefferson
-

The_Toecutter - Intermediate Crude
- Posts: 2114
- Joined: Sat 18 Jun 2005, 03:00:00
![]() by lorenzo » Sat 18 Jun 2005, 20:24:49
by lorenzo » Sat 18 Jun 2005, 20:24:49
In principle, biodiesel-hybrids could have zero emissions too. And their life-cycle would be cheaper than clean-electricity electric cars.
Solar/wind+batteries is way more expensive than organically grown biodiesel+combustion engine.
Only when the costs of solar energy and of batteries come down, will full clean electric cars become competitive.
Solar/wind+batteries is way more expensive than organically grown biodiesel+combustion engine.
Only when the costs of solar energy and of batteries come down, will full clean electric cars become competitive.
-
lorenzo - Intermediate Crude
- Posts: 2184
- Joined: Sat 01 Jan 2005, 04:00:00
![]() by The_Toecutter » Sat 18 Jun 2005, 21:30:25
by The_Toecutter » Sat 18 Jun 2005, 21:30:25
In principle, biodiesel-hybrids could have zero emissions too.
Correction: net zero CO2 emissions. Biodiesel still emits particulates nitrogen oxides, and other fun stuff, but it is very, very low compared to gasoline and diesel cars today.
And their life-cycle would be cheaper than clean-electricity electric cars.
True in the case the electric car is using a hand-made battery pack. Otherwise, in a mass production scenario, this is very false. Biodiesel would have to be about $.70 a gallon to be as cheap to run as a battery electric car, and it could come close would hemp be used to make the biodiesel since hemp needs no pesticides and can be grown in the least fertile of environments, but the good old federal government won't let us do that. The oil companies hate the idea of people making their own fuel, the pharmaceutical industries don't want people to be able to grow their own painkillers, and way back in the day, it was William Randolph Hearst and his paper industry along with DuPont who lobbied the government to outlaw domestic production of both marijuana and its non intoxicating industrial form, both of which can substitute for oil very nicely and be grown on land that would otherwise go unused because no other crop can grow there.
The per acre yield of hemp for biodiesel is about 1/5 that of Palm oil, but on the plus side, the EROI of hemp is much higher than any other plant out there.
Solar/wind+batteries is way more expensive than organically grown biodiesel+combustion engine.
Up front, yes, but not on a per mile travelled basis. All in the fact that the electric motor will well outlast the diesel engine by far.
Only when the costs of solar energy and of batteries come down, will full clean electric cars become competitive.
solar electricity is $.16-.20 per kWh. Take away the subsidies to the current nuclear plants we have, and solar is competitive with that. Wind per kWh without subisidies is now cheaper than coal with subsidies. But solar and wind have a lot less processes involved with the production of their energy, and those processes keep the energy system centralized and controlled. Thus the current industry frowns upon them. If you mass produce wind and solar generators for hundreds of millions of people, prices decline to where your common everyday Joe can afford to install it themselves, and decentralization ahoy. and thus the big industries are always lobbying against it.
For batteries, it is also resting in production volume. In volume for 20,000 cars per year, a 30 kWh NiMH battery pack for 200 miles range and able to support a 150 horsepower electric drive system would cost $4,500 and last over 250,000 miles. It would be entirely recyclable, and could be quick charged in 15 minutes with a powerful enough charger. But Chevron Texaco bought the patent and refuses to offer automotive sized modules at an affordable price, and instead is charging $4,000 per kWh. That makes sure that $4,500 battery pack becomes a $120,000 one. Lithium ion can provide double the range, and exponentially more battery horsepower, but automotive sized Li Ion batteries aren't even produced, let alone mass produced for automotive application. In mass production for automotive application, a 50 kWh Li Ion battery pack for 300 miles range would be significantly less than $10,000 and last at least as long as the NiMH. But without automotive size modules, people are either relegated to using prototype Li Ions that cost > $1,000 per kWh, or relegated to hand-assembling a battery pack from 6,000+ labtop computer batteries, whos management system is horrendously complex. Meanwhile, the major players in the battery industry are slow to place out new products to maximize profits on the products currently for sale. Just wait for the Chinese to finally mass produce an automotive Li Ion battery, and watch the oil industry squirm, and perhaps terrorize and kill to get control of that patent. Kokam looks to be the front runner. Their battery would be excellent in an electric musclecar.
The unnecessary felling of a tree, perhaps the old growth of centuries, seems to me a crime little short of murder. ~Thomas Jefferson
-
The_Toecutter - Intermediate Crude
- Posts: 2114
- Joined: Sat 18 Jun 2005, 03:00:00
![]() by lorenzo » Sun 19 Jun 2005, 10:54:44
by lorenzo » Sun 19 Jun 2005, 10:54:44
TheToeCutter, you seem to know a lot about this subject. I hope you're right about the Chinese massproducing electric vehicles for Westerners. (They shouldn't use them themselves, because that would imply mass destruction of planet earth - since Chinese electricity is basically coal and CO2).
So the Chinese should make the stuff. And anyone with a clean electricity source at hand, should drive it. Everyone else should refrain from it.
So the Chinese should make the stuff. And anyone with a clean electricity source at hand, should drive it. Everyone else should refrain from it.
-
lorenzo - Intermediate Crude
- Posts: 2184
- Joined: Sat 01 Jan 2005, 04:00:00
![]() by LadyRuby » Sun 19 Jun 2005, 11:21:50
by LadyRuby » Sun 19 Jun 2005, 11:21:50
I'm becoming convinced that hybrids, and particularly diesel (biodiesel) hybrids will be the best near-term solution. They can use the existing infrastructure and the technology is pretty much available now (hybrid diesel soon anyway). But I know less about the long-term availability of large quantities of biodiesel fuels (are there easily produced substitutes that don't take away greatly from food production)?
-

LadyRuby - Heavy Crude

- Posts: 1177
- Joined: Mon 13 Jun 2005, 03:00:00
- Location: Western US
![]() by lorenzo » Sun 19 Jun 2005, 11:40:40
by lorenzo » Sun 19 Jun 2005, 11:40:40
Hi LadyRuby, I share the same idea and the same questions.
But no doubt, your comment will trigger others to post their ideas about biofuels again, which has become a little problematic.
One of the moderators is creating a "sticky" thread about this topic, so let's wait a bit, and post our comments there. Else, we have to repeat ourselves over and over again.
So see you at the sticky thread!
-
lorenzo - Intermediate Crude
- Posts: 2184
- Joined: Sat 01 Jan 2005, 04:00:00
8 posts
• Page 1 of 1
Who is online
Users browsing this forum: No registered users and 23 guests