My thought is that the main difference between consumers in a producing nation versus consumers in a non-producing nation is that the money spent on oil in a producing nation stays in the nation, or most of it anyway. So an increasing price doesn't hurt consumers in the producing nations as much as it hurts in non-producing nations. I.e. the difference is in the elasticity of the demand curve.
So here are the equations I propose to model all this. I present them as a collection of multiple producers and multiple consumers.
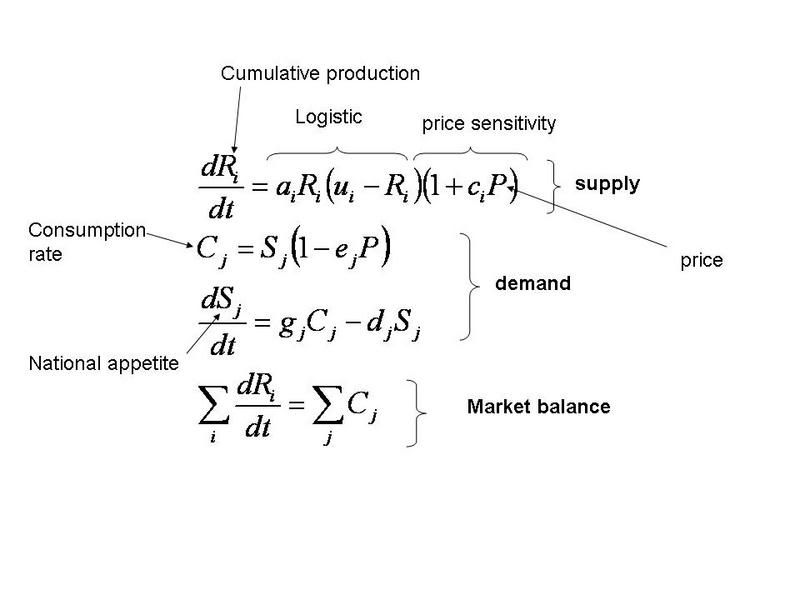
The producers are each governed by something like a logistic equation, but with a term added for price sensitivity. I need the price to change to make evident the different price sensitivities of the various consumers. The price will get set by the balancing of supply and demand in the marketplace.
I want to capture somehow the idea that countries grow or shrink. The amount consumed by a nation is not just a function of the price, but also of how "big" the country is. If a country consumes a lot, then the country can grow quickly. But if the country isn't able to consume enough, it will shrink.
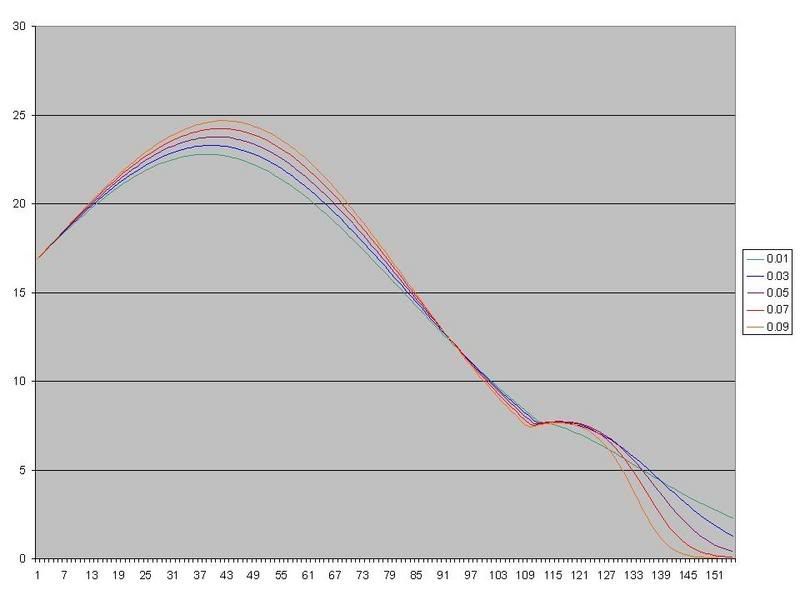
I wrote a little simulator in excel, for a system with just one producer and two consumers. The consumers have different elasticities, i.e. different sensitivities to the price. The lower sensitivity consumer is intended to be that of the producing nation.
One tricky bit that I don't know how to put in equations is - when the price gets high enough, my simple linear demand curve ends up in negative consumption territory, which is obviously nonsense. So my simulator just knocks consumers out of the market place, i.e. assigns 0 consumption, when the price gets that high.
So here is the evolution of the amounts consumed by the two consumers. I set the initial conditions so the producing nation starts out much smaller than the non-consuming nation. But the curves cross eventually
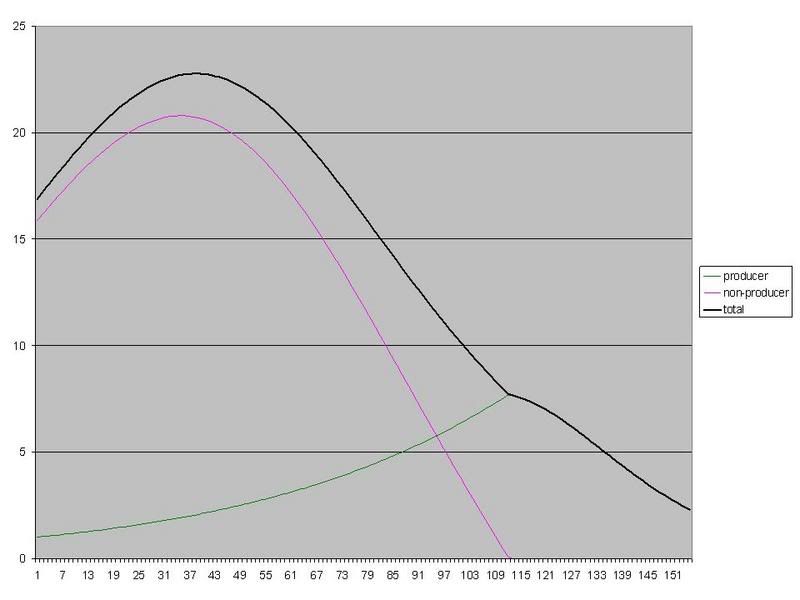
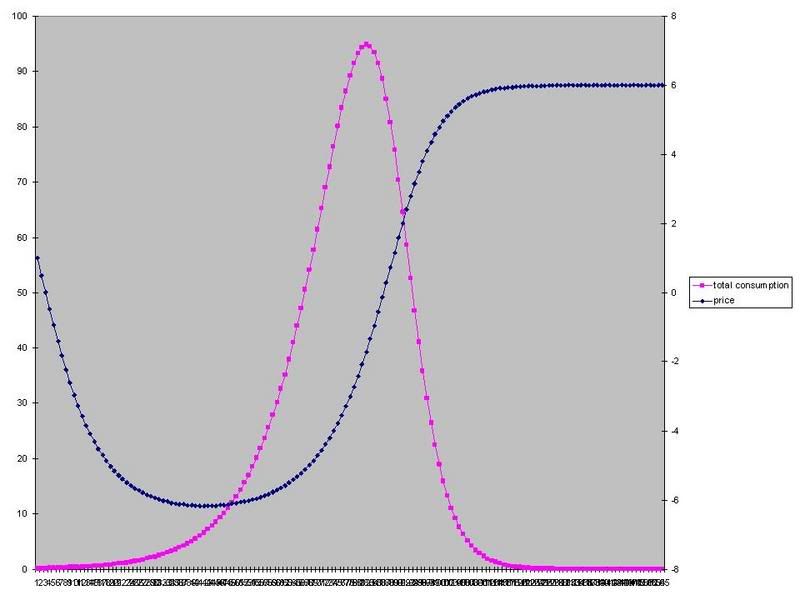
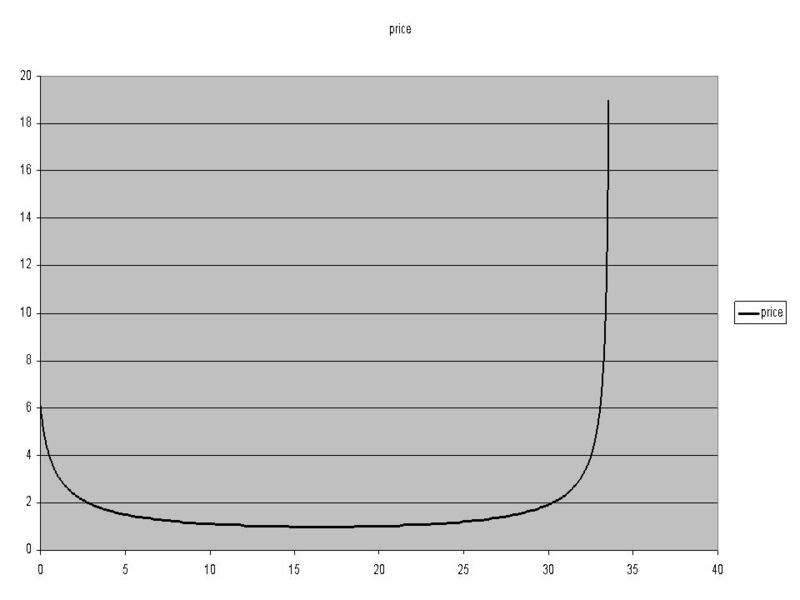
Here is the total consumption on the same graph as the price. The price goes up slowly, but then when the price sensitive consumer is knocked out, only the price insensitive consumer is left, and the price really takes off.

An interesting exercise!