Pops wrote:Outcast_Searcher wrote:Pops wrote:Just to review, the title was "change in real wage since 06" the plot showed wages, though still negative compared to 06, creeping back up, then a drop back.
anyway...
Thanks for the explanation. i understand what it shows. But what it shows is BOGUS re the solidly negative cumulative wages vs. 2006 part.
I'm not going to dig up another source, here is a different view including methodology.
Since 2006, wages have risen 12.9 percent overall in the US. But when you factor in inflation, "real wages" have actually fallen 9.3 percent. In other words, the income for a typical worker today buys them less than it did in 2006. The PayScale Real Wage Index incorporates the Consumer Price Index (CPI) into The PayScale Index (which tracks nominal wages) and looks at the buying power of wages for full-time private industry workers in the U.S.
https://www.payscale.com/payscale-index/
OK, so they're using their own methodology, which to me doesn't mean "real wages" like the standard sources mean real wages. If you torture data enough, it will "confess". Lies, damn likes, and statistics, etc.
That's probably why their numbers look so different than sources like the FRED you used, my Trading Economics source, etc.
We could also look at something like shadowstats and claim that inflation is absolutely monstrous over time in the US -- until we look at actual prices of things and see that the claim is ludicrous, overall.
...
I tried Googling "real wage growth us" and got some decent looking hits.
First one from the brooking institution:
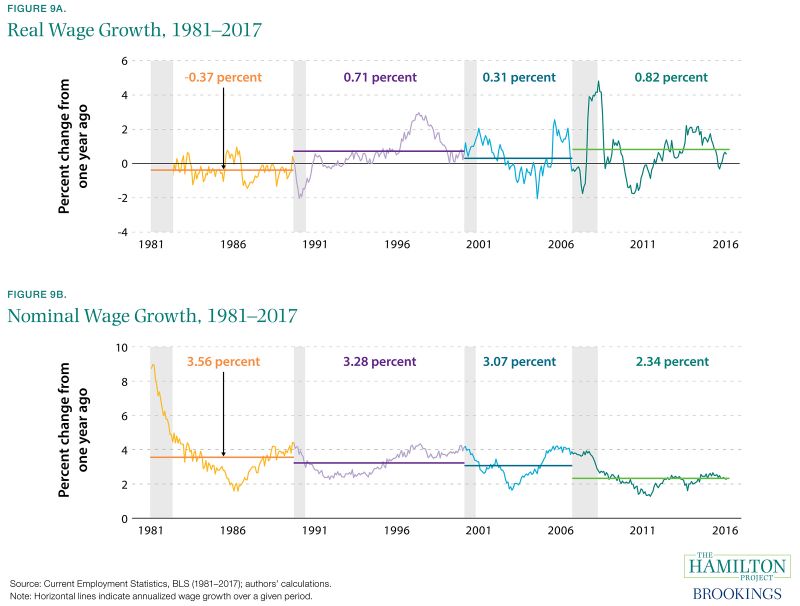
https://www.brookings.edu/research/thir ... ge-growth/Fact 9: Inflation-adjusted wage growth was higher from 2007 to 2017 than it was during previous business cycles.
By comparison with the previous three business cycles, inflation-adjusted wage growth since 2007 has been relatively strong. It is slightly ahead of the growth seen during the 1990s or 2000s business cycles and is notably higher than growth in the 1980s. Figure 9a plots year-over-year growth in real average hourly earnings for production and non-supervisory workers, showing trend growth separately for 1981–90 (-0.37 percent), 1990–2001 (0.71 percent), 2001–7 (0.31 percent), and 2007–17 (0.83 percent). It is important to note that this recent real wage growth followed years of stagnation and has been accompanied by rising inequality, likely making it feel insufficient to many workers.
The second source is my Trading Economics source. I like that source because they seem to consistently provide good data, and use comprehensible methodologies.
https://tradingeconomics.com/united-states/wage-growthThe third source is a BLS, only showing 2017 and 2018 data, which looks fairly flat overall. No help to assess growth from 2006 though.
The fourth source is FRED data. So looking at the first graph, quarterly, seasonally adjusted we see full time inflation adjusted (Real) earnings for wage and salary workers age 16 and up increase from an index of 332 in Q1 2006 to 351 in Q2 3018.
That's only a 5.7% real increase, but it's a real increase, not a big decrease over that period.
https://fred.stlouisfed.org/series/LES1252881600Q...
At least now I understand why people so commonly claim that wages have drastically dropped over time, etc. Sources matter a lot.
Given the track record of the perma-doomer blogs, I wouldn't bet a fast crash doomer's money on their predictions.