Peak Oil is You

Donate Bitcoins ;-) or Paypal :-)
Page added on October 28, 2017
Inflection Point: Oil’s Inevitable Rise
Summary
In this series of articles, we’re summarizing the global oil situation as of Q3 and looking ahead.
The continuing stock draws in crude and petroleum products are simply unsustainable and will lead to an oil price correction.
Inventory declines have accelerated, and will continue unabated given increase in demand and underproduction.
We recently provided a quarterly update for our fund’s Limited Partners, and wanted to share some of our conclusions and thoughts as we head towards year-end. In the next series of articles, we’ll provide excerpts of our findings and some additional insights.
(Here’s the links for all three parts: Part 1, Part 2 and Part 3)
Today’s Production Growth, or Lack Thereof
Restrained growth may actually come just as oil inventories are approaching a deficit. Recall that the market’s “lower for longer” oil thesis is predicated on US shale production growth. If this growth fails to materialize under the old “grow at any cost” strategies, what then? Will shale growth be exposed as the red herring we’ve always thought it was? Data in the past few months indicates that the “growth at any cost” strategy was already staggering under its own weight.
As we’ve long argued, shale production can’t single-handedly mitigate global decline rates. Energy Aspects, a research service based in London, succinctly sums it up by stating:
If demand does not slow, the world will need far more oil than the tight oil sector can offer at $50. Without additional productive capacity, the rapidly growing demand could trigger a supply crunch well before the theoretical peak in oil demand is reached. We are not saying for one moment that there is too little oil – there is plenty. Our point is there is not enough oil at $50.
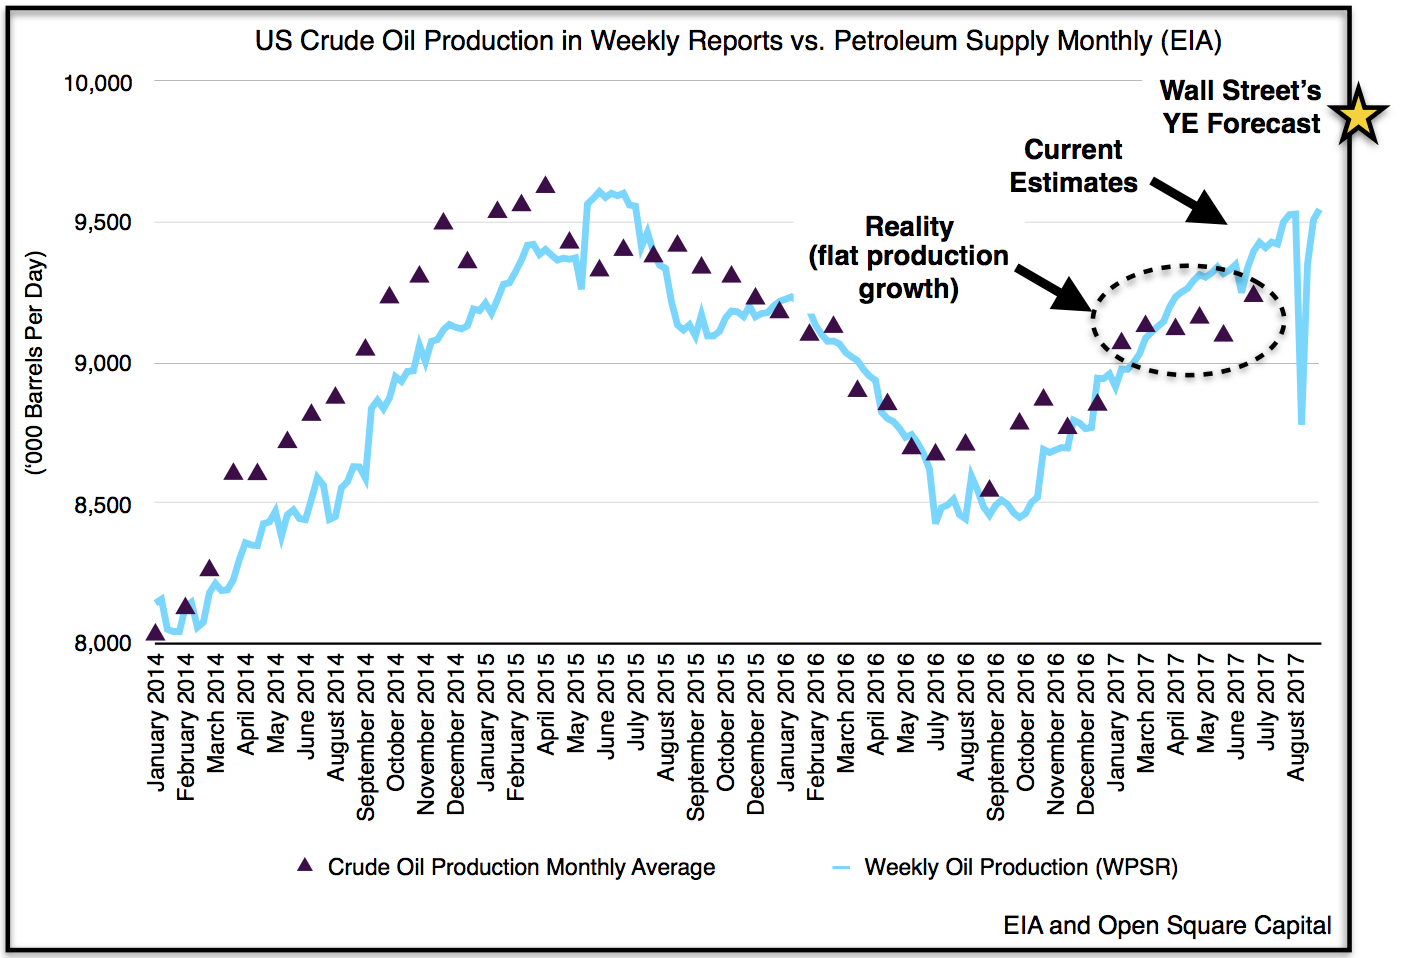
At $50/barrel, the world is relying upon growth in three shale patches in the US to shoulder the increasing global decline rates. What’s becoming clear is that these shale patches are hardly able to stem US production declines let alone the world’s. Just take a look at the US data below.
Despite Wall Street’s predictions, overall US production (40% of which includes shale) is coming in far less than predicted. The light blue line represents the EIA’s current estimates, and the dark triangles the more accurate monthly data that follows. We can already see actual production isn’t keeping pace with EIA’s estimates, let alone Wall Street’s. At current rates, we believe US crude production will only grow to be half of what Wall Street analysts had projected for 2017 (measured from YE 2016 to YE 2017).
Think about that for a second, Wall Street analysts have essentially overestimated U.S. production growth (i.e., supply in the supply/demand equation) by 100%. We’ve been the de facto Pollyanna for the past few years, contending that U.S. production growth will be wholly insufficient to stem the tide of decline rates. We’re now seeing that play out. Stagnating production alone would mean rebalancing becomes much more likely, but when coupled with demand growth, it’s almost assured at the stage.
Demand Growth
The dearth of capital has not only staggered production growth, but cheap prices have brought on a surge of demand. Global demand has simply been ratcheting higher.
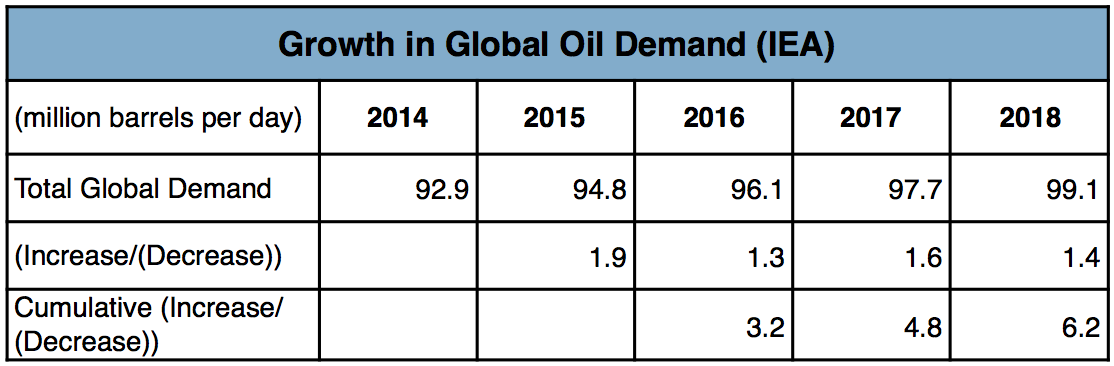
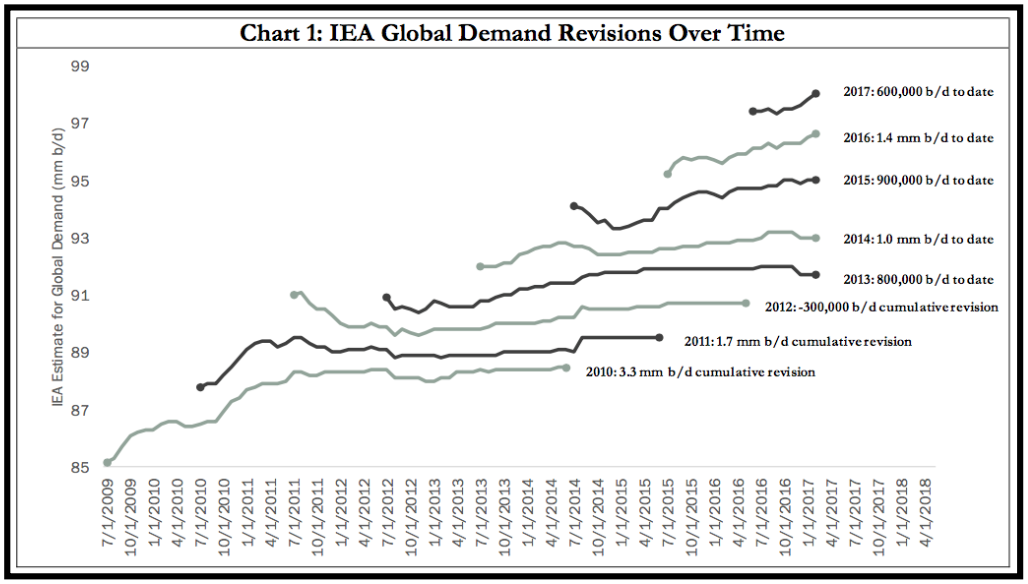
Since the oil price crash in late-2014, oil demand has cumulatively increased by almost 5M bpd, from 92.9M bpd to 97.7M bpd. If we include IEA’s preliminary estimate for 2018, that figure rises to 6.2M bpd. Said another way, the growth in global oil demand since prices collapsed has effectively absorbed the growth in oil production coming from shale. In fact, this growth in demand is likely even higher than indicated because the IEA has a history of first understating demand growth only to adjust it higher later (as illustrated by Goehring & Rozencwajg’s chart below).
This year is no different. In 2016, IEA projected that global oil demand would rise by 1.2M bpd in 2017. Since then, the EIA has revised its demand estimates higher, and today it stands at 1.6M bpd (i.e., 400K bpd or 33% more than anticipated).
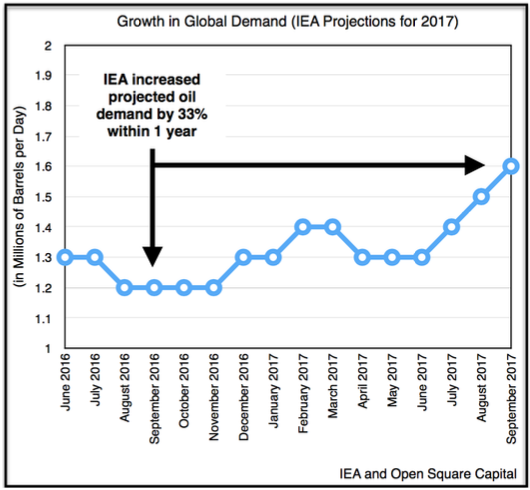
While this may not seem like a significant change, finding 400K bpd of extra production in a $50/barrel environment simply isn’t possible, which means much of this demand is being quenched by inventory draws.
You Can Fool the Market, but Inventories Don’t Lie
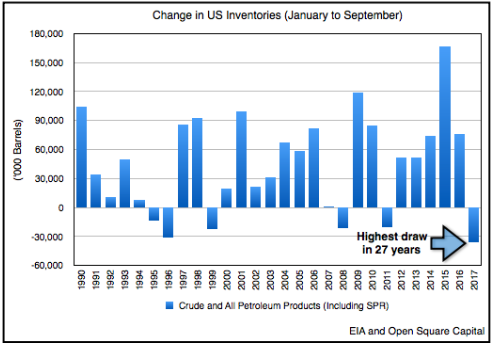
All of this, slowing production growth and higher demand, is impacting inventories. What started as small draws in February quickly gathered steam, and by Q3 the draws became historic. Below left depicts what global oil inventories (crude and refined petroleum products) looked like at the end of July (recall that global data lags by 2 months). The right chart shows U.S. inventories as of September.
 We can see that much of the oil surplus sits in the U.S., so let’s focus there. Since the beginning of the year, the U.S. has whittled down the surplus by close to 110M barrels despite having to contend with the global destocking that occurred in Q1. Although we realize looking at the 5-year average isn’t always precise especially since infrastructure additions means some of these increases in inventories are permanently filling tanks and pipelines, it’s what the market looks at so we’ll use it here.
What’s surprising is that the reductions have occurred during periods when oil inventories typically build, which is a testament to the undersupply and high demand. We discussed briefly the counter-seasonal draw in our Q2 letter, but with Q3 data now included, we can paint a much clearer picture. Below is a chart showing the unusual nature of today’s draws year to date.
To further appreciate how unusual these draws are it helps to exclude the one-time global destocking that impacted U.S. inventories in January and February. Cornerstone Analytics, a research firm led by Mike Rothman, noted that from February to September, overall petroleum stocks almost always increase. Almost always because in nearly three decades, U.S. inventories have only fallen two other times, one of which was during the Great Recession in 2008.
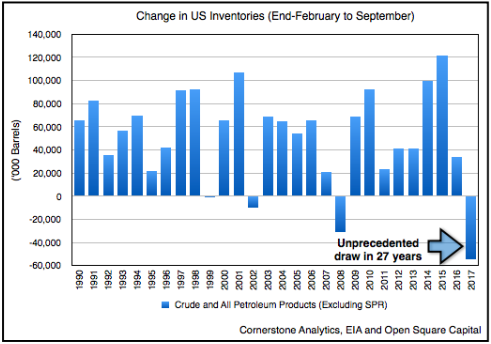
In contrast, we’ve drawn by an unprecedented 54M barrels of total oil inventories from Feb-to-Sept, when the average build in the past 26 years has been 55M barrels (a 110M barrel difference). Said another way, the drawdown in oil inventories has never been this strong in the past three decades.
Refining Our Crude Reality
Since total oil inventories include both crude oil and refined petroleum products (i.e., gasoline, diesel, etc.), it’s always helpful to look at them separately. We previously showed that the worldwide supply of oil was 188M barrels above the 5-year average, that’s again depicted in the left green/blue column below. In July, the U.S. surplus accounted for more than 76% of this, with crude oil the largest component.
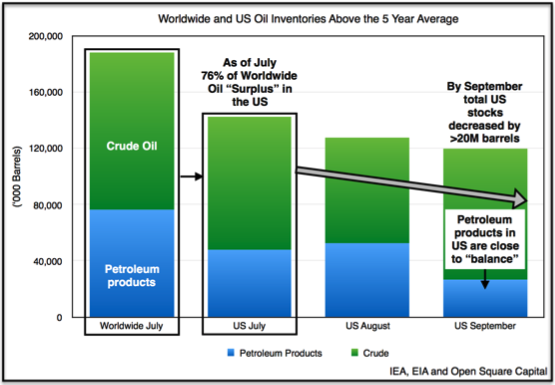
As we finished Q3, we can see that petroleum products have declined dramatically. This was due to both high demand and Hurricane Harvey. When refineries in Texas were idled because of the hurricane, oil products from storage declined as the remaining refineries failed to keep up.
By September, much of the U.S. surplus in petroleum products have been eliminated, and by year-end we believe product inventories will be in deficit. Why? Maintenance season. Contrary to popular belief, the fourth quarter is when demand peaks for petroleum products in the U.S. This is when stocks of refined products draw the most heavily as refineries slow down for maintenance. Case in point, the average 5-year draw during Q4 was 32M barrels (2012-16). If we’re currently running at higher demand and only ~28M barrels shy of balance, then it stands to reason that even in a “normal” year, we’ll likely be undersupplied by year-end.
In our next article, we’ll look at the final piece, crude oil, and tie it all together.
2 Comments on "Inflection Point: Oil’s Inevitable Rise"
print baby print on Sun, 29th Oct 2017 12:32 am
good article I like it
Wittmannn on Sun, 29th Oct 2017 2:06 pm
concurred…
underreported and unnoticed…
200k bpd production Crash for the month of September…
http://www.pemex.com/ri/Publicaciones/Indicadores%20Petroleros/eprohidro_esp.pdf
Mexico is going to the dogs…