Where would oil prices be without Venezuela’s collapse?
Where are oil prices headed next?
This idea was discussed in more depth with members of my private investing community, Value Portfolio.
The world is accelerating into an energy crisis, and in this article, I explore the country that has played a leading role: Venezuela.
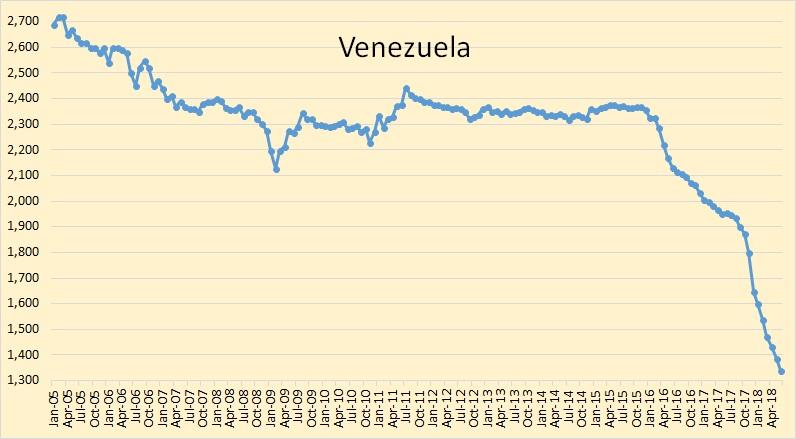
Venezuela Oil Production
The following graph illustrates that the oil production in the distressed country has rapidly declined since late 2015, and has fallen off the cliff two years later:
In the last nine months, Venezuela’s oil production has dropped from 1.9 mb/d to 1.3 mb/d, and initial reports indicate that it dipped even further in June:
Venezuela’s crude production dropped below 1.3 mb/d in June, its lowest monthly production level in 69 years except for a two-month oil strike in December 2002-January 2003 when output briefly dipped below 1 mb/d, according to two upstream executives assigned to state-owned PdV’s western and eastern divisions.
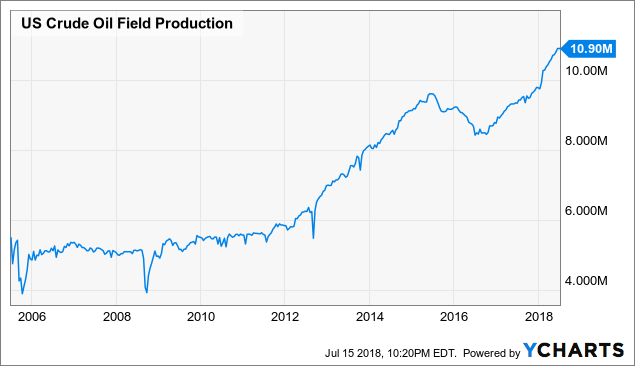
Since late 2015, the drop in Venezuela oil production has exceeded 1.0 mb/d, in part offsetting the surge in U.S. crude oil production in the same period:
The data shows that the precipitous drop in Venezuela’s oil production has played a key role in the oil price surge, which started around the same time in early 2016:
Brent Crude Oil Spot Price data by YCharts Venezuela Oil Rig Count data by YCharts US Crude Oil Field Production data by YCharts Brent Crude Oil Spot Price data by YCharts
Further, if Venezuela’s oil production had continued at the 2.3 mb/d level throughout the 30-month period from late 2015 to May 2018, with all else equal, then the closely watched OECD commercial oil inventories would be 350 million barrels to 400 million barrels higher than where they are today:
Interestingly, that is the exact difference between where OECD commercial oil inventories are today versus where they peaked in 2016. Cool stuff, huh?
What’s Next?
The following graph illustrates the continued decline in Venezuela’s oil rig count:
Readers should note that the oil rig count in Venezuela peaked in late 2014, and preceded the decline in oil production by several months, as is usually the case. Less drilling now naturally means less oil production shortly after, all else equal.
Given that the oil rig count remains near multi-decade lows, and has significantly dipped in recent months, I expect the country’s oil production to remain muted, and potentially decline even further in the coming months, which is in line with early reports from the field:
“More production wells are being shut down, the skilled oilfield labor force declined in all upstream divisions by at least a combined 1,000 workers in June, and scheduled maintenance continues to be postponed,” the western division official said. Earlier discussions with PdV officials suggest that the same trends are eroding production in the Orinoco heavy oil belt.
Venezuela’s crude output continued falling in the first 11 days of July as more drilling rigs and production wells are shut down, the eastern division executive said.
US Crude Oil Field Production data by YCharts Brent Crude Oil Spot Price data by YCharts Venezuela Oil Rig Count data by YCharts
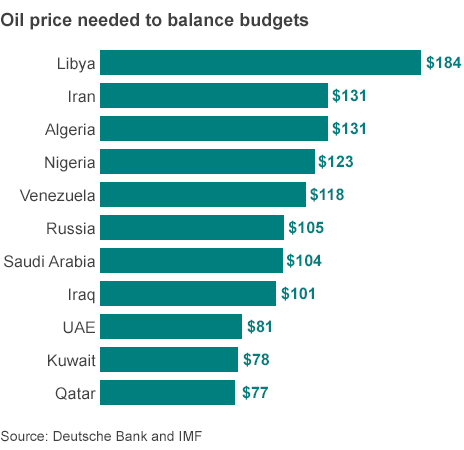
The above graph illustrates that many key oil producing countries need significantly higher oil prices in order to balance their budgets, and Venezuela is up there on that list with $118 per barrel.
If oil prices surge in the coming months, as I expect, then maybe Venezuela and a few other oil producing countries can be pull themselves off the cliff. Until then, however, we will likely to continue to see headlines like this one:
Hungry Venezuelan Workers Are Collapsing. So Is the Oil Industry
If the downward trend is sustained, Venezuela’s crude output could reach 1mn b/d before the end of 2018, the western and eastern division executives added.
Bottom Line
The primary culprit of surging oil prices is Venezuela. Without the persistent declines in its oil production, the oil market fundamentals would be entirely different today. The reality we are left with today, however, points to higher oil prices. It’s going to be a hot summer!
Follow For Free Articles
If you enjoyed this article, please click “Follow” next to my name. Your support will allow me to invest further time and resources into creating proprietary research for you.
Premium Research
If you’re interested in my investment methodology and other holdings, join Value Portfolio. I’m confident that you will find my fundamental research to be insightful, and I look forward to discussing ideas with you.
Disclosure:I/we have no positions in any stocks mentioned, and no plans to initiate any positions within the next 72 hours.
I wrote this article myself, and it expresses my own opinions. I am not receiving compensation for it (other than from Seeking Alpha). I have no business relationship with any company whose stock is mentioned in this article.
Looks like raising oil prices is one motivation for the disruption campaign against the Venezuelan government.
rockman on Tue, 17th Jul 2018 11:26 am
“The data shows that the precipitous drop in Venezuela’s oil production has played a key role in the oil price surge…” By their own number the decrease in Venezuelan oil production represent about a 1% decrease in global oil production. Not likely to have caused a “surge” in oil prices IMHO. Especially taking into account production increases by other countries.
eugene on Tue, 17th Jul 2018 12:30 pm
Lets calculate an oil price to balance the US budget.
Outcast_Searcher on Tue, 17th Jul 2018 5:45 pm
Nonsense. Oil is a fungible commodity. There is nothing special about Venezuela oil vs. any other major producer’s oil. Changes in the news cause other producer’s oil output to change a lot and the global oil markets adapt in response.
OPEC, Russia, the US, Iran, the KSA, etc. have been very much in the news in recent months for varying reasons. And those countries dwarf Venezuela re oil production.
I’ll concede the point that if things never changed, they wouldn’t end up different. OK. Now how is that useful since in the real world things DO change quite often, and often unexpectedly / unpredictably.
Davy on Wed, 18th Jul 2018 6:04 am
Wow, I bet someone in China is pissed. I think the Venezuelan investment number is around $60BIL. When you look at the possibility of pennies on the dollar for all that debt WOW how about that price of Venezuelan oil!
BobInget on Wed, 18th Jul 2018 9:28 am
China and Russia play long game, Davy.
Latest excuse for diminished exports;
Two ‘upgraders’ need repair after long delays.
Speaking of imports, I’ll post Wednesday’s EIA repore rat cheer in 5 minutes.
BobInget on Wed, 18th Jul 2018 9:34 am
Summary of Weekly Petroleum Data for the week ending July 13, 2018
U.S. crude oil refinery inputs averaged 17.2 million barrels per day during the week
ending July 13, 2018, which was 413,000 barrels per day less than the previous week’s
average. Refineries operated at 94.3% of their operable capacity last week. Gasoline
production decreased last week, averaging 10.3 million barrels per day. Distillate fuel
production decreased last week, averaging 5.2 million barrels per day.
U.S. crude oil imports averaged 9.1 million barrels per day last week, up by 1,635,000
barrels per day from the previous week. Over the past four weeks, crude oil imports
averaged about 8.5 million barrels per day, 8.1% more than the same four-week period
last year.
Total motor gasoline imports (including both finished gasoline and gasoline
blending components) last week averaged 657,000 barrels per day, and distillate fuel
imports averaged 140,000 barrels per day.
U.S. commercial crude oil inventories (excluding those in the Strategic Petroleum
Reserve) increased by 5.8 million barrels from the previous week. At 411.1 million
barrels, U.S. crude oil inventories are about 2% below the five year average for this time
of year. Total motor gasoline inventories decreased by 3.2 million barrels last week and
are about 5% above the five year average for this time of year. Finished gasoline and
blending components inventories both decreased last week. Distillate fuel inventories
decreased by 0.4 million barrels last week and are about 13% below the five year average
for this time of year. Propane/propylene inventories increased by 1.7 million barrels last
week and are about 10% below the five year average for this time of year. Total
commercial petroleum inventories increased by 6.0 million barrels last week.
Total products supplied over the last four-week period averaged 20.7 million barrels per
day, down by 0.3% from the same period last year. Over the past four weeks, motor
gasoline product supplied averaged 9.6 million barrels per day, down by 0.1% from the
same period last year. Distillate fuel product supplied averaged 3.9 million barrels per
day over the past four weeks, down by 5.2% from the same period last year. Jet fuel
product supplied was up 0.8% compared with the same four-week period last year.
BobInget on Wed, 18th Jul 2018 9:42 am
In case you care that repore is far more ‘bearish’ than expected.
#1 imports 2 million B’s higher than normal.
#2Gasoline imports higher.
#3 Slight consumption slowness.
ONLY jet fuel showed increase over last year.
IMO, EV’s are having a some impact as miles drive have gone up.
Massive imports will cover, for now, shortages.
rockman on Wed, 18th Jul 2018 10:55 am
There is no shortage of gasoline in the US. In fact, just the opposite according to the EIA. From
“The world’s largest oil consumer exported more hydrocarbons than ever before in 2017 and shows no signs of slowing down. You name it — crude oil, GASOLINE, diesel, propane and even liquefied natural gas — all were shipped abroad at a record pace. While the surge comes many years after the shale boom started, it can be traced straight back to the growth of horizontal drilling and fracking.”
“The growth of U.S. gasoline and diesel exports was more subtle this year, mostly filling the gaps left as refiners in Latin America weren’t up to the task of meeting the region’s growing thirst for fuel. Refiners in the middle of the U.S. were pumping out fuel at a record pace, leaving a surplus of refined products along the Gulf Coast ready to be shipped to eager Latin American buyers, according to Mason Hamilton, an analyst with the U.S. Energy Information Administration. “The Midwest is running at bonkers levels,” Hamilton said by phone from Washington. Weekly preliminary government data show total gasoline exports hit a record 1.21 million barrels a day in November.”

 US Crude Oil Field Production data by YCharts
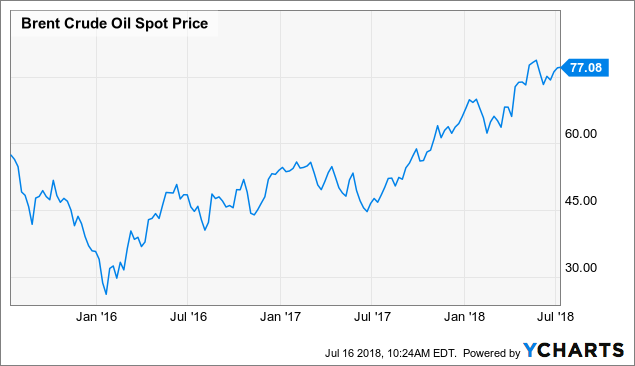 Brent Crude Oil Spot Price data by YCharts
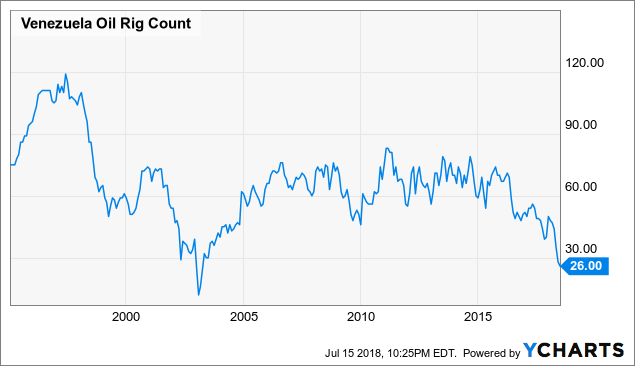 Venezuela Oil Rig Count data by YCharts
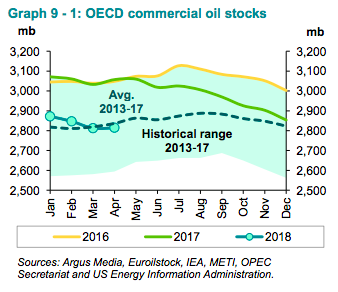
kanon on Tue, 17th Jul 2018 10:37 am
Looks like raising oil prices is one motivation for the disruption campaign against the Venezuelan government.
rockman on Tue, 17th Jul 2018 11:26 am
“The data shows that the precipitous drop in Venezuela’s oil production has played a key role in the oil price surge…” By their own number the decrease in Venezuelan oil production represent about a 1% decrease in global oil production. Not likely to have caused a “surge” in oil prices IMHO. Especially taking into account production increases by other countries.
eugene on Tue, 17th Jul 2018 12:30 pm
Lets calculate an oil price to balance the US budget.
Outcast_Searcher on Tue, 17th Jul 2018 5:45 pm
Nonsense. Oil is a fungible commodity. There is nothing special about Venezuela oil vs. any other major producer’s oil. Changes in the news cause other producer’s oil output to change a lot and the global oil markets adapt in response.
OPEC, Russia, the US, Iran, the KSA, etc. have been very much in the news in recent months for varying reasons. And those countries dwarf Venezuela re oil production.
I’ll concede the point that if things never changed, they wouldn’t end up different. OK. Now how is that useful since in the real world things DO change quite often, and often unexpectedly / unpredictably.
Davy on Wed, 18th Jul 2018 6:04 am
Wow, I bet someone in China is pissed. I think the Venezuelan investment number is around $60BIL. When you look at the possibility of pennies on the dollar for all that debt WOW how about that price of Venezuelan oil!
BobInget on Wed, 18th Jul 2018 9:28 am
China and Russia play long game, Davy.
Latest excuse for diminished exports;
Two ‘upgraders’ need repair after long delays.
Speaking of imports, I’ll post Wednesday’s EIA repore rat cheer in 5 minutes.
BobInget on Wed, 18th Jul 2018 9:34 am
Summary of Weekly Petroleum Data for the week ending July 13, 2018
U.S. crude oil refinery inputs averaged 17.2 million barrels per day during the week
ending July 13, 2018, which was 413,000 barrels per day less than the previous week’s
average. Refineries operated at 94.3% of their operable capacity last week. Gasoline
production decreased last week, averaging 10.3 million barrels per day. Distillate fuel
production decreased last week, averaging 5.2 million barrels per day.
U.S. crude oil imports averaged 9.1 million barrels per day last week, up by 1,635,000
barrels per day from the previous week. Over the past four weeks, crude oil imports
averaged about 8.5 million barrels per day, 8.1% more than the same four-week period
last year.
Total motor gasoline imports (including both finished gasoline and gasoline
blending components) last week averaged 657,000 barrels per day, and distillate fuel
imports averaged 140,000 barrels per day.
U.S. commercial crude oil inventories (excluding those in the Strategic Petroleum
Reserve) increased by 5.8 million barrels from the previous week. At 411.1 million
barrels, U.S. crude oil inventories are about 2% below the five year average for this time
of year. Total motor gasoline inventories decreased by 3.2 million barrels last week and
are about 5% above the five year average for this time of year. Finished gasoline and
blending components inventories both decreased last week. Distillate fuel inventories
decreased by 0.4 million barrels last week and are about 13% below the five year average
for this time of year. Propane/propylene inventories increased by 1.7 million barrels last
week and are about 10% below the five year average for this time of year. Total
commercial petroleum inventories increased by 6.0 million barrels last week.
Total products supplied over the last four-week period averaged 20.7 million barrels per
day, down by 0.3% from the same period last year. Over the past four weeks, motor
gasoline product supplied averaged 9.6 million barrels per day, down by 0.1% from the
same period last year. Distillate fuel product supplied averaged 3.9 million barrels per
day over the past four weeks, down by 5.2% from the same period last year. Jet fuel
product supplied was up 0.8% compared with the same four-week period last year.
BobInget on Wed, 18th Jul 2018 9:42 am
In case you care that repore is far more ‘bearish’ than expected.
#1 imports 2 million B’s higher than normal.
#2Gasoline imports higher.
#3 Slight consumption slowness.
ONLY jet fuel showed increase over last year.
IMO, EV’s are having a some impact as miles drive have gone up.
Massive imports will cover, for now, shortages.
rockman on Wed, 18th Jul 2018 10:55 am
There is no shortage of gasoline in the US. In fact, just the opposite according to the EIA. From
https://www.bloomberg.com/news/articles/2017-12-12/u-s-fuels-the-world-as-shale-boom-powers-record-oil-exports
“The world’s largest oil consumer exported more hydrocarbons than ever before in 2017 and shows no signs of slowing down. You name it — crude oil, GASOLINE, diesel, propane and even liquefied natural gas — all were shipped abroad at a record pace. While the surge comes many years after the shale boom started, it can be traced straight back to the growth of horizontal drilling and fracking.”
“The growth of U.S. gasoline and diesel exports was more subtle this year, mostly filling the gaps left as refiners in Latin America weren’t up to the task of meeting the region’s growing thirst for fuel. Refiners in the middle of the U.S. were pumping out fuel at a record pace, leaving a surplus of refined products along the Gulf Coast ready to be shipped to eager Latin American buyers, according to Mason Hamilton, an analyst with the U.S. Energy Information Administration. “The Midwest is running at bonkers levels,” Hamilton said by phone from Washington. Weekly preliminary government data show total gasoline exports hit a record 1.21 million barrels a day in November.”