Peak Oil is You

Donate Bitcoins ;-) or Paypal :-)
Page added on May 25, 2015
OPEC according to the EIA

OPEC publishes monthly production data for all OPEC nations in their Monthly Oil Market Report. The data crude oil production only and does not include condensate. I have found the data to be highly accurate and any errors are corrected in the next month’s report or the month following that. The OPEC data is from OPEC’s “Secondary Sources”.
The EIA also publishes OPEC production data in their International Energy Statistics. However the EIA does not publish crude only data. Their data includes condensate.
All data is in thousand barrels per day. The last EIA data point is December 2014 and the last OPEC data point is April 2015.
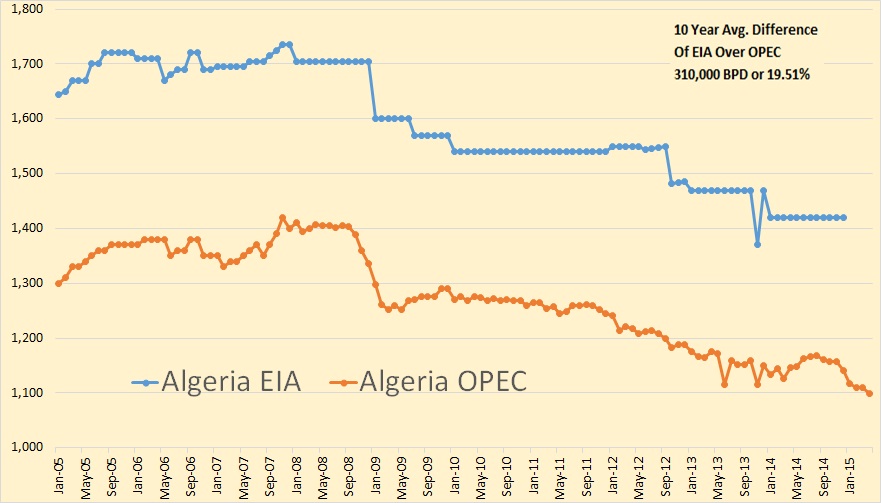
Almost 20% of Algeria’s production is condensate if the EIA is correct. Algeria does produce a lot of condensate but I have serious doubts about the accuracy of the EIA data. As you can see from the chart the EIA has Algeria’s production absolutely flat for 24 months, from January 2010 through December 2011. But both the EIA and OPEC agree on one point, Angola is in decline.
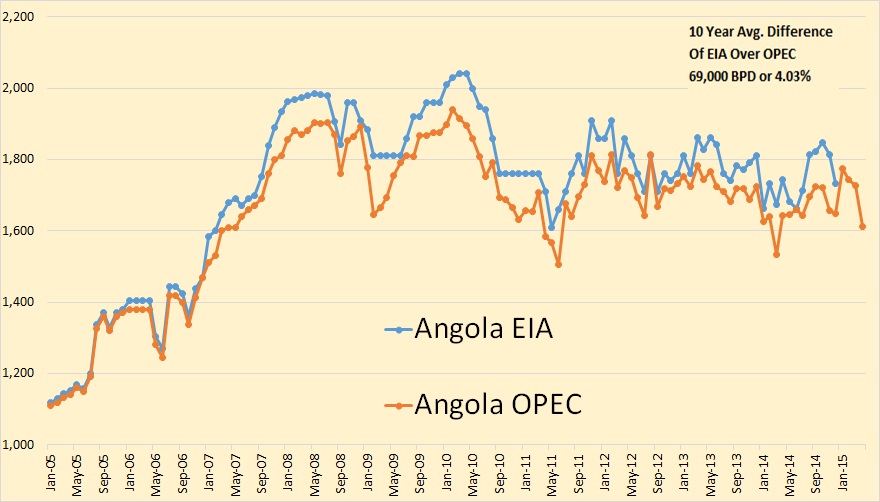
Angola is one place the EIA and OPEC pretty much agree. Angola has declined by about 300,000 bpd since peaking in 2010.
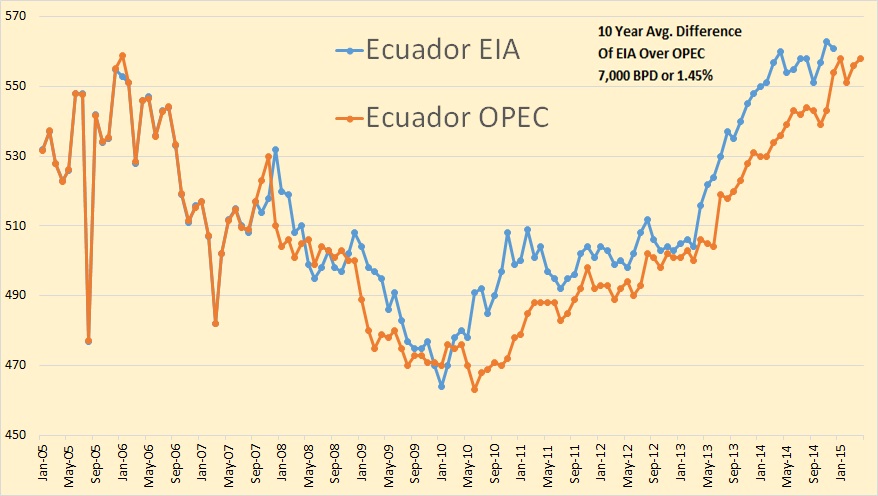
Ecuador has increased production by about 50,000 bpd in the last two years but may be peaking.
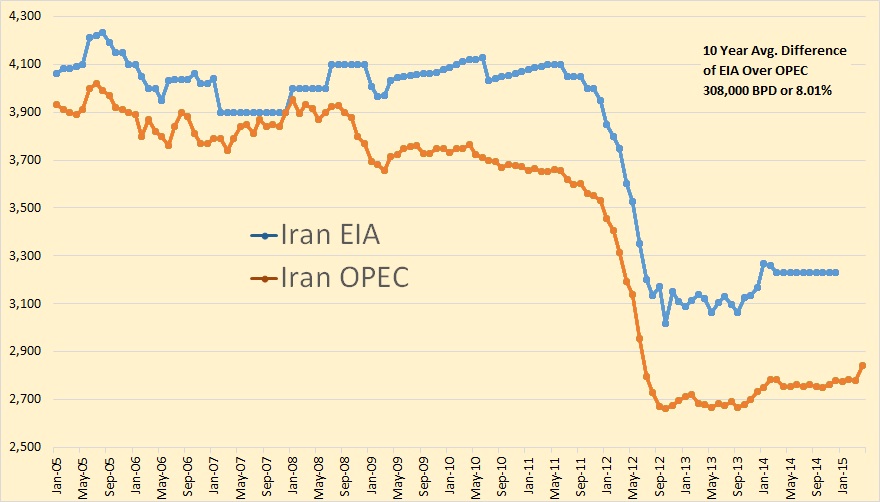
Iran may be slowly increasing production in spite of sanctions. At any rate their production of condensate seems to have increased in the last 8 years or so.
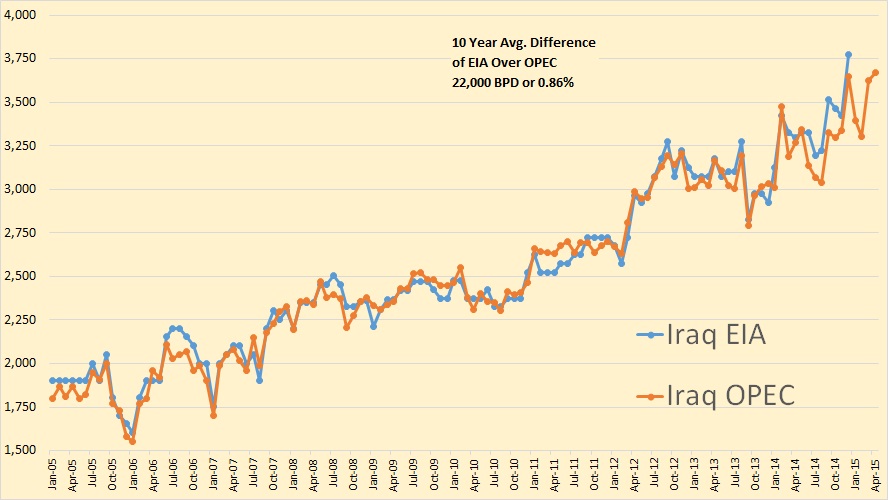
Iraq is another place where the EIA and OPEC track each other very close. Apparently they produce very little condensate.
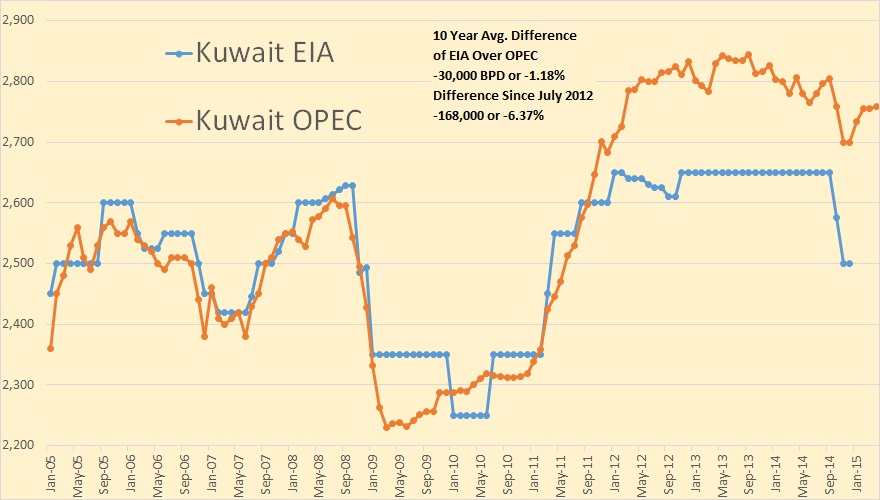
On Kuwaiti production the EIA and OPEC were tracking each other pretty close until early 2012 when a strange gap opened up between them. And the EIA had their production absolutely flat for 23 months up to September 2012.
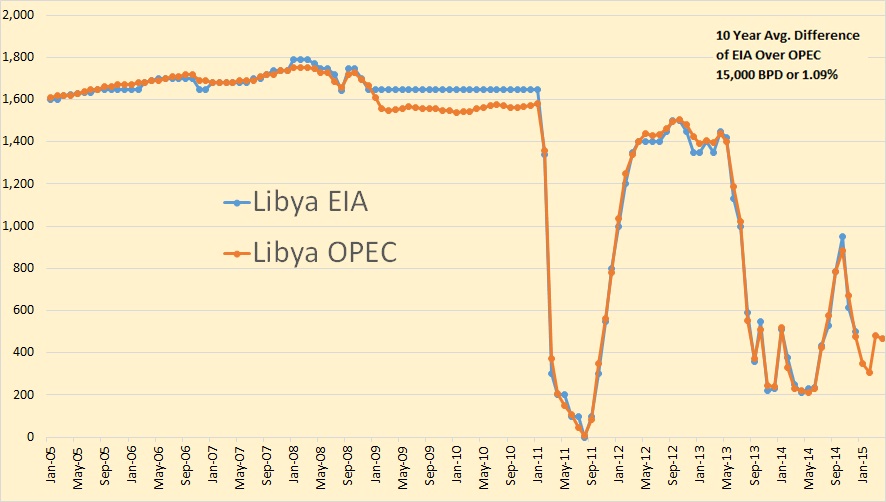
Since February 2011 The EIA an OPEC have been tracking each other almost exact on Libyan prouction. Apparently they produce almost no condensate at all.
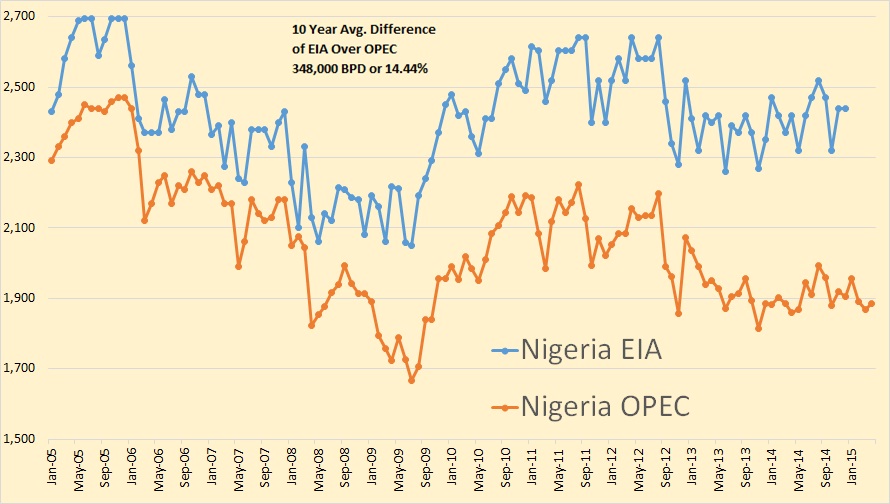 It looks like the EIA has been getting pretty good data out of Nigeria. However the difference between the EIA and OPEC, for the last two years, has been over 20%. Do they produce that much condensate?
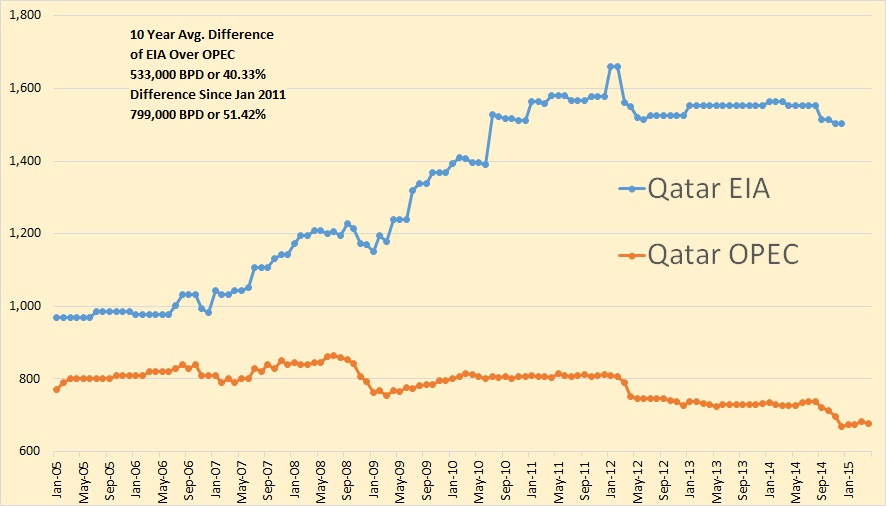
Qatar is really a strange animal. For the last 4 years the EIA has them at about twice what OPEC has them. Qatar’s main production is natural gas so they do produce a lot of condensate. But as far as crude oil goes OPEC says Qatar is in decline. But as far as C+C goes the EIA says they are growing by leaps and bounds, or were up until early 2011 anyway.
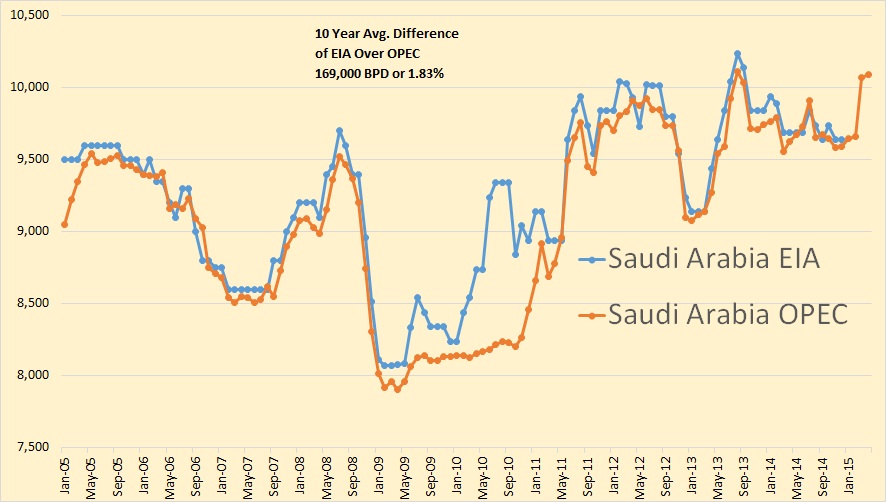
The EIA and OPEC pretty well agree about Saudi Arabia, except for a year or so around 2010. And Saudi apparently produces very little condensate.
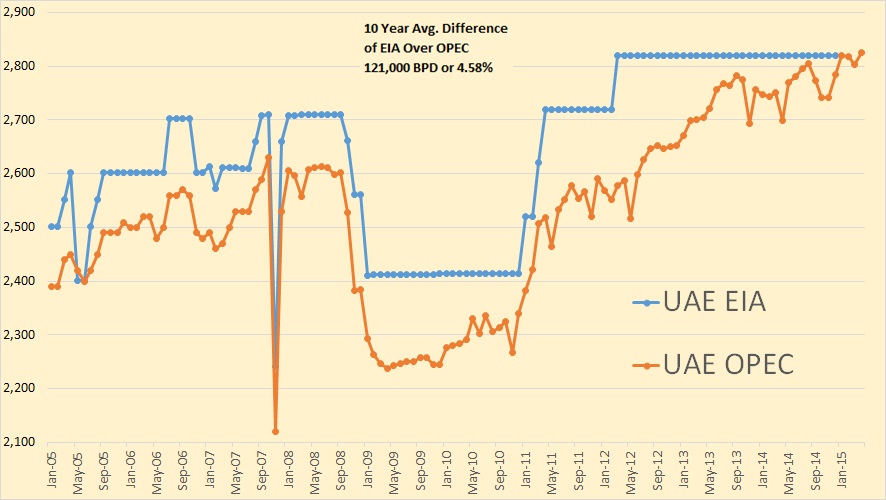
And with the United Arab Emirates the EIA completely goes off the track. They have no change in UAE production since March 2012. That is totally unrealistic. And just as unrealistic is what they have UAE production for all the previous years also. It looks like they have not a clue as to what the UAE is producing so they just keep the data the same until they think they have a better guess.
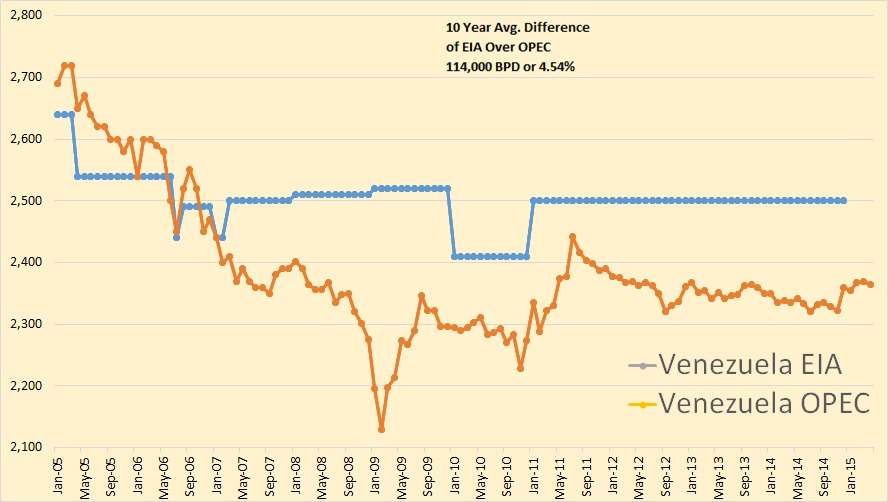
But the EIA’s estimate of Venezuela’s production is just beyond the pale. The EIA says they haven’t had a production change since January of 2011. How can the folks at the EIA post this stuff with a straight face?
At least the total OPEC chart looks realistic. The EIA has condensate averaging 6.10% for the last 10 years but condensate production has been increasing and averages about 7.2 percent for the last two years. That is if we assume the difference between the EIA and OPEC data is all condensate. But I really don’t think that is a safe assumption.
Leave a Reply