Below are a number of oil (C + C ) production charts for Non-OPEC countries created from data provided by the EIA’s International Energy Statistics and updated to October 2019. Information from other sources such as the IEA and OPEC is used to provide a short term outlook for future output and direction.
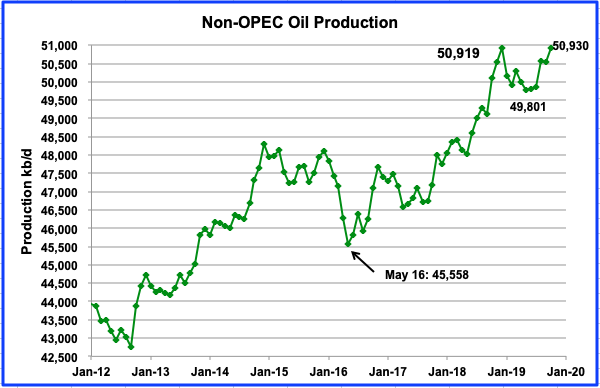
Non-OPEC production increased by 382 kb/d to 50,930 kb/d in October from 50,512 kb/d in September. This is second highest monthly increase for 2019 after the August increase of 699 kb/d.
October’s production exceeded the previous high of 50,919 kb/d reached in December 2018 by 11 kb/d. Gains from Norway, U.S, and Canada overcame declines from other countries to post the new October record.
Contrast what has happened with output in 2019 with 2018. From December 2017 to December 2018, production increased from 47,768 kb/d to 50,919 kb/d, an increase of 3,151 kb/d. Of this, the three largest contributors were U.S., Russia, and Canada. From December 2018 to October 2019, production so far has increased by 11 kb/d. How much will the next two months add?
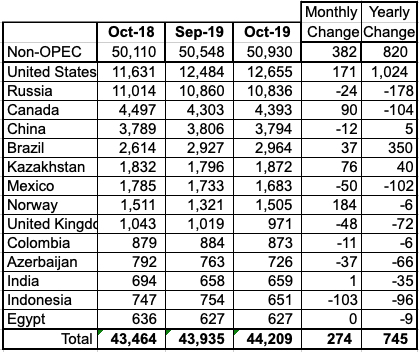
Above are listed the world’s 14th largest Non-OPEC producers. They produced 86.8% of the Non-OPEC output in October. What stands out in this table are the triple digit monthly increases from the US and Norway and the yearly increase from the US of 1,024 kb/d. Last year, world demand in Q4-19 increased by 1,450 kb/d over Q4-18, according to OPEC. US output growth covered 70% of that demand increase. There are indications that the US may not be able to sustain this level of annual production growth going forward. For Q4-20 over Q4-19, OPEC is projecting a demand increase of more than 1,500 k/d.
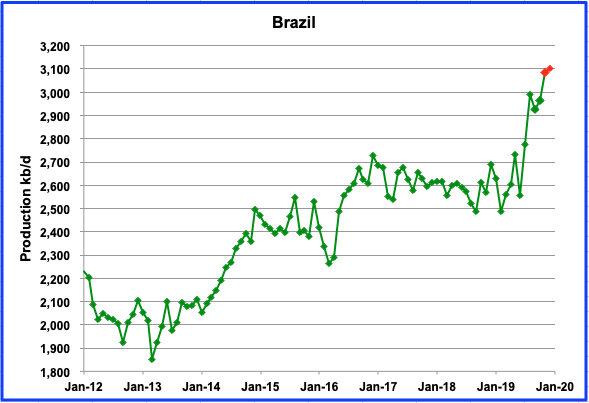
Brazil had a small output increment of 37 kb/d in October to 2,964 kb/d. This was an unexpected small increase from its deep pre-salt layer. However, larger increases are projected for November and December. The two red dots show what is expected for November and December. “In December, average production was also a record, totaling 3.1 million barrels of oil per day” as reported here.
Some earlier reports on Brazil speculated that the deep pre-salt layer could add an additional 1 Mb/d to current production. However the latest licensing round did not attract many bids and in some reports is viewed as a failure. The lack of interest will slow the increase in production and may be limited to its current level. This report, “Is this peak oil for Brazil?” notes the problem with increasing production is associated with cost.
“Recent research by consultants Rystad Energy says that many of the off shore oil projects sanctioned before 2014 generated little or no profit for investors because of higher than anticipated engineering costs.”
On February 1, Brazil’s oil workers went on strike. However Petrobras said that crude and fuel production remains stable thanks to emergency hires on their platforms.
According to the EIA, Canada increased its production by 90 kb/d in October to 4,393 kb/d. However this is a much smaller increase than the 147 kb/d reported by the Canada Energy Regulator (CER). Output from Alberta continues to be limited by the curtailment rules imposed by the government. In October, rail shipments of crude to the US dropped to 270,070 b/d from 319,594 b/d in August while in November rail shipments increased to 297,476 b/d, according the CER.
With increasing rail shipments and the Keystone pipeline returning to normal operations, inventories in Western Canada have started to fall and the WCS to WTI discount has shrunk from $25/bbl in December/January to closer to $17/bbl in early February.
While shipments from Alberta are still under constraints, Alberta received two pieces of good news in early February.
As reported here, the Federal Court of Appeal ruled Tuesday that the federal government sufficiently consulted with indigenous communities before approving the Trans Mountain expansion (TMX) pipeline for a second time last year.
The decision clears an obstacle for the project, which Justin Trudeau’s government purchased in a $4.5-billion deal in 2018, and is already under construction. Once built, the pipeline will transport diluted bitumen, a heavy crude produced in Alberta’s oil sands, to tidewater.”
In Minnesota, the PUC regulators voted to approve the replacement of Enbridge’s aging Line 3 pipeline with a new route and new pipes.
Approval of these two projects will add more than one million barrels per day of export capacity possibly by late 2021 for line 3 and 2022 for TMX. This will result in a slow increase in oil production in western Canada after 2022.
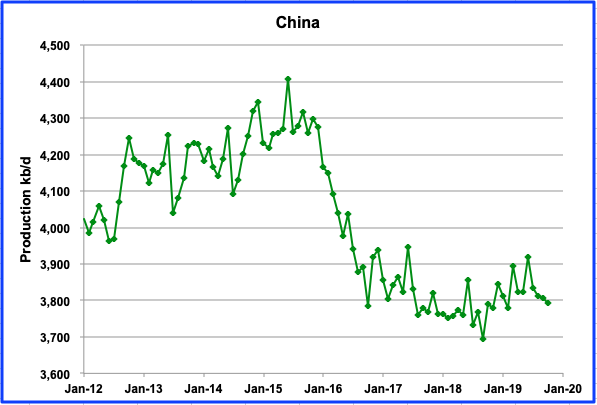
China’s production continues its slow decline which started in July 2019. Since July it has declined by 41 kb/d to 3,794 kb/d. It is expected to maintain this level of production into 2020 and no significant growth is expected. China’s oil companies are increasing spending and drilling to maintain output at its current level.
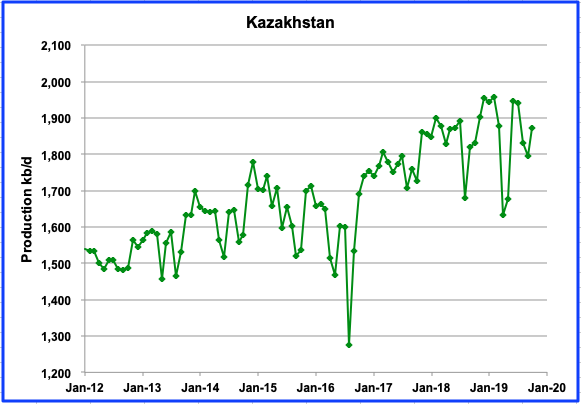
Kazakhstan output increased by 76 kb/d in October to 1,872 kb/d after completing field maintenance. It is expected that their production will rebound to between 1,900 kb/d and 2,000 kb/d in 2020 due to increasing production from the Kashagan field.
“In emailed comments, a spokeswoman for the Italian company said Kashagan crude production had reached 400,260 b/d on September 4. The increase was achieved through the conversion of an additional well to injection operations to support output, following a major maintenance shutdown earlier in the year,” according to S&P Global Platts.
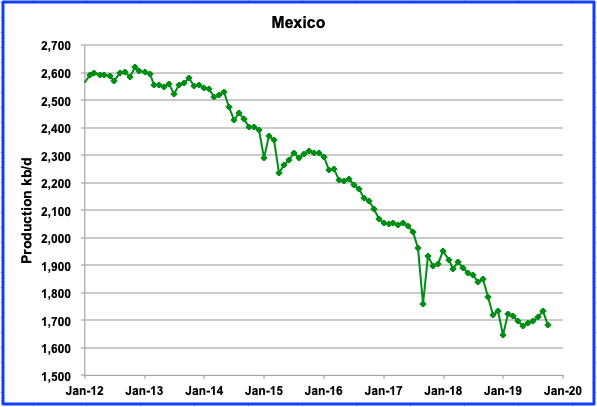
Mexico increased output for four months after July 2019 to 1,733 kb/d. However in October output declined by 50 kb/d. More recent data from Pemex indicates that output will recover in November and December.
According to Reuters, “Mexican national oil company Pemex’s crude output dipped to 1.76 million barrels per day (bpd) in October, down more than 7 percent compared with the same month last year, according to company data released on Monday. Pemex officials have said that the extended output slide is due to the natural decline of its major fields as well as budget cuts in recent years that have crimped its exploration and production activities.”
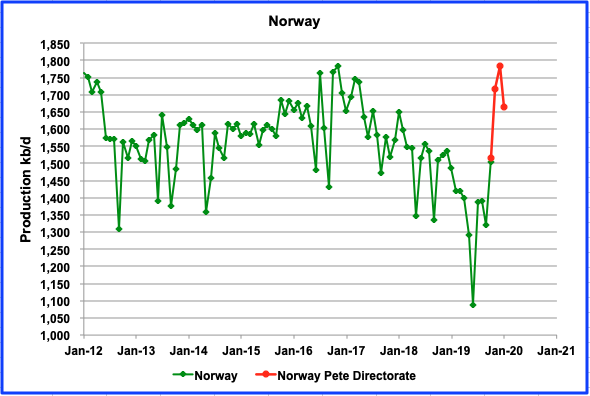
Norway’s oil output for October increased by 184 kb/d to 1,505 kb/d and reflects the addition of the first new oil from the Johan Sverdrup field. In December the JS field was producing at a rate of 350 kb/d according to Reuters. While smaller increments can be expected in 2020, according to OPEC, it is not clear from the latest data from the Norwegian Petroleum Directorate (NPD) that it will happen.
Oil (C + C) production data for Norway is published monthly by the NPD and is shown in red. In February it reported preliminary output of 1,784 kb/d for December and then an unexpected drop of 121 kb/d to 1,663 kb/d in January. No explanation was provided.
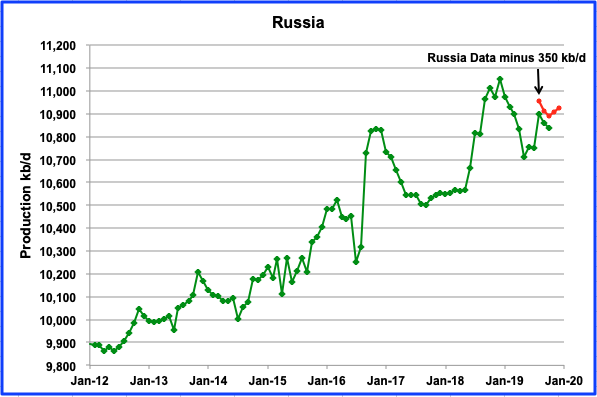
Russian production decreased by 24 kb/d from September to October to 10,836 kb/d according to the EIA. Also shown in red is a modified version of the oil output as reported by the Russian Ministry of Energy. It is higher than the EIA data because it includes condensate from NGPLs. The Russian data has been reduced by 350 kb/d to show how it parallels the EIA data.
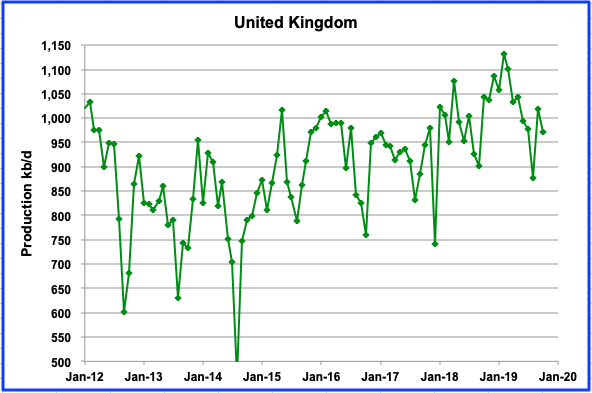
The UK output shows a drop in production of 48 kb/d to 971kb/d in October.
According to the IEA, “UK production was disrupted by a number of unplanned outages in October and at 1 mb/d was 120 kb/d below year ago levels. The largest producing field, Buzzard, was offline for most of the month while operator CNOOC made repairs to pipework.”
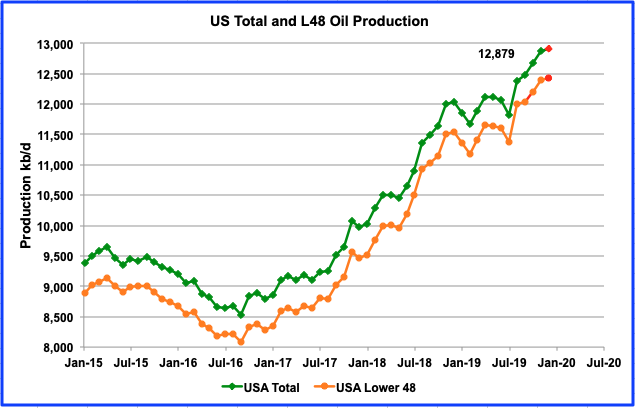
The latest data from the January EIA report shows that US production surged by 203 kb/d in November to reach a new high of 12,879 kb/d. Since June the US has increased output by an average of 164 kb/d/mth. Looking forward to December production, the February Short Term Energy Outlook (STEO) estimates US production for December to be 12,906 kb/d, an increase of 27 kb/d from November and is shown in red as the last data point.
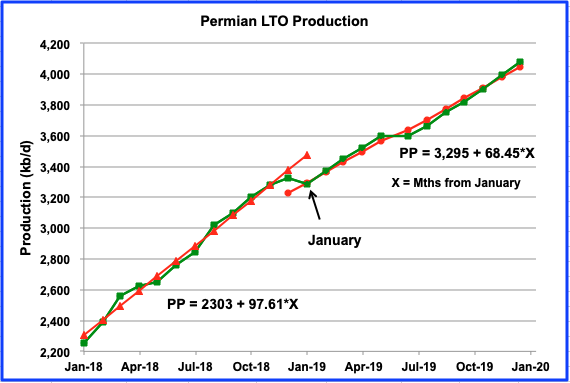
The major contributor to increasing US production has been the Permian basin. However there are indications of slowing. In 2018, Permian production grew at an average rate of 97.61 kb/d/mth. In 2019 the average rate has slowed to 68.45 kb/d/mth. Over the last three months from October to December, output growth averaged 88 kb/d/mth according to the EIA LTO report.
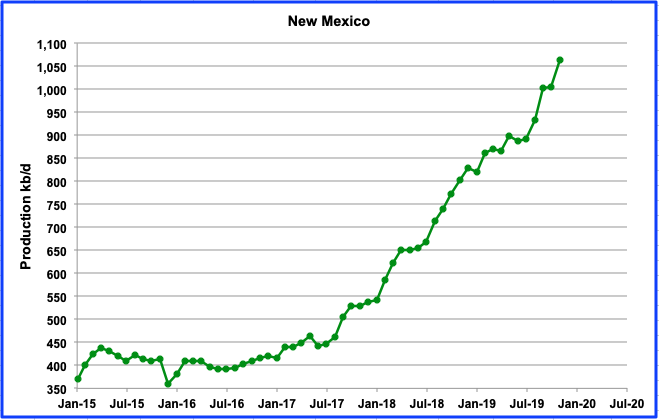
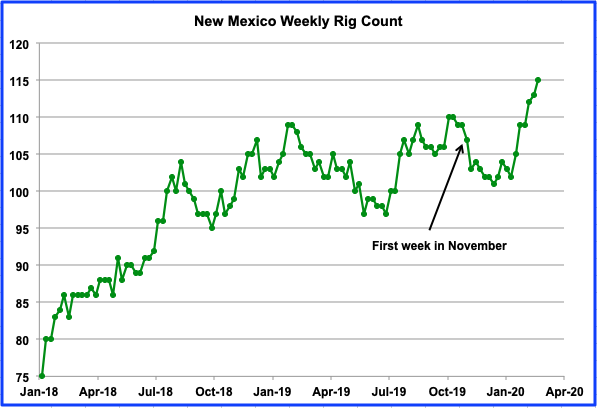
While Texas has been getting much attention regarding its production growth, New Mexico has also increased its output and recently has exceeded 1 Mb/d. Over the last four months since July, it has increased its overall output by 171 kb/d.
Above is the weekly rig count for New Mexico. While there were an average of 104 rigs operating in November and December 2019, by the third week in February 2020 (Feb 21), 115 were in operation. This is a good indicator of further growth coming from New Mexico.
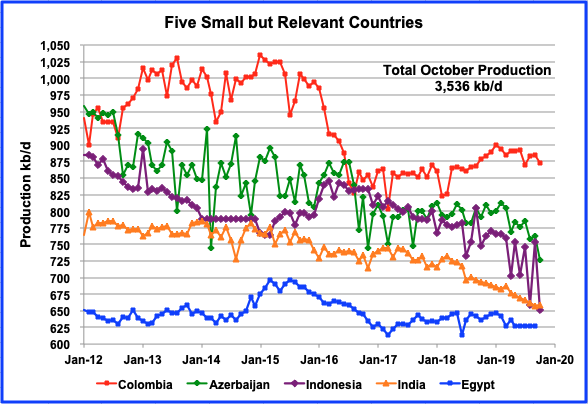
These five countries complete the list of Non-OPEC countries with annual production between 500 kb/d and 1,000 kb/d. All five are in overall decline. Their combined October production is 3,536 kb/d down 150 kb/d from September’s output of 3,686 kb/d. Since March, Indonesian output has been very erratic and has varied each month by 50 kb/d to 100 kb/d. In October, its output dropped by 103 kb/d. Is the erratic behaviour an indicator of upcoming problems in the Indonesian oil fields?
This chart shows Non-OPEC production without the US and is one of the more critical charts that bears watching in the near future. It is providing an early indication that the Non-OPEC oil producing countries, excluding the US, could currently be on a plateau. In October, the Non-OPEC countries, excluding the US, added 211 kb/d. The current October gap with December 2018 has decreased to 606 kb/d from 817 kb/d in September.
This year will be critical since Brazil and Norway have brought new fields online with new production capacity. Over the next two months, from the charts above, Norway will add 279 kb/d and Brazil will add 136 kb/d by year end, provided the EIA reports output levels as shown in the charts. Adding the additional combined production of 415 kb/d from Norway and Brazil to the 38,275 kb/d October output results in an output increase to 38,690 kb/d by year end. This would put the 2019 peak 191 kb/d lower than the December 2018 peak of 38,881 kb/d. Whether the peak will be exceeded or not exceeded, will depend on the increases and decreases from the remaining Non-OPEC countries. For instance Indonesia dropped 103 kb/d in October. How much will Indonesia recover by year end?
Of course the above estimate excludes the decline that never sleeps. Recall that in last month’s post, it was estimated that the current annual decline rate was estimated to be around 522 kb/d.
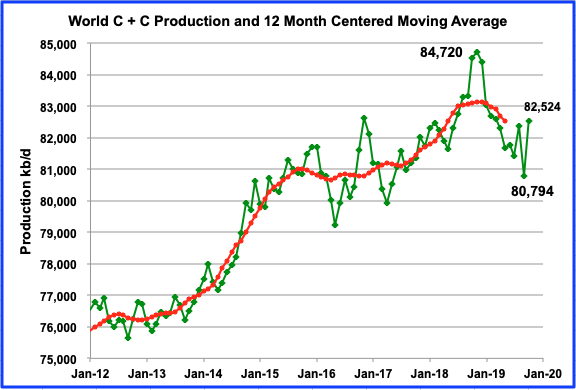
World oil production recovered by 1,730 kb/d to 82,524 kb/d in October 2019 from 80,794 kb/d in September. Of the 1,730 kb/d increase, 1,350 kb/d was contributed by Saudi Arabia after recovering from the attack on its Abqaiq processing plant, one of the world’s most important oil production facilities. In addition, two large contributions from Brazil and Norway added a combined total of 211 kb/d in October.
This is a comparison of the EIA’s estimate of OPEC’s C+C production vs OPEC’s crude output. The EIA’s estimate is roughly 2,000 kb/d higher, due to the inclusion of condensate. The EIA’s big production increase in October is 1,348 kb/d. However, OPEC shows a smaller increase of 1,037 kb/d. October OPEC production is now down by 3.9 Mb/d from the peak in September 2018.
Most oil production increase has been in the us. Most other non opec countries are in decline, The increase is mostly from very expensive process of fracking and tarsand mining. What should the take away be?
Davy on Tue, 25th Feb 2020 11:55 am
“We Can’t Stop This”: Japan Rolls Out New ‘Harm Reduction’ Policy Aimed At Limiting Virus-Related Deaths” https://tinyurl.com/txkpan3 zero hedge
“Overwhelmed by a flurry of ‘unsolved’ cases (that is, cases with no obvious connection to the outbreak in China, or anywhere else), Japanese health authorities announced on Tuesday a new plan intended to focus the country’s precious medical resources on the most serious cases, while advising those with mild symptoms to treat themselves at home…According to the Washington Post, the “basic premise” of the Japanese plan is that the virus can’t be stopped. That’s right: The Japanese are essentially acknowledging that the thesis proposed by Harvard epidemiologist Marc Lipsitch – ie that 70% of the world’s population might someday contract the virus – has at least some legitimacy…One senior advisor who spoke with WaPo put it the starkest of terms: We can’t stop it, so the best we can do is keep the body count as low as possible. “We shouldn’t have illusions,” said Shigeru Omi, a senior government adviser. “We can’t stop this, but we can try to reduce the speed of expansion and reduce mortality.” In keeping with this maxim, hospital space will be reserved for patients with the most serious symptoms, while those with simple colds and fevers have been asked to rest at home. They’re only to contact health authorities if a fever persists for four days. Or two for the elderly, people with chronic diseases or pregnant women . Companies have been asked to promote “flexible” work schedules to lessen daytime crowds aboard Tokyo’s mass transit. Citizens have also been advised to “limit” face-to-face conversations, avoid crowds and drinking sessions, and wash their hands if they touch straps while commuting on the train. Though the government didn’t explicitly “ban” large events, it asked organizers to consider whether their event was really that necessary.”


Sissyfuss on Sun, 23rd Feb 2020 8:33 am
Oh boy, we got charts.
DT on Sun, 23rd Feb 2020 8:36 am
Most oil production increase has been in the us. Most other non opec countries are in decline, The increase is mostly from very expensive process of fracking and tarsand mining. What should the take away be?
Davy on Tue, 25th Feb 2020 11:55 am
“We Can’t Stop This”: Japan Rolls Out New ‘Harm Reduction’ Policy Aimed At Limiting Virus-Related Deaths”
https://tinyurl.com/txkpan3 zero hedge
“Overwhelmed by a flurry of ‘unsolved’ cases (that is, cases with no obvious connection to the outbreak in China, or anywhere else), Japanese health authorities announced on Tuesday a new plan intended to focus the country’s precious medical resources on the most serious cases, while advising those with mild symptoms to treat themselves at home…According to the Washington Post, the “basic premise” of the Japanese plan is that the virus can’t be stopped. That’s right: The Japanese are essentially acknowledging that the thesis proposed by Harvard epidemiologist Marc Lipsitch – ie that 70% of the world’s population might someday contract the virus – has at least some legitimacy…One senior advisor who spoke with WaPo put it the starkest of terms: We can’t stop it, so the best we can do is keep the body count as low as possible. “We shouldn’t have illusions,” said Shigeru Omi, a senior government adviser. “We can’t stop this, but we can try to reduce the speed of expansion and reduce mortality.” In keeping with this maxim, hospital space will be reserved for patients with the most serious symptoms, while those with simple colds and fevers have been asked to rest at home. They’re only to contact health authorities if a fever persists for four days. Or two for the elderly, people with chronic diseases or pregnant women . Companies have been asked to promote “flexible” work schedules to lessen daytime crowds aboard Tokyo’s mass transit. Citizens have also been advised to “limit” face-to-face conversations, avoid crowds and drinking sessions, and wash their hands if they touch straps while commuting on the train. Though the government didn’t explicitly “ban” large events, it asked organizers to consider whether their event was really that necessary.”