Energy Return on Investment of Canadian Oil Sands Extraction from 2009 to 2015
Abstract
:
Oil sands, as unconventional oil, are so essential to both Canada and the world that special attention should be paid to their extraction status, especially their energy efficiency. One of the most commonly used methods to evaluate energy efficiency is the Energy Return on Investment (EROI) analysis. This paper focuses on EROI analysis for both in situ oil sands and mining oil sands over the period of 2009 to 2015. This time period represents an extension to periods previously considered by other analyses. An extended Input-Output model is used to quantify indirect energy input, which has been ignored by previous analyses of oil sands extraction. Results of this paper show that EROI of both mining oil sands (range of value: 3.9–8) and in situ oil sands (range of value: 3.2–5.4) display an upward trend over the past 7 years; EROI of mining oil sands is generally higher, but is more fluctuating than the EROI of in situ oil sands. Compared with EROI of other hydrocarbons, the EROI of oil sands is still quite low, despite the fact that it is increasing gradually.
1. Introduction
Canada, the world’s fourth largest oil producer, has the richest resource of oil sands [
1,
2]. Proven reserves of oil sands at the end of 2015 was 165.4 billion barrels [
3], accounting for 96% of Canada’s total proven oil reserves and 10% of total world proven oil reserves [
1]. In 2015, production of oil sands in Canada reached 2.4 million barrels/day, 85% more than production of its conventional oil at 1.3 million barrels/day [
3].
More than 70% of the oil produced by Canada is exported to other countries, mainly to the USA [
1], and 24.2% of Canadian oil sands (COS) production is controlled by foreign-based companies [
4], therefore, the COS sector is important not only to Canada, but also to the global oil economy.
During the past decade, many changes have occurred in the COS sector: oil sands extraction technology has improved rapidly [
5], the oil price has fluctuated, and there have been heated debates regarding the environmental, economic, and social trade-offs of the COS industry. Thus, it is important to investigate the most current situation in the COS sector.
Energy Return on Investment (EROI), which refers to the energy returned to the economy and society compared to the energy required to obtain that energy [
6], can evaluate the efficiency of energy extraction [
7] and is being used more and more frequently by energy researchers [
8,
9,
10,
11].
So far, the most recent EROI research regarding COS [
12] has focused only on mining oil sands, while in situ oil sands, another type of oil sands accounting for 80% of the total COS reserves, has been ignored. Brandt et al. [
13] considered both mining oil sands and in situ oil sands in their calculation for a group of energy return ratios, however, the energy consumption data of in situ oil sands used in their paper was mostly interpolated; furthermore, they did not consider indirect energy input. As well, the time period considered by Poisson and Hall was 1994–2008, while that considered by Brandt et al. was 1970–2010; both of which are now quite outdated, especially considering technological advances. Since the results of EROI analyses are significant to the investment and development planners, both within the Canadian government and the private sector, updated EROI numbers are necessary. Therefore, this paper focuses on EROI analysis of both mining and in situ oil sands extraction in Canada for the period of January 2009 to December 2015 (with monthly data).
2.1. Energy Return on Investment
EROI is a useful tool to carry out net energy analysis and to examine the energy efficiency of extracting an energy resource [
14]. The basic equation for calculating EROI is as follows [
15,
16]:
However, results of the calculation, even for the same kind of energy resource, can be very different due to the different boundaries of analysis used [
17]. To deal with this problem, Mulder and Hagens [
17] suggested a consistent theoretical framework for EROI analysis, which was then further researched by Murphy et al. [
16]. As a result, a more explicit two-dimensional framework for EROI analysis was proposed and the term standard EROI (
EROIstnd) was created. The EROI calculation of the COS in this paper is based on the
EROIstnd. EROIstnd is defined as the ratio between energy output in the boundary of the well mouth (or at the mine) and direct plus indirect energy inputs and can be represented in the following equation:
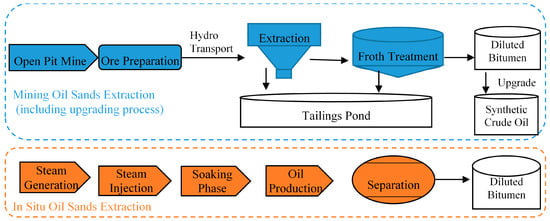
where Eo represents the sum of energy outputs expressed in the same units, while Ed and Ei represent the total direct energy input and indirect energy input, respectively. In order to make the results of our paper more comparable with the results of many other EROI research, we choose the boundary of EROIstnd as our research boundary. shows the boundary of EROI analysis in this paper and illustrates the different procedures of mining oil sands extraction and in situ oil sands extraction.
Figure 1. Procedures of mining oil sands extraction and in situ oil sands extraction.
Getting indirect energy input (
Ei) is challenging since this data is usually not available directly. Different methods have been tried to estimate
Ei [
7,
12,
18]: Hu et al. and Kong et al. used “industrial energy intensity” published by the government to transfer monetary input to energy input, but the use of “industrial energy intensity” is crude and approximate, and the monetary input considered is not complete. Poisson and Hall used government issued energy intensity to convert value of products to energy input, however, the resulting energy input is the sum of direct energy input and indirect energy input and the indirect energy input cannot be separated from the total energy input transferred from the monetary value of products. In addition, by calculating both direct and indirect energy input using the energy intensity, Poisson and Hall’s calculation relies heavily on monetary value. Therefore, this paper uses the Environmental Input-Output (EIO) model, the method we consider most reasonable so far, to analyze indirect energy input of oil sands extraction in Canada.
2.2. Environmental Input-Output (EIO) Model
To achieve a more accurate EROI value of oil sands extraction, we choose the EIO model in order to calculate the indirect energy input of oil sands extraction. The EIO model is extended from the standard Leontief Input-Output (IO) model in order to capture energy consumption flows in the economy [
19,
20] and is already used by some scholars to compute energy input in EROI analysis [
21,
22]. A detailed framework description of embodied energy analysis using the EIO can be found in [
23,
24,
25]. A simplified description of the essential parts is as below.
The total output of one economy is expressed as:
X represents total economic output, which can be expressed as a vector; y represents the final demand vector; and A represents the economy’s direct demand matrix. Matrix A describes the relationship between all sectors of the economy.
Assuming that (
I −
A) is non-singular, then the total economic output vector
X can be expressed by Equation (4):
I represents the identity matrix, (I−A)−1
is the Leontief inverse. Equation (4) illustrates the gross output needed to satisfy both the final consumption “y” and the corresponding intermediate consumption “(I−A)−1
” from each economic sector.
The EIO method combines the economic IO model with sectoral embodied energy input by multiplying the total economic output by each sector’s energy intensity (energy consumption per unit economic output from each sector).
If
E(1 ×
n) denotes the direct energy inputs for each sector from the perspective of sectoral production, Ω(1 ×
n) denotes the factor vector of the direct energy intensity for each sector, then
Therefore, the total energy consumption per unit of economic output of each sector within the country can be represented as:
If we subtract the direct energy input from the total energy consumption per unit of economic output, we can then get the indirect energy consumption per unit of economic output of each sector within the country. So the indirect energy consumption per unit of economic output of each sector within the country can be presented as:
3. Data Collection and Handling
The Alberta Energy Regulator (AER), previously the Energy Resources Conservation Board, provided the majority of the energy output and energy input data. Data was also collected and used from Statistics Canada, the National Energy Board (NEB) of Canada, the Canadian Association of Petroleum Producers (CAPP) and other related peer-reviewed literature.
The number of oil sands projects covered in this paper varies yearly, due to a limitation of complete source data regarding both energy output and energy input for all oil sands projects. As time goes by, data from more projects become available, thus, more projects are considered.
For the mining oil sands, there are a total of 10 projects for the years 2009 and 2010, 11 projects for each of the years 2011–2013, 12 projects for the year 2014, and 13 projects for the year 2015 included by Statistical (ST) reports of AER. However, due to data completeness, the energy output and energy input data of mining oil sands used in this paper only covers 8 projects for the years 2009; 9 projects for each of the year 2010–2011; 10 projects for the year 2012, and 11 projects for each of the years of 2013–2015. The total energy output of mining projects selected in this paper is almost the same as the total energy output of mining projects included by AER, which is larger than the energy output of the total mining oil sands sector published by CAPP (The reason why the total energy output of mining oil sands projects included by AER is sometimes even larger than the total energy output of the mining oil sands sector published by CAPP might be that some output of experimental crude production of mining oil sands extraction is not included by CAPP data). The sample mining oil sands projects chosen in this paper can objectively reflect the general situation of Canadian mining oil sands extraction.
The energy output and energy input data of in situ oil sands used in this paper covers 15 projects for the year 2009, 18 projects for the years 2010 and 2011, 20 projects for the year 2012, 22 projects for the year 2013, 25 projects for the year 2014, and 20 projects for the year 2015. All the in situ projects considered in this paper are thermal in situ projects, including steam assisted gravity drainage (SAGD) in situ projects and cyclic steam stimulation (CSS) in situ projects. The difference in number of projects considered for different years may have an effect on our results, while we think that the increasing number of projects included as time goes by actually reflects the objectively real-life situation of the COS industry.
There are about 200 in situ projects included in ST reports of the AER, therefore, the number of selected projects only accounts for 10–12% of the total number of projects included by the AER. However, the production of projects selected in this paper accounts for 59–77% of total production of in situ projects included by the AER, which is an average of 77% of the total of in situ oil sands production published by CAPP (see detail information in
Table S1 in the
Supplementary Materials). Therefore, the selected in situ projects in this paper can essentially represent the general situation of in situ oil sands extraction, though the incomplete samples may have some impact on the result of in situ oil sands EROI.
3.1. Energy Output of Oil Sands Extraction
All the energy output data was collected from ST reports provided by the AER. Energy output for mining oil sands comes from ST 39 (2009–2015) [
26], including: Synthetic crude oil (SCO) delivered, bitumen delivered, intermediate hydrocarbons delivered, paraffinic solvent delivered, diluent naphtha delivered, and electricity exported; while energy output for in situ oil sands comes from ST 53 (2009–2015) [
27], including bitumen produced and electricity exported.
Energy output data is given in different units, including m
3, tons, and MWh, which are then transferred, based on thermal values of different kinds of energy output, into the unit of tera joule (TJ) using the transfer indicator given by the NEB (2015) of Canada [
28].
3.2. Energy Input of Oil Sands Extraction
Direct energy input data for mining oil sands comes from ST 39, including: coke-fuel and plant use, process gas-further processing, process gas-fuel and plant use, paraffinic solvent-fuel and plant use, diluent naphtha-fuel and plant use, SCO-fuel and plant use, natural gas purchased, and electricity purchased. The majority of the direct energy input data for in situ oil sands comes from In situ Performance Presentation (ISPP) reports of different in situ oil sands projects in different years [
29]. Since the ISPP reports of some in situ oil sands projects only give energy consumption data in the form of line charts or column charts, we used “Engauge Digitizer 4.1” software (Mark Mitchell, Torrance, CA, USA), where required, to convert data into the form of direct numbers. Direct energy input data of in situ oil sands projects from ISPP include: natural gas consumption (including natural gas purchased and produced) and electricity consumption. Another kind of direct energy input of in situ oil sands projects, diesel consumption of in situ drilling activities, is calculated by multiplying total depth drilled with depth-specific drilling intensity. Data of total depth drilled comes from ST 98 [
30], while that of depth-specific drilling intensity comes from [
31].
Indirect energy input intensity is calculated using the EIO model described in
Section 2.2. Input-Output Tables of the Canadian economy were obtained from the Canadian Socio-Economic Information Management System (CANSIM) database of Statistics Canada (2009–2013) [
32]. Since even the most detailed version (Level L) of the Input-Output table of Canada only offers data from the “Oil and Gas Extraction” sector, instead of data from the “oil sands extraction” sector, we were only able to obtain indirect energy intensity for the oil and gas extraction sector, rather than for the oil sands extraction sector through the EIO model. Therefore, in this paper, we used the indirect energy intensity of the oil and gas extraction industry to replace the indirect energy input intensity of the oil sands extraction sector. In addition, since the most recently available Input-Output Table is from 2011, we calculated indirect energy input intensity for the years before 2011 (including 2011) and used the same indirect energy input intensity of 2011 as that of the years following 2011. Production energy consumption (direct energy use) data for different sectors of the Canadian economy was also obtained from CANSIM, Statistics Canada (2016). After getting the indirect energy input intensity, we multiplied it with the monthly economic output of the oil sands extraction sector to get the monthly indirect energy input data. The economic output of the oil sands extraction sector is calculated by multiplying the unit price and the production of the two main products of oil sands extraction sector: bitumen and SCO. The price of bitumen and SCO is collected from Alberta Ministry of Energy [
33].
4. Results
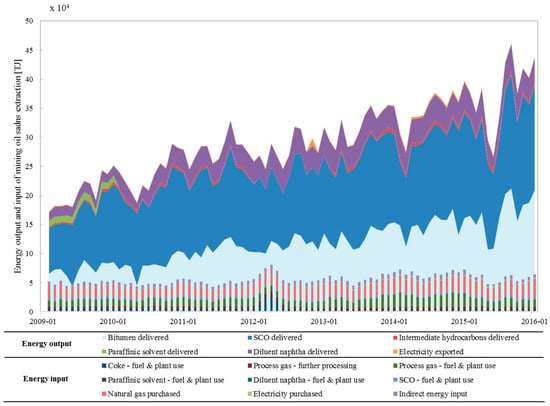
For mining oil sands extraction projects, the most significant energy outputs are bitumen and SCO, while the most significant energy inputs are process gas, natural gas purchased, and coke. Indirect energy input accounts for an average of 12% of the total energy input (see ). Both energy output and energy input data show strong fluctuations during the period of January 2009 to December 2015, while energy output presents a general upward trend.
Figure 2. Energy output and input of Canadian mining oil sands extraction. Note: In this figure, the stacked area figure represents energy output, while the stacked column figure represents energy input.
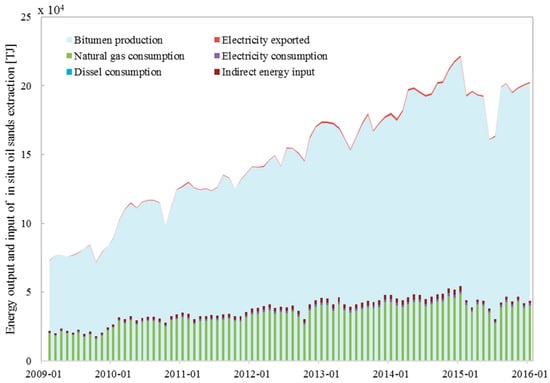
For in situ oil sands extraction projects, bitumen production makes up the majority of energy output. Electricity exported, another kind of energy output, is an extremely small amount. Natural gas consumption dominates the energy input of in situ oil sands extraction. Indirect energy input represents 6.8% of total energy input (see ). An increase of both energy output and energy input of in situ oil sands extraction was observed during this period.
Figure 3. Energy output and input of Canadian in situ oil sands extraction. Note: In this figure, the stacked area figure represents energy output, while the stacked column figure represents energy input.
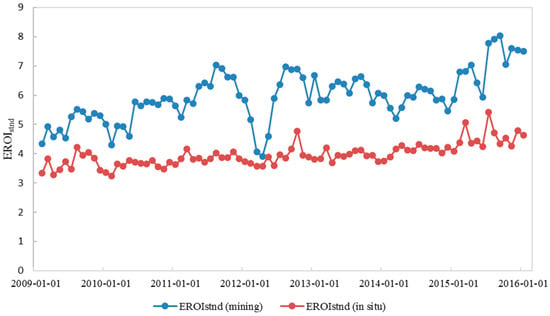
According to , EROI of mining COS is generally higher (range of value: 3.9–8.0) than that of in situ COS (range of value: 3.2–5.4). This is due to the fact that mining oil sands is easier to extract, as they are located in shallower areas underground (usually less than about 65 m) compared to in situ oil sands which are located much deeper underground [
2]. We also found that the EROI of mining oil sands projects is more fluctuating than the EROI of in situ oil sands. According to our analysis, the significant fluctuation of mining oil sands EROI is mainly caused by the fluctuation of energy output (especially bitumen delivered and SCO delivered). The fluctuation of energy output might be caused by the different depths and different resource quality of different parts of mining oil sands ore. Another possible cause might be the frequent maintenance of the oil sands mining facility since an oil sands mining facility is generally much larger and more complex than an in-situ processing plant [
34].
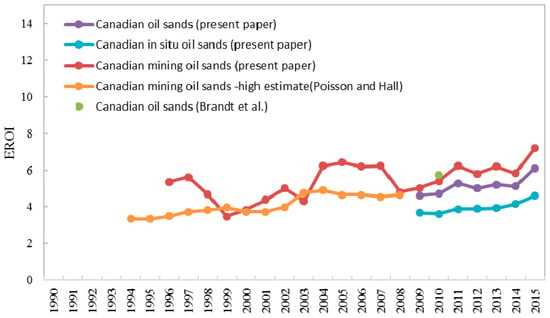
Figure 4. Standard Energy Return on Investment (EROIstnd) of Canadian mining oil sands and in situ oil sands.
Generally, the EROIs of both mining COS and in situ COS display an upward trend over the past seven years, and the trend is especially obvious for mining COS during the period 2014–2015.
The increase in mining oil sands EROI from 2014 to 2015 is most likely caused by the low global oil price, which started in the second half of 2014. The low oil prices may have added more pressure on oil sands companies to move to better-quality reservoir areas or to improve their efficiency through technology in order to survive.
We can see there is a big drop in mining oil sands EROI during the first season of the year 2012. Upon further investigation, we found that the drop was mainly due to the planned maintenance of mine equipment and the operational problem of a coker unit of the ABOS0077189 Suncor Energy OSG project [
35], a large mining oil sands project that accounts for more than 30% of the total SCO deliveries and about 10% of the total bitumen deliveries of all the mining oil sands projects included in this paper. Another reason could be the temporary decline in bitumen ore grade quality [
35].
5.1. Comparison with EROI from Previous Research
The results of the research reported by Poisson and Hall show that EROI of Canadian mining oil sands fluctuated around 4:1 during 1994–2008, with a small upwards trend [
12]. In order to compare our results with the results of Poisson and Hall’s paper, we extended the period considered in our calculation of the mining oil sands EROI to 1996–2015 (we start from 1996 since yearly data before 1996 was not found). Our calculation shows that EROI of Canadian mining oil sands was fluctuating in the range of 3.5–6.5 without a significant trend during 1996–2008. According to , the EROI result of our calculation is generally similar to but is comparatively higher and more fluctuating than the EROI result in Poisson and Hall’s paper.
Figure 5. Comparison among EROIstnd of Canadian oil sands (COS) (mining and in situ) from this paper and Energy Return on Investment (EROI) results from previous papers.
We attribute the variance partly to the different data sources. Firstly, the energy input data used in Poisson and Hall’s paper was processed (using energy intensity factor) from a report by the Natural Resources Canada’s Industry Program for Energy Conservation (CIPEC). As is noted by Poisson and Hall in their paper, the data from CIPEC is not as transparent as they would like, and the data processing (from volumes to energy units) for CIPEC’s analysis was effected by Natural Resources Canada’s Office of Energy Efficiency [
12]. On the other hand, the energy input data in our paper was obtained directly from the Alberta Energy Regulator government agency without any manual data processing. Secondly, the energy output data used in Poisson and Hall’s paper was also different from that used in this paper. Poisson and Hall used energy output data from the CANSIM database [
36] and from Natural Resources Canada [
37], while this paper used energy output data from the AER, and this data is more detailed. Thirdly, in Poisson and Hall’s paper, the data source of energy output and that of energy input are different, so they are not perfectly paired, while the energy output and energy input in this paper are from the same data source—the AER—and are included in the same files and are paired well. Therefore, we would consider our data more reliable and accurate.
Another possible reason for the different EROI results, as far as we can see, could be that the energy output data used in Poisson and Hall’s paper includes only synthetic crude oil (SCO) [
12], while the energy output used in this paper includes more products besides SCO, such as bitumen delivered, intermediate hydrocarbons delivered, paraffinic solvent delivered, diluent naphtha delivered, and electricity exported, and we consider all the other products as energy output. That might cause the higher EROI result in our paper. Brandt et al. [
13] showed that energy efficiency of both mining and in situ oil sands operations have increased over the history of the COS industry (before 2010). In addition, the Gross Energy Return ratio (GER) of COS (including both in situ oils sands projects and mining oil sands projects) in the year 2010 was 5.74; we consider GER as very similar to the indicator of EROI. Our research result shows that the upward trend of the COS industry has continued during the period 2009–2015, nevertheless, the EROI of oil sands calculated in this paper is lower than the results (GER) calculated by Brandt et al. We consider the potential explanation of this finding as the inclusion of indirect energy in our paper.
5.2. Comparison between EROI of Oil Sands and EROI of Other Energy Resources
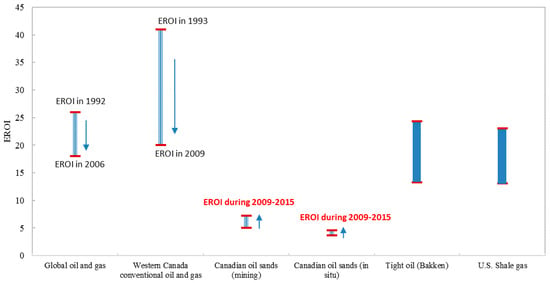
Although EROI of COS extraction has been increasing, it is still quite low compared with extraction of other types of energy resources (as is shown specifically in ).
Figure 6. Comparison of EROI with other energy resources. Note: EROI of global oil and gas comes from [
8]; EROI of Western Canadian conventional oil and gas comes from [
9]; EROI of COS (mining) and COS (in situ) during 2009–2015 are the results of this paper; EROI of tight oil (Bakken crude oil) comes from [
11]; EROI of US shale gas comes from [
10].
According to Gagnon et al. [
8], the EROI at the wellhead of global oil and gas extraction was approximately 26:1 in 1992, 35:1 in 1999, and 18:1 in 2006, which, though declining, is still much higher than the EROI of COS. Similar to the EROI of global oil and gas extraction, the EROI of Canadian conventional oil and gas extraction, though declining [
9], is still higher than the EROI of COS extraction.
Next, we compared oil sands EROI with EROI of other unconventional petroleum, given that we already know the EROI of oil sands is much lower than the EROI of conventional petroleum. According to Brandt et al. [
11], the EROI of tight oil extraction from the Bakken formation in the United States is in the interquartile range of 24.3–35.7; while Waggoner indicates that
EROIstnd
for the sweet spot of Bakken Oil production is as high as 63:1 [
38]. According to Yaritani and Matsushima [
10], the EROI
production/processing of US shale gas, another typical type of unconventional fossil energy resource, is estimated to be in the range of 13–23. These results show that the EROI of tight oil and the EROI of shale gas are in similar ranges, and that both of them are much higher than the EROI of COS and are even higher than the EROI of global oil and gas. It should be noted that there are large ranges for both tight oil EROI and shale gas EROI since real data regarding energy input and energy output of tight oil and shale gas extraction is not available, and current published research are based on simulated data, thus, the reliability of these results is questionable. Further research is needed to calculate accurate results for US tight oil and shale gas production.
According to a simple linear extrapolation analysis, the increasing EROI of COS will catch up to the decreasing EROI of global oil and gas after a decade, around the year 2027. However, the real trend for the future EROI of COS may not be as optimistic as what we have extrapolated, since the oil price may remain low, long-term continuous technology improvements may not be secured, and the reserves may become harder to access as the easy resources are extracted in the early stage.
Our extrapolation might also be subject to two possible “shocks”. One possible shock is that government policy pressure to reduce greenhouse gas emissions (i.e., the already-announced Alberta and Federal Canadian policies regarding oil sands emission caps and carbon taxes) will result in a step-change disruptive technology innovation analogous to the high oil price market-driven step-change disruptive technology innovation of multi-stage fracturing and horizontal drilling that brought shale oil and gas to market; this will dramatically increase oil sands extraction efficiency and improve EROI dramatically. Another possible shock is that conventional oil- and shale oil-EROI will reduce dramatically as lower quality conventional and shale oil reserves are accessed in response to the global oil price recovery. The oil price is expected to recover due to increasing world oil supply/demand balance and renewed discipline among members of the Organization of Oil Producing Countries (OPEC) cartel and their non-OPEC allies, like Russia, to limit supply after their 2014–2016 experiment with allowing global oil markets to operate without cartel intervention. One or both of these two possible shocks could see the oil sands, conventional oil, and shale oil EROI converge sooner than our straight-line extrapolation.
In addition, it should be noted that the EROI shown above is all for energy extraction procedures. If subsequent energy industry procedures, such as transportation, were also considered, the EROI results could be different. Further research is required to compare the different energy resources based on other EROI that considers not only energy extraction procedures, but also the procedure of transporting extracted energy to a specific market.
6. Conclusions and Implications
Net energy analysis provides a useful way to represent information about the efficiency of energy resource extraction. Oil sands are an essential energy resource for both Canada and the world. Therefore, the increasingly scientifically accepted method of net energy analysis-EROI was used in this paper to analyze energy efficiency trends of oil sands extraction.
Our results indicate that during the time period from January 2009 to December 2015, the EROI of Canadian mining oil sands fluctuated in the range of 3.9–8, with a general upward trend; the EROI of in situ oil sands also demonstrated a trend of steady increase (range of value: 3.2–5.4). Indirect energy input for mining oil sands extraction and that for in situ oil sands extraction accounted for 12% and 6.8%, respectively, of total energy input of mining oil sands extraction and in situ oil sands extraction. We also find that EROI of mining COS is more fluctuating than the EROI of in situ oil sands.
Compared with conventional oil and gas and other types of unconventional hydrocarbons, oil sands, especially in situ oil sands, still have a lower EROI. Low EROI of oil sands will have adverse effects on the natural environment because more energy is consumed to extract one unit of energy output, and greater energy consumption leads to more emissions. Also, a low EROI of oil sands will have an adverse effect on the economic development in Canada since larger amounts of energy are needed to be invested in the oil sands extraction industry instead of other value creation sectors. According to Hall et al. (2009) [
39], if the mine-mouth EROI of an oil-based fuel that will deliver a given service to the consumer falls below the minimum EROI for society of 3:1, this fuel must be subsidized by other fuels to be useful, and this fuel will not make energetic sense to the society. Further research should be done to calculate the accurate degree of the implication of low oil sands EROI.
Nevertheless, according to the results of this paper, the oil sands EROI is increasing gradually. Given that the global oil and gas EROI is generally declining, the COS should have a greater opportunity for future development, if the EROI of COS continues to increase (or increases faster) for a long enough period of time. However, a simple linear extrapolation analysis in this paper shows that it will take about a decade for the EROI of COS to catch up with the EROI of global oil and gas. In addition, due to the future potential risks of low oil price, discontinuous technology improvements, and the depletion effect of oil sands extraction, the real time needed by the COS industry to catch up with the EROI of conventional petroleum could be even longer. On the other hand, it is also possible that due to political pressure, resulting from the Paris Agreement, and new carbon taxes and emission caps, a future step-change disruptive technology innovation will improve EROI of the oil sands extraction dramatically, or that the EROI of conventional oil and gas will decrease dramatically, so that the time needed by the COS industry to catch up with the EROI of conventional petroleum could be shorter.
As oil sands development and other new unconventional energy resource development have become increasingly politically charged in an environmentally aware world, it is imperative that we have accurate scientifically sound information on the societal impact of this resource development. EROI is emerging as the increasingly accepted standard for this assessment as it is comparable across fuel types. Studies like ours must be done on other unconventional energy extraction technologies so that these different types of energy resources can be compared and evaluated. Policy and media discussions must be based on such scientifically vetted data rather than on claims by activists and counter-claims by industry or government.
Finally, it has long been stated the act of measuring and reporting something is the first step to improving its performance. One could argue that measuring and reporting in a scientifically sound manner the EROI of energy resource extraction types and individual projects will serve as an incentive to improving performance. Companies are required to report on a myriad of financial performance measures and have them audited by third-party auditors. EROI could similarly be required by companies to report and have audited. A standardized way of doing this, such as this paper suggests, is the first step to such a reporting system.
Supplementary Materials
The following are available online at
www.mdpi.com/1996-1073/10/5/614/s1. Table S1: Proportion of projects number and production of selected in situ projects; Table S2: Oil sands projects considered in this paper; Table S3: Direct energy input and energy output items included in this paper.
Acknowledgments
The authors of this paper would like to thank the Alberta Energy Regulator and Statistics Canada for their support with providing the source data. Also, the authors would like to thank National Natural Science Foundation of China (Grant No. 71373285; Grant No. 71503264), and the Humanities and Social Sciences Fund of China’s Ministry of Education (Grant No. 15YJC630121) for their generous support. Finally, the authors would like to thank the Haskayne School of Business for hosting the first author for a 12-month period as part of the scholarly partnership between the University of Calgary and the China University of Petroleum, Beijing.

Cloggie on Fri, 2nd Jun 2017 6:59 am
Canada should forget about further exploiting this oil sand sludge and concentrate on building additional pumped hydro capacity for (mainly) US renewable energy, to be built in the future:
https://www.neb-one.gc.ca/nrg/ntgrtd/mrkt/snpsht/2016/10-03pmpdstrghdr-eng.html
rockman on Fri, 2nd Jun 2017 9:51 am
“…the EROI of Canadian mining oil sands…a general upward trend; the EROI of in situ oil sands also demonstrated a trend of steady increase.” Not surprising post 2013: lower oil prices automatically increases the EROI because only projects producing more oil deliver an acceptable ROR.
Cloggie – “Canada” does develop the oil sands: petroleum companies do because that’s the business they are in. Thus petroleum companies don’t build dams. If the Canadian banned all oil development tomorrow none of the capex being spent by the oil patch would be spent on hydro. IOW Canadian hydro development is not related to oil develop.
Canadian free enterprise is not dominated by some socialist nut cakes as it is in some European countries. LOL.
antaris on Fri, 2nd Jun 2017 10:14 am
Yes Rock, not dominated but we do have a socialist nut cake and his bum buddy trying to shut down the largest hydro project in North America today, the Site C dam in B.C.
bobinget on Fri, 2nd Jun 2017 10:16 am
In point of fact, Alberta has a Socialist PM. (NDP)
(as if Texas or Oklahoma elected Bernie Sanders governor)
Rachel drags down a fast $52,000 a year. So she must be on Suncor’s payroll as well the way she supports pipelines and oil sands.
Justin Trudeau is also 100% behind a pipeline (for oil-sands) thru BC for export to Asia.
Canadians are sick of being ‘taken for granted’.
Canada needs to get away from a single customer, the US.
bobinget on Fri, 2nd Jun 2017 10:19 am
As for damns, here in Oregon we just call dam destroyers, ‘fucking environmentalist, salmon loving queers’
bobinget on Fri, 2nd Jun 2017 10:25 am
http://calgaryherald.com/news/politics/braid-in-pipeline-dispute-alberta-has-ways-to-get-tough-with-b-c
Cloggie on Fri, 2nd Jun 2017 10:32 am
“Canada” does develop the oil sands: petroleum companies do because that’s the business they are in.
Canada has a government that can decide things. Obviously companies do what they are used to do, until they are stopped.
In the seventies the mines in the Netherlands were closed, as a government decision. Not because they had run out of coal, of because the mining companies no longer made a profit, but because we had an enormous quantity of natural gas, that could be easily won and was much cleaner than coal:
http://cdn.prod.else4.nl/uploads/2015/07/ECO-mijnen_-1024×736.jpg
My free advice was directed at the Canadian government, not Canadian oil companies.
Canadian free enterprise is not dominated by some socialist nut cakes as it is in some European countries. LOL
Socialist countries no longer exist in Europe, despite what some Americans like to claim. Went out of fashion after 1989.
It looks like America instead could be opting for socialism after Trump.
http://www.townandcountrymag.com/society/politics/a9949872/mark-zuckerberg-for-president/
Nowhere in the world are people more prone to leftism than in the US/Canada:
https://www.lewrockwell.com/lrc-blog/ignorant-little-monsters-evergreen-state-college/
rockman on Fri, 2nd Jun 2017 11:08 am
Cloggie – “Canada has a government that can decide things”. No, Canada does not have a govt that can decide to stop petroleum development. Even if the govt only proposed to shut down oil sands production those politicians would be replaced by the voters before such plans could begin implementation.
Canada produces hydrocarbons because the majority of its voters elected politicians who support fossil fuel production to some degree. Just like Norway and some of your other cousins. LOL.
Apneaman on Fri, 2nd Jun 2017 11:33 am
clog, when I lived in the states a number of brain washed retards, who had never been to Canada, told me Canada was a socialist country because of health care. I asked them to tell me how it works – silence.
You remind me of those guys, clog (except you have superior spelling and grammar). What is your claim of lefty Canada based on? Ever been there? How many Canadians have you met in your life? It appears All your info come from right wing & libertarian merican blogs and is about university campuses in Vancouver or Toronto. I’ve told you before there is a blue collar conservative bent (traditional not rabid political) running through this Canada. Before I moved down to the coast I lived in a town of 17,000 that had 25 churches that were attended and well kept. I will admit that in the last 15 years I have seen more radical political stupidity in Canada, same as everywhere, and bumped by the internet.
Here is a typical editorial from a Calgary newspaper. Does it sound like liberal hysterics to you?
Editorial: Pipelines create jobs
http://calgaryherald.com/opinion/editorials/editorial-pipelines-create-jobs
Now this sounds extremely leftish to me.
Amsterdam city hall to get gender neutral toilets
http://nltimes.nl/2016/07/21/amsterdam-city-hall-get-gender-neutral-toilets
I don’t give a shit, but you won’t catch me ‘hanging out’ in one of those bathrooms…….maybe if they have a glory hole.
GregT on Fri, 2nd Jun 2017 12:27 pm
“Canada produces hydrocarbons because the majority of its voters elected politicians who support fossil fuel production to some degree.”
The majority of it’s voters are too stupid to elect politicians based on environmental issues. The majority of voters cast their ballots for Trudeau because he has charisma, and they think he is a hunk. That, and they were fed up with Stephen Harper and his conservatives ass licking Big American corporations, Big Oil, and the US MIC.
GregT on Fri, 2nd Jun 2017 12:36 pm
Also, the ass licking cannot be stopped with a simple regime change. That would require a complete revamping of the monetary system, which would lead to yet another illegal invasion/occupation.
shortonoil on Fri, 2nd Jun 2017 1:51 pm
In agreement with research that has been conducted by Dr. Charles Hall, and other investigators the Hills Group has concluded that an ERoEI (energy returned on energy invested at the well head) below a specific level has no economic benefit for the overall economy. The Hills Group through energy analysis has calculated that value at 6.9 : 1. Dr. Hall using his specific methodology has ascertained an EROI of at least 7.0 : 1 is necessary for the continued operation of modern society.
Below the ERoEI value of approximately 7.0 :1 energy supplies begin to act as energy sinks, as opposed to energy sources. It is the point where the energy to produce energy becomes greater than the energy that can be delivered to the economy. As stated by Marion King Hubbert when the average return for an energy supply reaches that minimum level “production will cease no matter what the monetary price may be.”
Further explanation of the development of the thesis by the Hills Group is available at our web site, and the full 68 page report “Depletion: A determination for the world’s petroleum reserves”. A 10 page PDF covering the theoretical development of the thesis can be downloaded at: http://www.thehillsgroup.org/petrohg10.pdf
See the published works of Dr. Charles Halls and his associates for their assessment of the minimum EROI required to continue operating a modern industrial society.
http://www.thehillsgroup.org/
Alice Friedemann on Fri, 2nd Jun 2017 1:52 pm
EROI doesn’t matter.
Why tar sands, a toxic ecosystem-destroying asphalt, can’t fill in for declining conventional oil, a book review of Tar Sands: Dirty Oil and the Future of a Continent, 2010 edition, 280 pages, by Andrew Nikiforuk.
http://energyskeptic.com/2016/why-tar-sands-a-toxic-ecosystem-destroying-asphalt-cant-fill-in-for-declining-conventional-oil/
Introduction
Many “energy experts” have said that a Manhattan tar sands project could prevent oil decline in the future. But that’s not likely. Here are a few reasons why:
Reaching 5 Mb/d will get increasingly (energy) expensive. Because there’s only enough natural gas to mine 29% of tar sands(and limited water as well)
Since there isn’t enough natural gas, many hope that nuclear reactors will replace natural gas. That would take a lot of time. Kjell Aleklett estimates it would take at least 7 years before each candu nuclear reactor could be built, and the Canadian Parliament estimates it would take 20 nuclear reactors to replace natural gas as a fuel source.
Mined oil sands have been estimated to have an energy returned on invested of EROI of 5.5–6 for mined tar sands (perhaps 10% of the 170 billion barrels), with in situ processing much lower at 3.5–4 (Brandt 2013). Right now, 90% of the reserves being developed are via higher-EROI mining, yet 80% of remaining oil sands reserves are in situ, so the remaining reserves will be much less profitable
Counting on tar sands to replace declining conventional oil, with an EROI as high as 30 will be hard to accomplish if several EROI experts estimate that an EROI of 7 to 14 is required to maintain civilization as we know it (Lambert et al. 2014; Murphy 2011; Mearns 2008; Weissbach et al. 2013)
Also: In a crash program to ramp up production as quickly as possible, production would likely peak in 2040 at 5–5.8 Mb/d (NEB 2013; Soderbergh et al. 2007).
Soderbergh, B., et al. 2007. A crash programme scenario for the Canadian oil sands industry. Energy Policy 35.
Yet tar sands compose a huge percent of the oil reserves remaining! Most of them will never be exploited
Cloggie on Fri, 2nd Jun 2017 2:10 pm
Rockman – Cloggie – “Canada has a government that can decide things”. No, Canada does not have a govt that can decide to stop petroleum development. Even if the govt only proposed to shut down oil sands production those politicians would be replaced by the voters before such plans could begin implementation.
Canada produces hydrocarbons because the majority of its voters elected politicians who support fossil fuel production to some degree. Just like Norway and some of your other cousins. LOL.
Rockman, I didn’t suggest that Canada should end its tar sand business. I suggested they should gradually abandon their tar sand business and gradually replace it with storage business. Canada has huge territories and high mountains that could contain huge amounts of pumped water from renewable energy sources all over North-America.
Just like Norway does, but on a far larger scale:
http://spectrum.ieee.org/green-tech/wind/norway-wants-to-be-europes-battery
Canada’s contribution to a post-carbon world.
onlooker on Fri, 2nd Jun 2017 2:42 pm
Yes, it is studies like the Hills Group and Dr. Hall that inform society of the prospect of continuing the Age of Oil. Not the economic vicissitudes of the Oil market and the General Economy which will in retrospect be seen as symptoms of the larger and more profound reality of energy availability or lack thereof.
jawagord on Fri, 2nd Jun 2017 5:02 pm
In Canada natural resources belong to the provinces, so development of the oilsands is largely a provincial (Alberta) decision, not a government of Canada decision. Centralized government control wasn’t considered desirable in a country 240 times larger than Holland.
ERoi is largely an academic pursuit, in the real world it doesn’t mean anything to oil or oilsands production. Production is a function of profitability and oilsands operators are doing the same thing as shale oil producers, they are driving down costs to stay profitable, hence Canadian oilsands production is forecast to continue to rise this year and next year. The mistake are pseudo academics keep making with the ERoi and ERoEi arguments is assuming oil is an end product that takes oil to produce it. It’s not an end product, it’s a feedstock used in the produce of liquid fuels and lubricants. The production, transportation and refining processes of oil and bitumen use electricity and natural gas which are high ERoi inputs into the process to make fuels. So low ERoI oils are and will remain valuable as feedstocks and as the article says the EROi of oilsands is improving.
rockman on Fri, 2nd Jun 2017 11:45 pm
Alice – “Why tar sands…can’t fill in for declining conventional oil”. Not by themselves, of course. But big increases of oils sands imported into the US combined with our big increase in light oil/condensate production created the ideal blended oil our refiners are optimised to crack. As you can see from the chart below the increase in suitable oil blends made from the oil sands and the US shales greater reduced the rate of decline in US refinery out put.
https://www.eia.gov/dnav/pet/hist/LeafHandler.ashx?n=pet&s=mttrx_nus_1&f=a
As a result of the huge increase in both the heavy Canadian oil and light oil from the US coming together at the right time the US export of refinery products has increased more then 400% in the last 12 years:
https://www.eia.gov/dnav/pet/hist/LeafHandler.ashx?n=PET&s=MTTEXUS1&f=A
Thus I would have to disagree: the combination of the unconventional heavy Alberta oil and the unconventional light US oil has done a great job of replacing “conventional oil”. The world doesn’t consume neither conventional nor unconventional oil: it consumes refinery products and cares not at all what they were made from.
So perhaps the better way to ask the question: will the unconventional oils “fill in” for the conventional oil with respect to refinery products? Not only is that answer YES but the increase in unconventional oil has led to a record increase in refining capacity:
“Data on Thomson Reuters Eikon shows that available global capacity to refine oil into fuels like gasoline, diesel, or jet and shipping fuel, will reach 101.8 million barrels per day (bpd) in August, the highest on record, and up from about 97.25 million bpd in March.”
And that increase in refining unconventional oil has also allowed in the last 2 years the global customers to consume more refinery products then ever before in history.
Of course, the above just addresses the production of the unconventional oils and not the cost to do so. But that’s no different then the history of the conventional oils such as wild swings in prices that impacted their consumption: the high cost of conventional oil in the late 70’s was just as unsustainable as the high cost of the unconventional oil recently proved:
https://www.indexmundi.com/energy/?product=oil&graph=production
So again, with regards of volume of refinery products delivered to the consumers, the unconventional oils have done an excellent job of “filling in” for the declining conventional oils: the world is currently producing more GHG then ever before.
OTOH how long might they continue producing that volume of product is a very different question.
Cloggie on Sat, 3rd Jun 2017 3:31 am
What is your claim of lefty Canada based on? Ever been there? How many Canadians have you met in your life? It appears All your info come from right wing & libertarian merican blogs and is about university campuses in Vancouver or Toronto. I’ve told you before there is a blue collar conservative bent (traditional not rabid political) running through this Canada. Before I moved down to the coast I lived in a town of 17,000 that had 25 churches that were attended and well kept. I will admit that in the last 15 years I have seen more radical political stupidity in Canada, same as everywhere, and bumped by the internet.
I know that there is both in the US and Canada a silent majority of bible thumpers and traditionalists, but their main characteristic is that they are, well… silent.
When I call North-Americans the most leftist people on the planet (and I stick to that assessment), I am referring to those people who matter. Those who are NOT silent. And that is politics, media and academia.
First of all lets be clear about this left/right thing. There is a North-American and a European understanding of left-right.
North-American right is defined purely economical. Right = small government, low taxes, big business. Making money and consumerism is the sole purpose of existence. Left is the opposite.
European right is defined as blood & soil. European right means “Germany for the Germans”, etc. The European left in contrast likes to mix things.
This European left stance regarding race & ethnicity is accepted by both the North-American left AND right. Nowhere on the planet is the word “racism” expressed with more fanatical contempt, taken more seriously than in North-America.
There is of course a historic reason for this low level of ethno-centrism and ethnic pride in North-America: everybody is an immigrant. North-America simply didn’t have the time to develop a homogeneous ethnic identity, which takes many centuries. And the ones with a serious blood & soil ethnic identity that does exist on North-American soil (“Chief Seattle”) were sidelined/wiped out.
But in this fast modern world with easy mass transportation, it is extremely difficult to protect and maintain your ethnic identity, especially if you are economically successful, which attracts freeloaders from all over the world and on top of that you are burdened with that religion of tired old Romans, I mean Christianity, that prescribes that you should “love everybody”. A better recipe for collective suicide doesn’t exist.
My attitude meanwhile is gradually shifting towards va banque. Wiping out European civilization is a distinct possibility. America and Europe overrun by low IQ Muslims and Africans, completely destroying any form of higher civilization: universities, companies, nature parks, railways, motorways, museums, music halls, stadiums, agriculture, cathedrals, space travel, computers, solar panels, everything wiped out. And it needs to said that all the goodies mentioned is race-based. White DNA.
The West is heading towards a showdown, North-America first btw, for demographic reasons. Either we finally trash that stinking religion for cowards Christianity, including its secular offshoot Marxism and develop and ethno-centricity that would make Hitler blush and “go full Roman” or it is game over for white civilization and Planet of the Apes is next.
You worry about climate change and peak oil all you can (and I do too) but that is not the next item on the planetary agenda/to do list. What is next is the breakdown of the West as a result of decades of mass migration, promoted by the deep state of the US empire and murderous ethnic confrontation. Parts of North-America and Western Europe as one giant Syria. It is still a good idea to grow your own food and produce your own energy, as long as you know what you are preparing for: (civil) war and breakdown of society, not depletion.
Nick Gjergji on Fri, 25th May 2018 12:21 am
The EROI coefficient on oil and gas production (fossil fuel), must be compared with EROI from bio fuels, ethanol and other products. This comparison will help peoples to better understand the benefits they have from fossil fuel production.
Antius on Fri, 25th May 2018 6:03 am
Given that transport is the principal consumer oil products, the actual EROI for the energy service should be thought of as being a factor of 5 lower, to account for engine inefficiency. Presumably, refining also constitutes a net energy cost.
This means that in 1992, global oil had an EROI of 5.2 on an energy service basis and this declined to 3.6 by 2006. For tar sands, real EROI is 0.8-1.4. For tight oil: 2.4-5.0.
DC Electric motors are 80-90% efficient. Transmission of grid electricity is 93% efficient. Burning shale oil in a gas turbine is 50% efficient. This means that an electric vehicle drawing power from the grid will produce about twice as many mpg as a gasoline ICE vehicle, all else being equal. It can also be powered by a variety of other energy sources. In an oil constrained world, the direction of travel should be clear. Yet, everything depends upon the development of conductive power transfer systems that negate the need for heavy and expensive batteries for long-distance journeys (aka ‘the Swedish solution’). Getting this to work and then expanding the infrastructure, should be one of the main priorities of sustainable development.
Davy on Fri, 25th May 2018 6:18 am
“Given that transport is the principal consumer oil products, the actual EROI for the energy service should be thought of as being a factor of 5 lower, to account for engine inefficiency. Presumably, refining also constitutes a net energy cost.”
Yes, but also remember that transport is a huge economic multiplier. I know that is not part of the physics but let’s remember how productive and vital transport is so physical inefficiencies are made up economically by activity. So instead of focusing only on the physics of engines we should also focus on behavior. Eliminate some of the worst behavior that is only marginally productive.
“DC Electric motors are 80-90% efficient. Transmission of grid electricity is 93% efficient. Burning shale oil in a gas turbine is 50% efficient. This means that an electric vehicle drawing power from the grid will produce about twice as many mpg as a gasoline ICE vehicle, all else being equal. “
Yea, but, consider the cost of supply systems then consider the efficiency loss when you switch to batteries and the constraints on space that batteries present. Batteries have to be part of the equation to direct electric transport. I am all for more direct electric powered transport but this is only reasonable to a point. The cost of installing such a system are astronomical except for sweet spots.
“It can also be powered by a variety of other energy sources. In an oil constrained world, the direction of travel should be clear. Yet, everything depends upon the development of conductive power transfer systems that negate the need for heavy and expensive batteries for long-distance journeys (aka ‘the Swedish solution’). Getting this to work and then expanding the infrastructure, should be one of the main priorities of sustainable development.”
Definitely and time is wasting but this is not a silver bullet solution it is just more of the many solutions we need to embrace to extend out modernism before it is too late and by too late I mean pain, suffering, and death when transport stops.
Antius on Fri, 25th May 2018 8:37 am
“Yea, but, consider the cost of supply systems then consider the efficiency loss when you switch to batteries and the constraints on space that batteries present. Batteries have to be part of the equation to direct electric transport.”
The point is that the battery can be much smaller, as it only needs 50km range to reach a main trunk road. That means a 10kWh battery weighing 50kg and having volume 150 litres, instead of a battery 10 times that size.
“I am all for more direct electric powered transport but this is only reasonable to a point. The cost of installing such a system are astronomical except for sweet spots.”
There are roads that will never be electrified. This is a solution for main roads. The Swedish developers estimated a cost of $1million per mile of road electrified. The CIA factbook states that the US has: 4,304,715 km paved roads, of which 76,334 km are expressways. Wiki describes the US national highways system as comprising 259,000km of roads.
https://en.wikipedia.org/wiki/National_Highway_System_(United_States)
If each were electrified on a single lane in both directions, the cost would be $520billion. That is about the cost of two years of imported oil into the US at $70/barrel. Expensive yes, but it would permanently insulate the country from future oil shocks.