Peak Oil is You

Donate Bitcoins ;-) or Paypal :-)
Page added on November 19, 2014
50 Ways to Leave The Marcellus—The Race to Increase Natural Gas Take-Away Capacity

The economics of natural gas production in the dry Marcellus, the wet Marcellus and the Utica are so favorable—and the shale gas resource so bountiful—that the only real limit on how much the Marcellus/Utica plays can produce is the capacity of the pipeline network in the Northeast and neighboring regions to take gas to market. And there’s the rub, because the region’s gas transmission infrastructure was designed decades ago to deliver large volumes of gas to the Northeast, not away from it. That’s why the midstream sector has made “a new plan, Stan,” and is now in now in the midst of a major reworking of the pipeline system—not just within and near the Marcellus/Utica but just about everywhere east of the Mississippi. The $30 billion re-plumbing effort and its effects on the gas market as a whole are the subject of RBN’s latest Drill-Down Report, “50 Ways to Leave The Marcellus” which is available today to Backstage Pass members. In today’s blog, we provide an overview.
For decades, the US Northeast was a huge natural gas sponge, its residents, businesses and industry absorbing all the Gulf Coast, Midcontinent, Rockies and Canadian gas that pipelines into the region could deliver. In the past three years, however, gas production in the Northeast’s dry Marcellus, wet Marcellus and Utica has been growing by leaps and bounds. First, this burgeoning production started to displace inbound flows. Now Marcellus/Utica gas is pushing outward into neighboring areas like the Midwest and Ontario and, with total production in the region topping 18 Bcf/d and headed for 30 Bcf/d by 2019 (see Figure #1), the region has set its sights on still-bigger markets, including the Southeast and—the grand prize—the Gulf Coast itself, with what are expected to be dozens of gas-guzzling petrochemical facilities and liquefied natural gas export terminals.
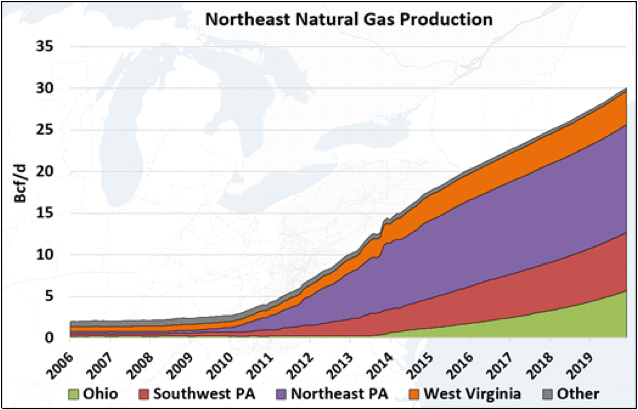
Figure #1 – Northeast Natural Gas Production
The foundation for the projected growth in Northeast production is strong. Initial production rates and other factors suggest that the break-even gas price for dry Marcellus producers in northeastern Pennsylvania is somewhere around $2.50/MMBTU. The break-even price in the wet Marcellus in southwestern Pennsylvania and northern West Virginia—and in the NGL- and condensate-rich Utica in eastern Ohio—is even lower (about $2/MMBTU or below) because producers there bring in big bucks from the liquids side of their business; for them, revenue from gas is just gravy. But producer rates of return are only optimized if their gas (and their NGLs and condensate) can be delivered to market without constraints and without the basis penalties that come with pipeline congestion.
“The answer [to constrained Northeast gas] is easy if you take it logically,” as Paul Simon said (sort of), and involves adding new take-away capacity, lots of it. Relieving—and, in time, eliminating—the constraints Marcellus/Utica producers have been dealing with (and suffering financially from) is a primary aim of a dozen or more midstream companies that are now scrambling to rework their pipeline networks to reflect the Northeast’s fast-paced change-over from net consumer of gas to net supplier. This reworking involves a variety of projects, some to handle increasing flows within the Marcellus/Utica, others to add bi-directionality to what had been one-way trunklines to the Northeast, and still others to augment existing lines with needed incremental capacity. The problem for Marcellus/Utica producers—in the near-term at least—is that re-plumbing much of the gas pipeline network in the eastern US requires a lot of planning and coordination, and in most cases lots of regulatory approvals, all of which take time (as does project construction).
|
|
N E W ! ! 50 Ways to Leave the Marcellus: We have just released our eleventh Drill-Down report for Backstage Pass subscribers examining Northeast natural gas take away capacity. More information about 50 Ways here. |

Understanding the production, demand and pricing drivers behind the effort to develop new take-away capacity out of the Marcellus/Utica is critical to assessing how the markets for gas out of the regions will develop through the rest of this decade and into the 2020s. In the new Drill-Down Report, RBN reviews the evolution of the gas market in the Northeast; the pace of gas production growth in the dry Marcellus and, more recently, the wet Marcellus and the Utica; and the market signals that showed the region’s pipeline constraints were worsening (and fast). After this discussion of basis differentials and their effect on pipeline development and production, the report gets into the meat of the matter, namely, the 50 to 60 pipeline projects affecting Marcellus/Utica, and—most important—the 41 of these projects that will actually add take-away capacity out of the production areas (and when that capacity will be added). The projects are grouped in five corridors (see Figure #2 below): Northeast to the New England market (purple), Northeast into Canada (blue), Midwest via Ohio (green), the Gulf Coast via Ohio (red), and the Southeast along the Atlantic Coast (orange).
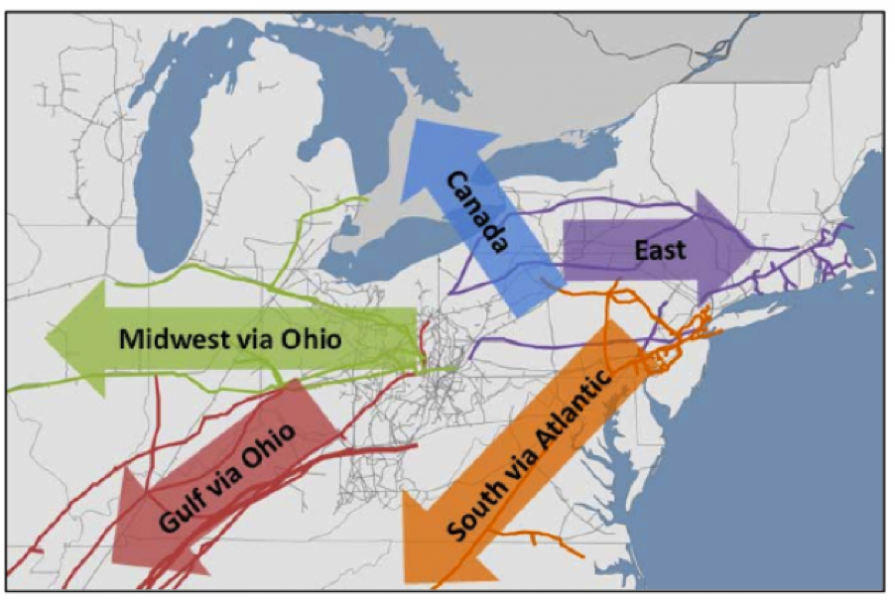
Figure #2
Source: RBN Energy; Page 34 of the Henry Hub report
To understand the market impact of these dozens of pipeline proposals, RBN performed a three-step filtering process to determine which pipeline projects should be included in the estimate of take-away capacity. First, we removed from consideration projects that do not actually move gas beyond the constrained area markets or to a pipeline with available capacity that can do so. Second, “end to end” pipelines were reconciled to avoid double-counting. And third, once a population of relevant capacity additions was identified, the overall impact was adjusted for likelihood of project completion. In addition to listing the take-away projects (and their capacities and on-line dates) in tabular form, the report provides schematic maps for each of the five take-away regions that show the contribution that each major take-away project will make. It also assesses the longer-term potential for additional pipeline projects.
 |
Battle for Henry Hub – Special Report
Examines the impact of huge surpluses of natural gas bearing down on the Henry Hub in South Louisiana from Marcellus/Utica in the east and supplies from the west sourced from high-BTU and associated gas from plays in TX, NM, OK and ND More information about Battle for Henry Hub here. |
The end result is a comprehensive analysis of what’s being done to help bring Marcellus/Utica gas to market. The Drill-Down Report describes how each of the five major corridors has its own unique challenges. For example, take the East corridor projects. Here, in addition to adding Marcellus/Utica take-away capacity (mostly from the dry Marcellus), many projects are intended to relieve some high-profile bottlenecks in New York and New England that have, at times, constrained wintertime gas deliveries for power generation. Many Atlantic-Corridor-to-Southeast projects are tied to power generation too, and for that reason some pipelines are being developed by affiliates of electric utilities. (Reversal projects along Transco’s mainline also are a big part of the Southeast story.) Gulf-via-Ohio corridor projects, meanwhile, involve some destination risk because the pace of Gulf Coast gas demand growth is uncertain and the market is surrounded by multiple supply areas–that is, petchem and LNG export facilities along the Gulf can be supplied from Texas and Louisiana themselves, from offshore Gulf of Mexico production and from the Midcontinent, in addition to being supplied from the Northeast. The report notes that production is also increasing in the Eagle Ford, the Permian Basin, Oklahoma, and the Williston/Niobrara regions, each of which—like the Marcellus/Utica—has its eyes on the Gulf Coast market as well.
| This competition for Gulf Coast market share—and its likely outcome—are discussed in detail in a new, joint report by RBN Energy and BTU Analytics called “Battle for Henry Hub.” Because Battle for Henry Hub is a joint venture report, it is not included with RBN’s Backstage Pass service. In addition to the report, backup data files and presentation of report results are also available. More information about this report is available at: |
“But I’ll repeat myself, at the risk of being crude.” The gains in Marcellus/Utica production – a 15-fold increase from 2 Bcf/d in 2008 to 30 Bcf/d in 2020 are huge. And they are driving an infrastructure repurposing and build-out that, with the resulting ability to move Northeast gas as far as Florida, Louisiana and Minnesota, is one of the most important energy developments of this century. This new Drill-Down Report’s look at both the big picture and the details could not come at a better time.
43 Comments on "50 Ways to Leave The Marcellus—The Race to Increase Natural Gas Take-Away Capacity"
Makati1 on Wed, 19th Nov 2014 6:26 am
Another sales pitch for ‘investors’. Charts that use rulers to draw lines always upward are suspicious. 2020 is a long way off and by then, the whole fraking business may be dead. Like the dreams of LNG fleets to Asia and Europe from US ports. Hard to compete with the cheap NG from Iran and Russia thru pipelines.
nony on Wed, 19th Nov 2014 6:47 am
The Marcellus is mighty. All hail the Marcellus.
Davy on Wed, 19th Nov 2014 6:56 am
NOo, is this the bitch slap optimism I have been waiting for?
Can mighty Marcellus protect us from an energy descent in other areas?
Please NOo, tell me it is so.
coffeeguyzz on Wed, 19th Nov 2014 7:45 am
The production from the underlying, larger Utica formation may very well surpass the Marcellus’ output in years to come.
The number of Utica wells that have IPs over 20 million cubic feet are growing with some throwing off more than 40 mmcf in their first 24 hours.
As the infrastructure for the Marcellus is built out, the Utica will become an increasingly attractive prospect.
Kenz300 on Wed, 19th Nov 2014 8:40 am
The fossil fuel PR machine continues…….
Climate Change is real……. we need to deal with it…
———————-
The Worst Koch-Funded Lies About Climate Change in 90 Seconds • BRAVE NEW FILMS – YouTube
https://www.youtube.com/watch?v=O0v1DTp0a10&list=PLQ9B-p5Q-YOPOJ9sIfgJ5_XRHFz7IatXL&t=3s
marmico on Wed, 19th Nov 2014 8:41 am
Fortress North America in natural gas in 2017. Fortress North America in petroleum in 2020. Fortress North America in coal in 2014. What descent in fossil fuels?
Take a $100 billion annually from the military budget and invest in renewables and the electric grid.
ghung on Wed, 19th Nov 2014 9:26 am
“…the only real limit on how much the Marcellus/Utica plays can produce is
the capacity of the pipeline network in the Northeast and neighboring regions to take gas to markethow much is actually down there and the price of natural gas.That wasn’t hard to fix, was it?
westexas on Wed, 19th Nov 2014 9:54 am
Ghung,
You don’t get it. With unlimited pipeline capacity, we would have unlimited production, to infinity and beyond.
In any case, back here in the real world the year over year 20% decline* in Louisiana’s annual marketed natural gas production from 2012 to 2013, presumably because of a decline in gas production from the Haynesville Play, is pretty strong support for the Citi Research estimate that the underlying decline rate US natural gas production is about 24%/year.
At 24%/year, just to maintain current production for four years, we need to replace roughly 100% of current US natural production in four years.
Of course, it’s when, not if, that the production from new wells can no longer offset the declines from existing wells, i.e., Peaks Happen.
Year over year, from July, 2013 to July, 2014, the industry was able to offset declines. US dry gas production was 70 BCF/day in July, 2013 and 70 BCF/day in July, 2014.
However, at about a 24%/year decline rate, we need about 17 BCF/day of new dry gas production, every year, just to maintain current production.
To put this in perspective, Canada’s 2013 dry gas production was 14 BCF/day. Based on the Citi report, in order to maintain current US dry gas production we need to put on line the productive equivalent of all of Canada’s current dry gas production, every single year, times 1.2. Or, over the next 10 years in order to maintain current dry gas production, we need to put on line the productive equivalent of 12 Canadas.
*This was the net decline in Louisiana’s production; the gross decline from existing wells from 2012 to 2013 would be even higher.
Plantagenet on Wed, 19th Nov 2014 10:06 am
There is also quite a bit of oil in the Utica.
Northwest Resident on Wed, 19th Nov 2014 10:24 am
“…over the next 10 years in order to maintain current dry gas production, we need to put on line the productive equivalent of 12 Canadas…”
No problem. QE4, QE5, QE6 and maybe QE7 should be able to push sufficient trillion$ in new debt into the junk bonds needed to finance all that. Entire forests will fall. Mountains will be bulldozed to ground level. Lakes and rivers will be sucked dry and replaced with frack water storage. Pesky wildlife will be dealt with severely. Trains will explode. People will die. But hey, we’ll still have plenty of NG to burn, thank goodness.
Davy on Wed, 19th Nov 2014 10:27 am
Marm, all energy is in a bumpy descent along with the economy from a doom systematic point of view. Coal that is economic to mine is far less than the reserves spoken about. We know gas and oil are under pressure in multiple areas from supply to demand. A declining economy will compress renewables along with lower energy prices. How bumpy this descent will be is debatable with much depending on the economy. Doom says the bumpy plateau is history and we have entered the twilight zone of descent.
Corn porn point of view says everything is peachy. Marm am I to believe you have no issues with the economy? It is apparent energy is not an issue with you. Is there anything that worries you marm? If not please tell me where I can find that drug you and NOo are using. I am completely clean 8 years now but that drug sounds too good to be true.
BTW your $100BIL investment is a great idea.
marmico on Wed, 19th Nov 2014 10:51 am
US dry gas production was 70 BCF/day in July, 2013 and 70 BCF/day in July, 2014.
BS. July 2014 production was 3.7% higher year over year.
2014 will be the 12th consecutive year that Saudi Arabia net exports of petroleum liquids were higher than 7.1 mb/d in 2002.. 🙂
Northwest Resident on Wed, 19th Nov 2014 10:58 am
More and more oil being produced. More and more NG being produced. More and more trillion$ in debt being created. The stock market is constantly soaring to ever greater heights with assets inflating to their breaking point and beyond. The rich keep getting richer, the poor keep getting poorer.
Everything is just peachy. What could possibly go wrong?
marmico on Wed, 19th Nov 2014 11:06 am
Marm am I to believe you have no issues with the economy?
Of course there are always issues; you ought to have experienced the ebbs and flows with your family business before you selected doomsteading.
Davy on Wed, 19th Nov 2014 11:15 am
Marm, just a warning for you cause I like your cavalier corn porn happiness. Corns don’t last long here or they convert. NOo is an exception but he is getting more and more neurotic or erotic. Erotic when he talks about Marcie and neurotic when he out of the blue he posts frack anwar.
Marm, maybe you should move on over to Forbes while you still have your sanity. If you are ready to embrace doom I am here for you as a sponsor. We can start with the 5 steps of denial and work towards delusional thinking.
Northwest Resident on Wed, 19th Nov 2014 11:28 am
Davy — If marmico or nony opt to sign up for your 5-step rehabilitation program, I volunteer to stand by with the high voltage cattle prod — you know, to provide quick jolts of negative reinforcement as needed.
Marm: The economy is doing just fine.
ZAP!
Nony: NG futures are looking great.
ZAP!
Marm: Oil and NG production is higher today than ever before
ZAP! ZAP!
Nony: The Marcellus is MIGHTY!
ZAP! ZAP! ZAP! ZAP! ZAP! ZAP! ZAP! ZAP! ZAP! ZAP! ZAP! ZAP!
westexas on Wed, 19th Nov 2014 11:33 am
Marmico,
For once, you are correct about numbers. Either the EIA made some revisions, or I made a mistake (probably the latter), but you are correct about current data.
In any case, as noted above, the Louisiana data provide pretty strong support for Citi’s estimate that the underlying decline rate from existing US natural gas production is about 24%/year.
marmico on Wed, 19th Nov 2014 11:37 am
For once, you are correct about numbers
Touche. Based on the weeklies, November 2014 is up 7% year on year.
Now back to the 12 consecutive cherry picking KSA years. 🙂
westexas on Wed, 19th Nov 2014 11:38 am
Regarding Saudi Arabia:
As annual Brent crude oil prices rose from $25 in 2002 to $55 in 2005, Saudi net oil exports rose from 7.1 mbpd in 2002 to 9.1 mbpd in 2005.
As annual Brent crude oil prices rose from $55 in 2005 to the $110 range for 2011 to 2013 inclusive, Saudi net oil exports have been below their 2005 annual rate for eight straight years.
But I’m sure that current net exports are higher than 2002, and higher than 1952, but that’s not relevant to the question of why Saudi net exports showed some a massive divergence in their responses to two oil price doublings, 2002 to 2005 and 2005 to 2011-2013.
marmico on Wed, 19th Nov 2014 11:55 am
Corns don’t last long here or they convert.
Forbes, do you read Amory Lovins? Now that is corn porn happiness!
rockman on Wed, 19th Nov 2014 11:56 am
Actually according to the latest EIA numbers Marm is not correct:”July 2014 production was 3.7% higher year over year.”
July 2013: 2,212,432 million cf
July 2014: 2,308,222 million cf
That’s a y-o-y increase of 4.33%. Marm and I may have different expectations of the future but facts are facts.
marmico on Wed, 19th Nov 2014 12:54 pm
Rocky, I don’t have any problem playing arithmetic with a dickhead like you.
July’13: 2,095,556
July’14: 2,172,486
2,172,486 minus 2,172,486 equals 76930 divided by 2,095,556
76930 equals 3.67, rounded to 3.7.
Please STFU! Wednesdays must be mud bath days. 🙂
Arithmetic is arithmetic and you failed just like the Austin “Walter Mitty” Chalk. The numbers will be revised but not in Brown’s favor.
mike on Wed, 19th Nov 2014 1:33 pm
2,172,486 minus 2,172,486 equals 76930 – Marmico
Oh. In which universe in the multiverse does that arithmetic system operate? In this universe, the result would be zero. I worked that out without use of a caculator.
I do feel the term “dickhead” might more reasonably be applied to one who calculates that a number minus itself would amount to 76930, and that such a person needs to “STFU”. Are you familiar with the British English term “Wanker”?
Davy on Wed, 19th Nov 2014 1:39 pm
Marm, that was a wowser dude or as they say in old England per mike a wanker.
I told you what happens to corns that hang with dooms on PO. They get flustered and bothered.
marmico on Wed, 19th Nov 2014 1:50 pm
You are right, mike. It’s my typo error. It should say “2,172,486 minus 2,095,556 equals 76,930″. Now let’s all bow down to an effing driller named Walter Rocky Mitty who can’t link nuttin’.
The point is that mud bath boy came to the rescue of the west texas boy and wanted to argue whether it was 3.7% or 4.3%. It’s just business LOL.
Northwest Resident on Wed, 19th Nov 2014 1:54 pm
No doubt, when marmico looks in the mirror he sees a studly dude, intelligent beyond description, well-versed in all statistics related to peak oil concepts, a virtual walking calculator, a friggin’ genius whose pomposity and grandiose behaviors can only be expected when he descends from the clouds to pontificate on the issues of the day to lesser beings.
Everybody else sees a dickhead.
marmico on Wed, 19th Nov 2014 2:15 pm
You doomers want to argue whether U.S. dry gas production is up 3.7% or 4.3% and why your electrical and heating bills are lower than they would have been as a counterfactual to the frack revolution. Go hang with the Turdberg.
Davy on Wed, 19th Nov 2014 3:17 pm
Marm, actually and honestly I am hoping this gas situation stabilizes the overall energy situation. We have to have some optimism to balance all the other negatives. On a selfish note my family is going to sell a turd bucket of equipment if all these pipelines go through.
marmico on Wed, 19th Nov 2014 3:35 pm
Davy-boy, U.S. energy costs as a percent of national income have been ebbing and flowing between 6% and 9% for the last 40 years. I guesstimate it is ~7% today.
Does your family business have a CAT/Deere/Kubota dealership(s)? If so, sweet.
Nony on Wed, 19th Nov 2014 3:43 pm
Berman and that lady (can’t remember name) have been talking about shale gas being overblown since 2009! And saying that the Marcellus would not amount to much because the Haynesville wells have high decline, high pressure, deep drill cost etc. Well, even leaving aside the stupidity of judging the Marcellus off of 18 months of Haynesville data, they have just been WRONG.
The Marcellus has exploded since 2009. It’s up over 16 BDF/day now! Shale gas overall is over half of the nations production now. And OVERALL national production has grown year over year every year. And prices are DOWN from the high points of 2008ish and have hung in the ~4 range and show futures markets having that for the next 20 years!
That PSU geology prof was right and Berman was WRONG.
And even Rock blathered about how we need $8-10/mcf to drill for gas (from back in 2010 at TOD). Well, HE needed those prices. But the Marcellus sure didn’t. In fact, it has grown production and pushed others (like him) OUT of the market. And it’s selling for $2.50 in PA/OH and still growing. Just imaging how its production would explode if pipeline bottlenecks were removed and it could get Henry Hub pricing!
Nony on Wed, 19th Nov 2014 3:45 pm
BCF not BDF. [pre-emptive for the nitpickers who want to distract to side issues and not address how the gas cliff peak gassers got their BUTTS STOMPED by shale gas revolution.]
Nony on Wed, 19th Nov 2014 3:50 pm
http://www.eia.gov/petroleum/drilling/pdf/marcellus.pdf
Look at that, productivity per rig is UP. That ain’t “running out of sweet spot, drilling crappy prospects”. That sure as heck MIGHT be learning how to do it better (and look at all the doomers who scoffed when cornies said we were in the first innings and would get BETTER with time).
Oh…and despite rigs being down to 90 from the peaks of 150, we keep growing production by 3BCF/day per year EVERY YEAR for the last 3.
That is just massive!!!!
marmico on Wed, 19th Nov 2014 4:08 pm
but that’s not relevant to the question of why Saudi net exports showed some a massive divergence in their responses to two oil price doublings
That’s why you are westexas and not KSA.
Let me repeat: 2014 will be the 12th consecutive year that Saudi Arabia net exports of petroleum liquids were higher than 7.1 mb/d in 2002.. 🙂
Now since you posited your original zig zag model, most analysts went “who gives a crap”. Then you thought that you would hang a 2 standard deviation cone around the zig zag. Your model is still worthless.
Financier43 on Wed, 19th Nov 2014 4:14 pm
Why argue about a small difference in the percentage increase in NG production? Either increase if correct is a pittance relative to the amount of money, publicity, expectations, etc., thrown into the fracking frenzy during the last several years. The fact that we are not awash in natural gas lends credence to West Texas’ point that the depletion rate is alarming.
Davy on Wed, 19th Nov 2014 4:21 pm
Marm, can’t say yes or no on the dealership to remain anonymous but you are a good detective.
Northwest Resident on Wed, 19th Nov 2014 4:24 pm
“The Marcellus has exploded since 2009.”
Nony, it took a major coordinated effort between the FED, the banks, the financial investment pitch men and certain oil industry producers to crank up a major GRUNT and squeeze that Marcellus “explosion” out.
What’s global debt up to these days? Around $200 trillion. No problem?
Congratulations guys, you did it. Now, can you sustain it long term? Good question, and the answer is “no”.
Put your faith in Alan Greenspan who recently said in the WSJ: “The only way to fix this bubble (economy) is to bring it down.” He’s trying to tell you something without coming right out and saying it.
marmico on Wed, 19th Nov 2014 4:43 pm
but you are a good detective
Discretion is the better part of valor. So are you gonna go and cut another piece of sod to shore up the roof of the cabin?
Don’t, Rocky says it’s 4.3%. No need to do so.
I say it’s 3.7% in the Ozarks this winter and you better get your butt in gear cuz there is less gas.
Davy on Wed, 19th Nov 2014 5:02 pm
Marm, here is the doomstead specs:
http://www.oakloghome.com/loghomeplans/logcabins2go.aspx
Nony on Wed, 19th Nov 2014 6:18 pm
NWR: peakers predicted “gas cliff”. Predicted “peak gas”. And that includes your weird Malthusian patron saint Hubbert. And Rock is totally off on saying that guy had caveats on his prediction. He SCREWED UP by not accounting for the effects of ingenuity, price, technology, etc.
Read this article. Peak gas has been boot stomped. It’s not even like oil with rising production at the cost of high prices (Rock’s POD). It’s rising volume at LOW prices.
http://en.wikipedia.org/wiki/Peak_gas
Go, go, go gas. Go America.
Nony on Wed, 19th Nov 2014 6:34 pm
“Parts of this article (those related to gas production having already peaked and being in short supply) are outdated. Please update this article to reflect recent events or newly available information. (January 2012)”
https://www.youtube.com/watch?v=zrS4yJt3rho
GregT on Wed, 19th Nov 2014 8:58 pm
For our resident cornies, oil and gas are both finite resources. The faster we exploit them, the faster they will run out, and the more damage we will do to the planet in the process.
Fools, especially you Nony.
Boat on Thu, 20th Nov 2014 6:50 am
Nat gas is kicking butt and will continue to do so. CHP tech utilizes much of it at 90% efficiency. The US is investing and has invested a lot of money driving homes and business to become more efficient. These are not signs of collapse but a thriving country.
Davy on Thu, 20th Nov 2014 7:05 am
OK, Boat, I feel better now thanks. Should I put all my money in the market now? Should I have faith that the Fed will have my back?