Peak Oil is You

Donate Bitcoins ;-) or Paypal :-)
Page added on March 31, 2015
Revisiting the Shale Oil Hype: Technology versus Geology

The press has been all abuzz the past few weeks speculating on what the drop in oil prices will mean for U.S. shale oil (tight oil) production. Pundits have been falling over themselves quoting various estimates of the breakeven cost of production in this play or that, and rushing to be the first to declare a peak in the Bakken, Eagle Ford, Niobrara or wherever. The Baker-Hughes rig count, which comes out every Friday, has become a must-read for people who probably had never heard of it a few months ago. Even the U.S. Energy Information Administration (EIA), based on estimates, suggests production is declining in three big shale oil plays.
The industry, on the other hand, has been more circumspect. They point to productivity gains being made in drilling and completion technology that lower costs, and suggest they are developing a backlog (aka “fracklog”) of wells that have been drilled but not completed, hanging in abeyance for the inevitable oil price rise (half or more of the cost of completing a well is the fracking). Keeping a stiff upper lip in the face of harsh pricing realities, many companies are telling investors that despite slashing capital expenditures on drilling and exploration (in some cases by more than 40%), production will be maintained and even rise. Others, such as Whiting, are putting themselves up for sale or, in the case of Quicksilver, declaring bankruptcy.
In my Drilling Deeper report published last October I stuck my neck out and made projections of future production by play based on drilling rates and well quality, not price, although price and drilling rates are closely linked. This was based on an analysis of all well production data by play which showed:
- Shale oil plays like the Bakken and Eagle Ford have field declines of 38-45% per year without new drilling. The Bakken requires some 1,700 new wells per year to maintain current production and the Eagle Ford about 2,800.
- Shale plays are not uniform in terms of reservoir quality and well productivity. Inevitably industry drills its best locations first. Geology will always trump technology in the long term and well quality will decline as plays mature.
- There are a finite number of places to drill, and although spacing wells too close together may increase short term production rates, it will not result in a higher recovery of the resource in the long term due to well interference. Well interference will not generally become evident until 12-24 months have elapsed, and is now indicated in top counties of the Bakken and Eagle Ford plays.
Given this, it is a no-brainer that production is going to fall if drilling rates decline as much as inferred from the 40+% fall in rig count since October. The “Most Likely” drilling rates at the time my report was published suggested most major plays would peak before 2018. What the actual production profile at peak will look like is a matter of speculation as production data now being published by the EIA for April won’t actually be known until June or later (yes, the EIA publishes production data before that production actually takes place; see my post from last year about the practice). Of the three projections I published for each shale play, the lowest one is best suited to the current pricing environment.
Mitigating this are the assertions of the industry, noted above, that costs are dropping, wells are more productive, and rigs are more efficient. Ed Crooks at the Financial Times tells us:
“EIA data show remarkable improvements in productivity, with production per rig from new wells rising in the past year by 24 per cent in the Eagle Ford, 29 per cent in the Bakken and 30 per cent in the Permian basin.”
Notwithstanding the fact that it is wells that produce oil, not rigs, these assertions of productivity improvements bear closer examination.
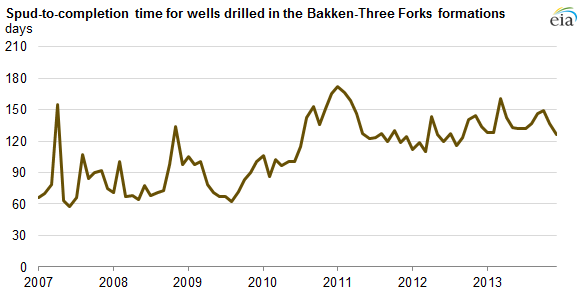
First, regarding rig productivity, the EIA points out that spud-to-completion times have actually increased to 120 days or more in the Bakken (Figure 1), a roughly 50% rise from four years ago. So even if it takes a few less days to drill a well, by the time it is fracked and tied into a pipeline the elapsed time has actually been getting longer. The so-called “fracklog”, which in the Bakken is estimated at 800-1000 wells, will likely increase spud-to-completion times (and cost) when the oil price rises enough to justify finishing the wells as there will be considerable competition for fracking crews.
The allegations of vastly improving well productivity due to technology innovations in shale oil plays such as the Bakken and Eagle Ford are examined below using the latest well production data.
Bakken Play
Figure 2 shows all wells in the Bakken Play by the month and year they were drilled. Each well is represented by four separate dots, indicating average daily production over its highest month (red), first 6 months (yellow), first 12 months (green), and first 24 months (blue). The lines indicate average daily production for all wells at these same points in time of well life (polynomial best-fit trend lines). This figure indicates that:
- Although there are a few very good wells with peak month production of over 1000 barrels per day, the average is about 500 barrels per day and is trending down, despite the application of ever-better technology.
- There is no observable increase in productivity in 2014 as widely reported. In fact, well productivity as defined by highest-month production peaked in mid-2014 and is declining.
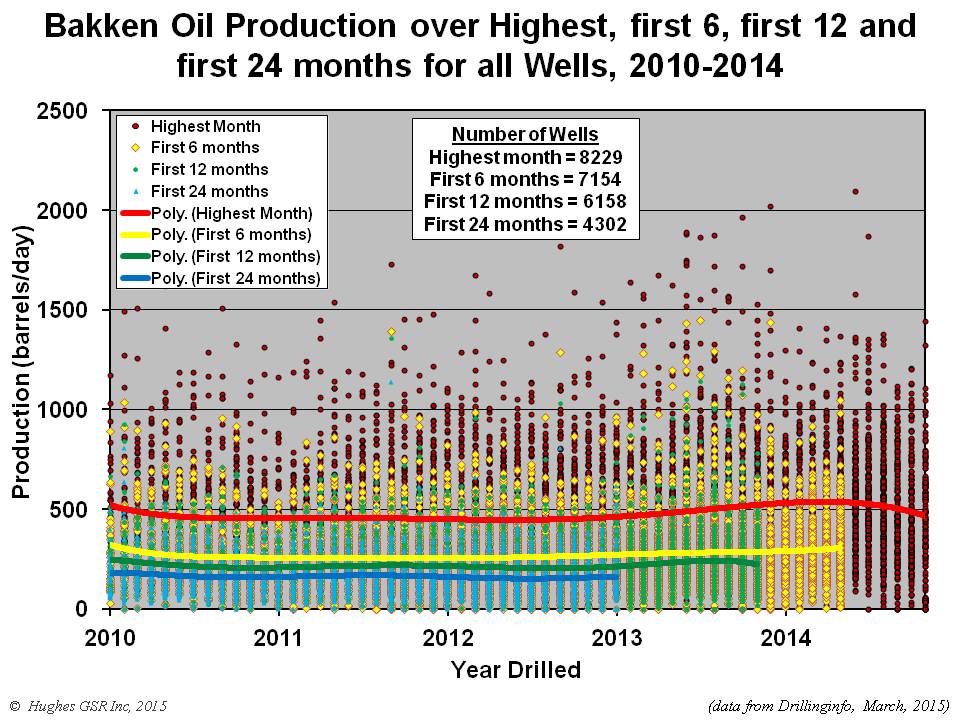
Figure 2 – Average daily production for all wells drilled in the Bakken Play between 2010 and November 2014. Dots indicate production over each well’s highest month (red), first 6 months (yellow), first 12 months (green), and first 24 months (blue). Lines indicate average daily production for all wells at these same points in time of well life (polynomial best-fit trend lines).
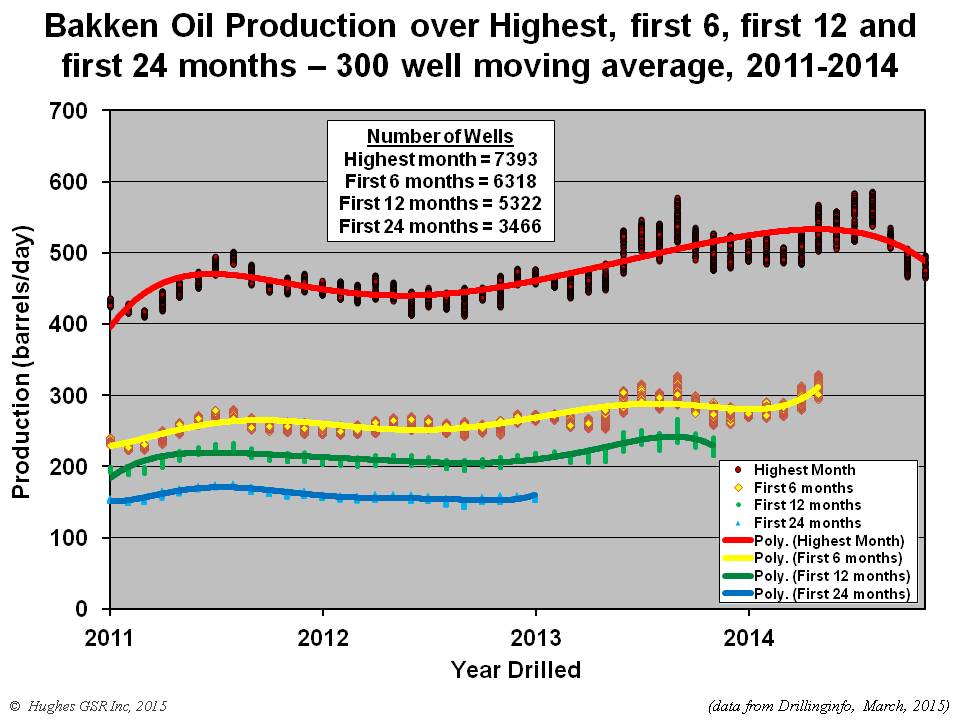
Figure 3 accentuates trends in well productivity in the Bakken by fitting a moving average to the data. This figure indicates that:
- Significant improvements in well productivity were attained between mid-2012 and late-2013. This is a testament to both better technology and focussing on sweet spots.
- Productivity has stagnated since late-2013 and has fallen sharply in the last half of 2014.
- Highest month productivity is a key indicator of productivity over the longer term, as it is reflected in 6 month-, 12 month- and 24 month-average production.
- Production over the first 24 months peaked in mid-2011.
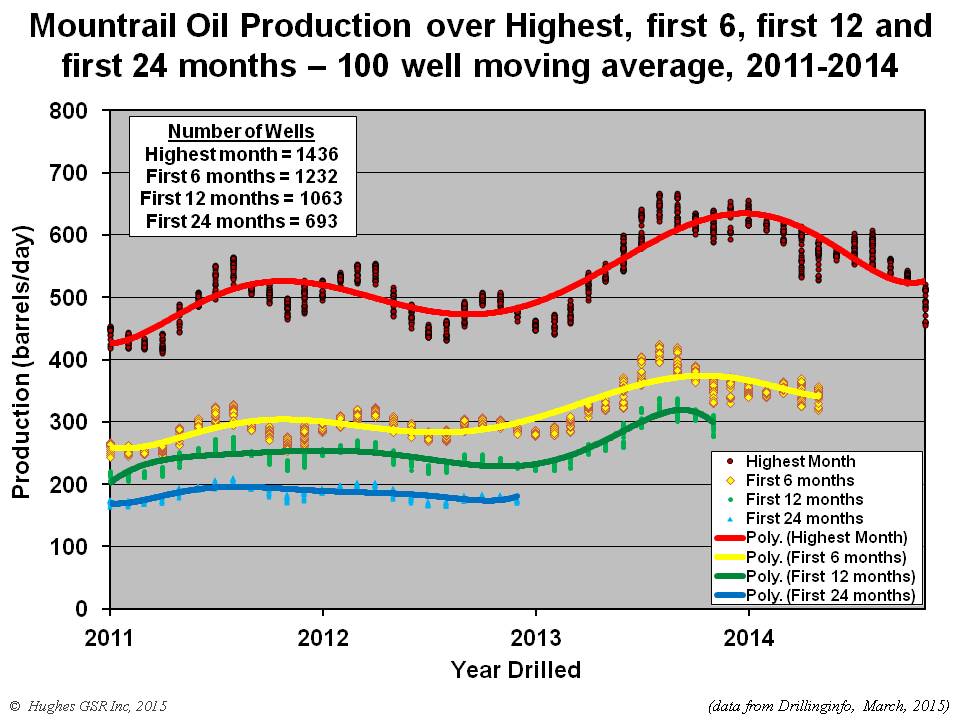
A key question covered in company investor presentations in the Bakken regards well downspacing: how close can wells be spaced and still increase total oil recovery? The Bakken is far from uniform in terms of well quality (see Figure 2-10 in Drilling Deeper), and four of 15 counties have produced 80% of the oil. Mountrail County has been the top producer so far, accounting for the largest share of cumulative production. Figure 4 illustrates average well production in Mountrail County over various periods. This figure indicates that:
- After a steep ramp up in highest month well productivity in 2013 productivity peaked and has now declined by nearly 20%.
- The fall off in well productivity is likely due to the density of current drilling, resulting in early signs of well interference, and to drilling more marginal parts of the county.
- Despite the hype by industry and drilling equipment purveyors, geology is already trumping technology in Mountrail County, which was the best of the best in terms of sweet spots in the Bakken Play. Well density in the prospective part of Mountrail County was 1.71 wells per square mile in mid-2014 (see Table 2-1 in Drilling Deeper) and well interference is already becoming apparent (I had assumed the entire Bakken could be drilled to 3 wells per square mile for my projections in Drilling Deeper, so I may have been a bit too optimistic).
- The assertions of increasing productivity are not true in this most productive and intensely drilled portion of the play – in fact productivity is declining. The happy talk is just that, and shouldn’t be relied on in terms of projecting the future of Bakken production.
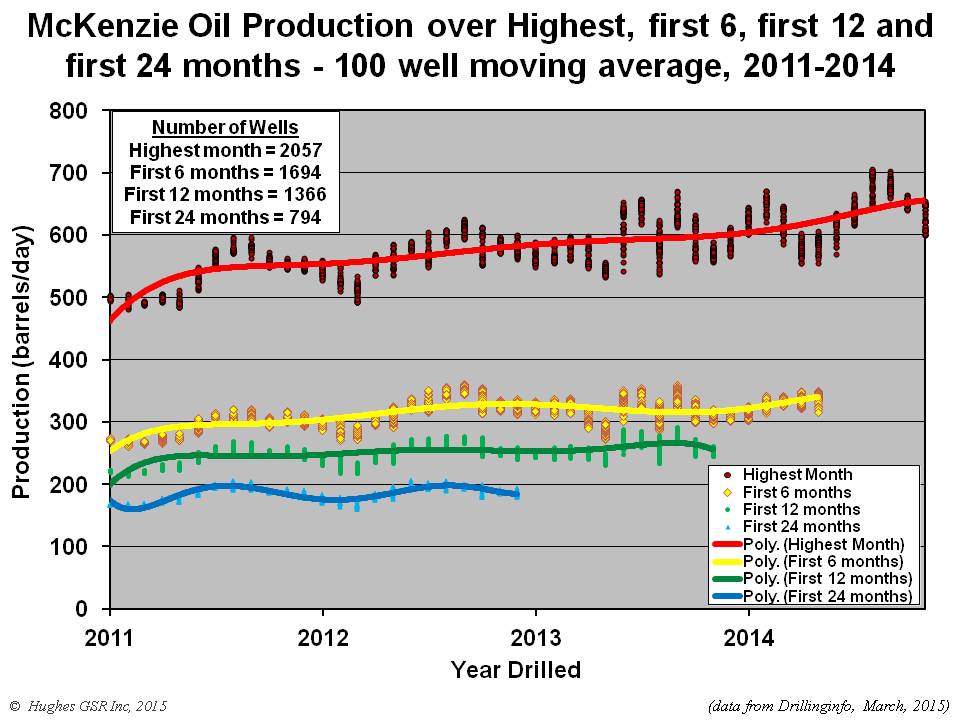
McKenzie County has recovered the second largest amount of oil in the Bakken Play and has the largest prospective area of any county. It is the only county exhibiting an upward trend in well productivity as illustrated in Figure 5. This figure illustrates that:
- Well productivity in terms of the highest month has increased significantly over the 2011-2014 period, but assertions that there has been a 29% increase in the past year are unfounded.
- Recent highest month well productivity has been declining and production over the first 6-, first 12- and first 24-months have been essentially flat since mid-2012, again belying assertions of substantial increases.
- In mid-2014 McKenzie County’s prospective area had only been drilled to 1 well per square mile so it is in an earlier phase of development than Mountrail County, but will certainly encounter the same downward spiral in well productivity through interference and drilling lesser quality locations as drilling density increases.
Bakken production is on track to follow the low drilling rate projection outlined in Drilling Deeper, although if drilling rates are reduced substantially below the minimum rates assumed in Drilling Deeper they will result in steeper declines initially and lesser declines later on.
Eagle Ford Play
Although there are nearly 12,000 producing wells in the Eagle Ford Play, analysis is complicated by the fact that the State of Texas reports production from multi-well leases as a single value. Hence only data from individual wells and one-well leases can be used for comparative analysis which, unfortunately, eliminates 40% of the producing wells in the play. Figure 6 illustrates the average production of all applicable wells in the Eagle Ford play over the highest month, and the first 6-, first 12- and first 24-months of well life. This is on a “barrels of oil equivalent” basis counting gas production as its energy equivalent to oil, given that the gas is a very important component of Eagle Ford production (as well as being the top producer of tight oil, the Eagle Ford is also the nation’s third largest shale gas field). This figure indicates that:
- Although there are a few very good wells with peak month production of over 1500 barrels per day, the average is about 800 barrels per day and is trending down, despite the application of ever-better technology.
- There is no increase in well productivity in 2014 of the magnitude alleged by the EIA. In fact, well productivity as defined by highest month production peaked in mid-2014 and is declining.
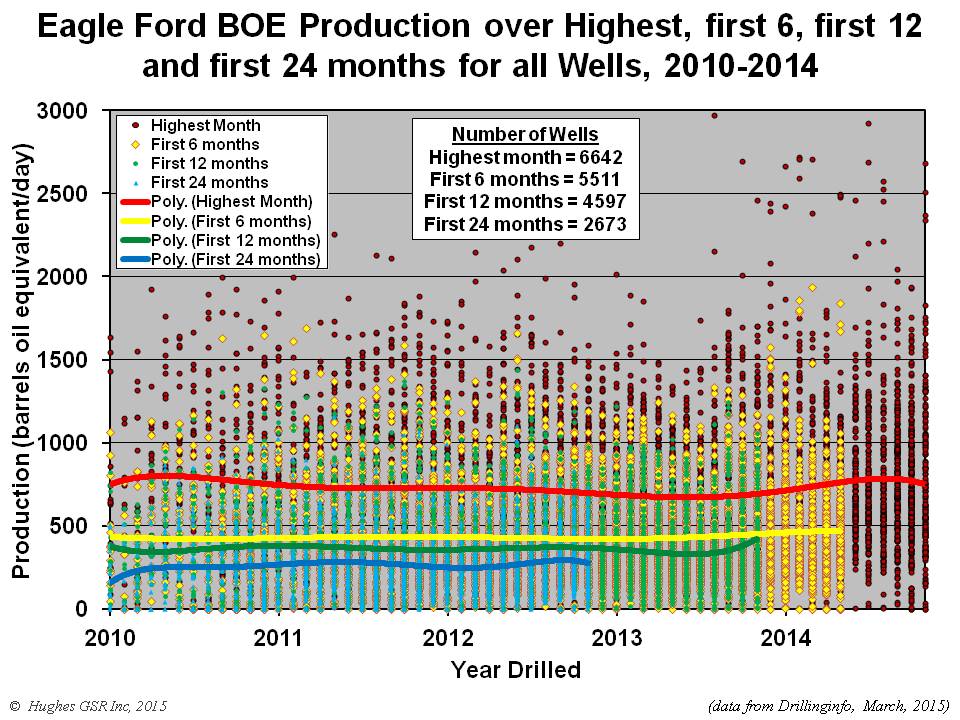
Figure 6 – Average daily production for all wells drilled in the Eagle Ford Play between 2010 and November 2014. Gas has been converted to oil on an energy equivalent basis (6000 cubic feet of gas equals one barrel of oil). Dots indicate production over each well’s highest month (red), first 6 months (yellow), first 12 months (green), and first 24 months (blue). Lines indicate average daily production for all wells at these same points in time of well life (polynomial best-fit trend lines).
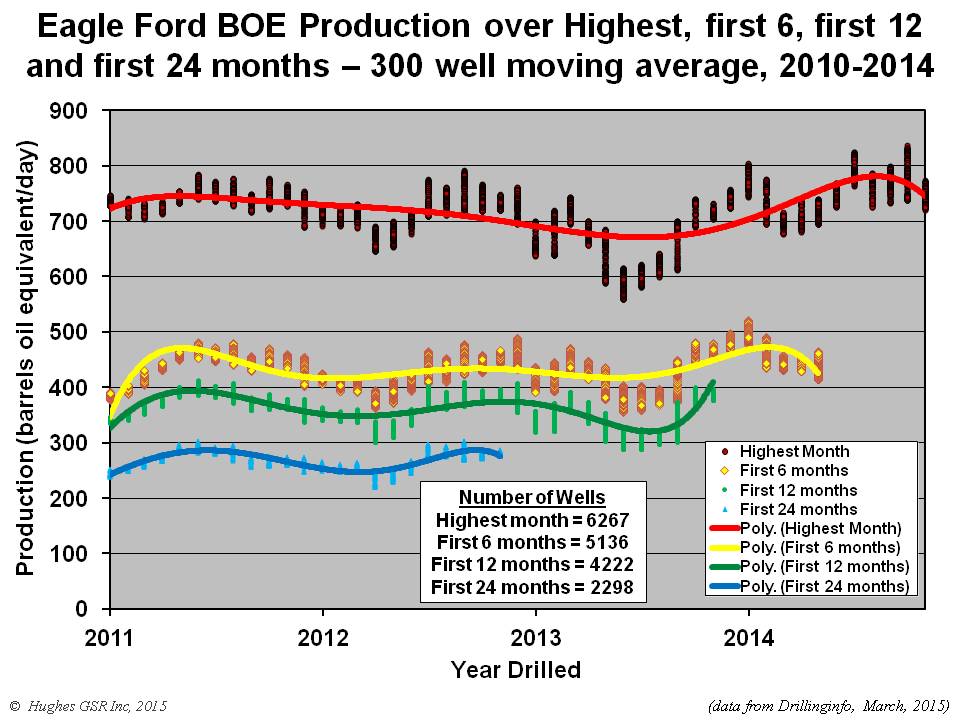
Figure 7 accentuates trends in well productivity in the Eagle Ford by fitting a moving average to the data. This figure indicates that:
- Significant improvements in well productivity were attained between mid-2013 and mid-2014. This is a testament to both better technology and focusing on sweet spots.
- Peak month productivity has stagnated since mid-2014 and is now falling.
- Highest month productivity is a key indicator of productivity over the longer term, as it is reflected in 6 month-, 12 month- and 24 month-average production.
- Productivity over the first12- and first 24-months has stagnated since mid-2011. Productivity over the first 6 months has increased slightly through early 2014 but is now falling.
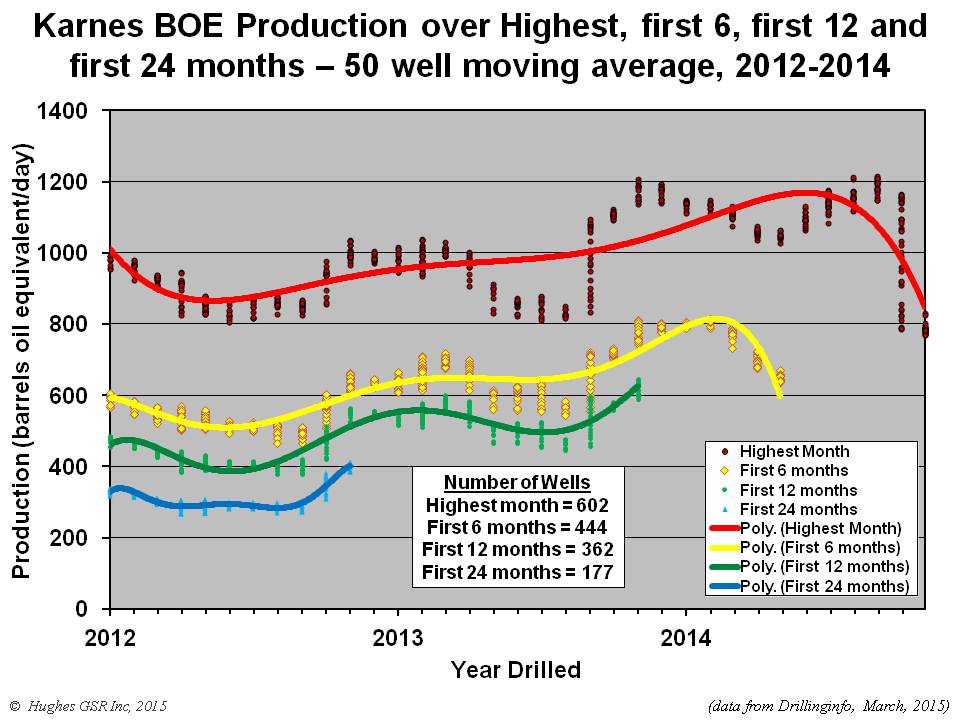
As in the Bakken, a key tenant of company investor presentations in the Eagle Ford is downspacing – how close can wells be spaced and still increase total oil recovery. The Eagle Ford is far from uniform in terms of well quality (see Figure 2-29 in Drilling Deeper), and six of 28 counties have produced 80% of the oil. Karnes County has been the top producer so far, accounting for the largest share of cumulative production. Figure 8 illustrates average well production in Karnes County over various periods. This figure indicates that:
- After a steep ramp up in peak month well productivity in 2013, productivity was essentially flat through mid-2014 and has declined 30% in recent months.
- Decline in first 6 month productivity is even steeper than peak month for the same wells. The fall off in well productivity is likely due to the density of current drilling, resulting in well interference, and to drilling more marginal parts of the county.
- Despite the hype by industry and drilling equipment purveyors, geology is already trumping technology in Karnes County, which has to date produced the most oil in the Eagle Ford Play. Well density in the prospective part of Karnes County was 2.76 wells per square mile in mid-2014 (see Table 2-2 in Drilling Deeper) and well interference is already becoming apparent (I had assumed the entire Eagle Ford could be drilled to 6 wells per square mile for my projections in Drilling Deeper, so I may have been a bit too optimistic).
- The assertions of increasing productivity are not true in this most productive and intensely drilled portion of the play – in fact productivity is declining. The happy talk is just that, and shouldn’t be relied on in terms of projecting the future of Eagle Ford production.
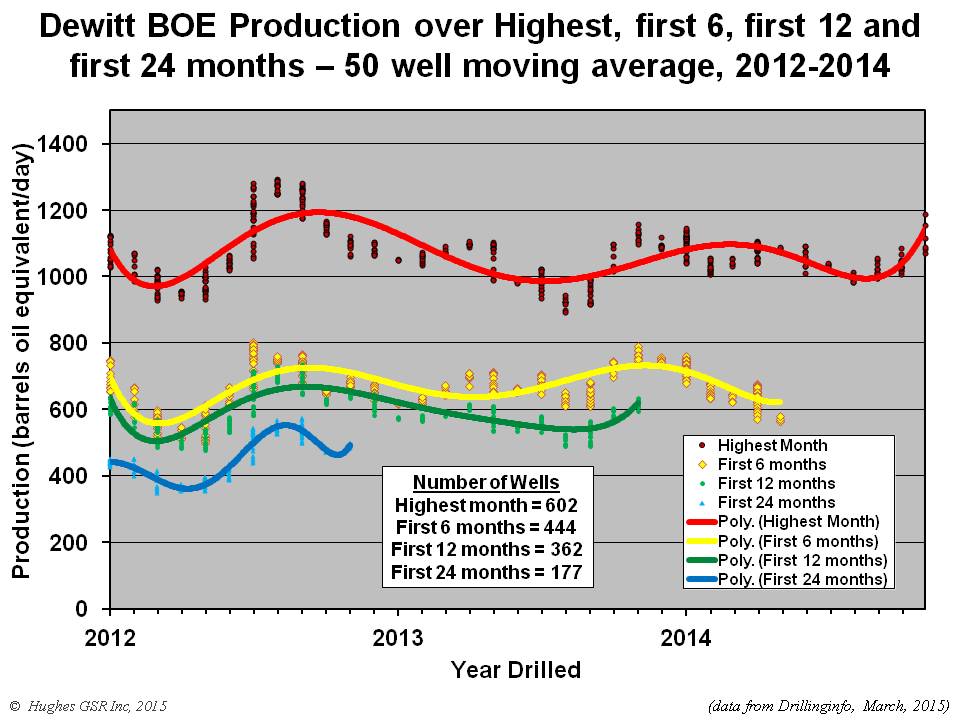
The Eagle Ford is larger than the Bakken, both in terms of overall areal extent and in the size of the core area. As well as Karnes County, Dewitt, Lasalle, Dimmit, Gonzales and McMullen counties have also been prolific producers. An example of well productivity trends for Dewitt County is illustrated in Figure 9. This figure illustrates that:
- Well productivity in terms of the highest month peaked in mid-2012 and has been relatively flat since late-2013. There is no indication of a significant ramp up in productivity over the past year as widely reported.
- Well productivity over the first 6 months has been declining since late 2013, even though highest month productivity has been relatively flat over the same period, suggesting potential early signs of well interference. Well productivity over the first 12- and first 24-months peaked in mid-2012.
- Dewitt County has been drilled to just over 3 wells per square mile. Counties such as Lasalle, Dimmit, Gonzales and McMullen have been drilled at between 1.36-2.18 wells per square mile so are in earlier phases of development than Karnes or Dewitt counties.
Some 30,000 wells remain to be drilled in the Eagle Ford before it is fully saturated. The trends in well productivity so far suggest that the best days are right now, and may already be behind us in top counties like Karnes. There has been no technology “big win”, as widely believed, and well productivity will decline as the best areas become saturated and drilling moves into lower quality rock. The recent decline in rig count suggests drilling rates may fall below the “low” projection in Drilling Deeper, resulting in an earlier peak followed by a longer plateau and slower ultimate production decline for the play as a whole.
Summary and Implications
Central points from this analysis include:
- Irrespective of price, geology is trumping technology in the Bakken and Eagle Ford plays.
- The widely reported ramp up in well productivity in the Bakken and Eagle Ford plays over the past year due to technology improvements does not exist when examined at the play- and county-level . Although some operators may have experienced productivity increases depending on the location and quality of their leases (eg. Whiting in Mountrail County of the Bakken), others have experienced correspondingly greater than average decreases.
- Well productivity in the top-producing counties of both the Bakken and Eagle Ford is declining, despite the application of the best technology. This is due both to saturation of the best parts of these counties with wells and resultant movement to lesser quality areas, and potentially to well interference as densely spaced wells cannibalize each other’s production.
- The decline in well productivity in top counties is particularly disturbing given the incentive for operators to move drilling into core areas to maximize economics given the drop in oil price.
- The widely speculated decline in shale oil production due to the fall in rig counts will not become fully evident in actual production data for a few months, due to the typical 2-4 month lag in data release, along with inevitable revisions.
- The drop in rig count will certainly affect near term production but will not significantly change the amount of oil that can ultimately be recovered from these plays. In fact it will save oil for later, reducing the post-peak rate of production decline.
- The industry’s propensity to drill its best locations first means that prices will have to go much higher to recover the last of the oil from these plays.
- Projections in Drilling Deeper may be a bit too optimistic in the short term given the decline in rig count and associated drilling rate but are on track for the longer term.
43 Comments on "Revisiting the Shale Oil Hype: Technology versus Geology"
Plantagenet on Tue, 31st Mar 2015 3:53 pm
This piece was written by Dr. David Hughes. He makes some excellent points. It is ironic that the long-predicted drop in oil production from the Bakken will be due to the oil glu and low oil pricest resulting from successful oil production from the Bakken.
rockman on Tue, 31st Mar 2015 3:54 pm
“Shale oil plays like the Bakken and Eagle Ford have field declines of 38-45% per year without new drilling. The Bakken requires some 1,700 new wells per year to maintain current production and the Eagle Ford about 2,800.”
Based upon what I consider a conservative estimate one rig would drill about 10 wells per year. Conservative since drill times have been reduced to 30 per well days and in many cases less than 20 days. And some operators are reporting spud to move out of 12 days. And pad drilling will reduce the time even more since moving to a new location may take 2 days instead of the typical 7+ days. The horizontal rig count has dropped 400 since 2014 according to Baker Hughes.
So if their estimate of 4,500 new wells to keep production from falling I s correct and the rig count drops no further (the rate decline has decreased but the rig count is still declining) we may see shale production peak by this summer/fall. As far as companies delaying frac’ng I’ve done a short and very incomplete poll: I haven’t talked to one EFS operator that’s planning to delay frac’ng their wells. It may still take some time for the frac crews to show up because even though the drilling activity has decreased the frac companies are mothballing equipment and laying off hands. And while production has still increased recently everyone should understand that this new production is lagged and is coming from wells drilled many months ago.
But even if there are a significant number of wells having their fracs delayed that would mimic the effect of the rig count dropping sooner than it actually did: a well drilled and not frac will have the same immediate effect on production as if it were never drilled.
Nony on Tue, 31st Mar 2015 4:37 pm
There are plenty of public announcements by companies as well as stories by expert reporters on the fracklog as well as the backlog ITSELF. That means more than Rockman’s strawpoll. Note: companies are not drilling a well for the purpose of having it sit. But where they already have contracted rigs, but not contracted completion, they are excersiding their options to wait. This is both because of the futures curve contango as well as declining service company prices.
Nony on Tue, 31st Mar 2015 4:41 pm
Hughes’s comments are not statistically backed up by his charts. He emphasizes the very tail of his curves rather than comparing the last year to previous year. Sort of a climate denier tactic. What has happened so far has been technology and geology about keeping pace in the race…with very slight increases over time.
And of course while total production will go down in a low price environment, we can expect per well paramaters to get better (for obvious reasons). Hughes doesn’t even seem to realize that.
Beery on Tue, 31st Mar 2015 6:34 pm
Glut, gluttely glut glut.
Planty is in broken record mode again.
eugene on Tue, 31st Mar 2015 6:52 pm
The bottom line for me is these are not the wells of yesteryear. We can shout and speculate all we want, yesteryear is not going to return no matter the technology, etc. All of this reminds me of entering my abandoned, remote grandmothers house after dark. 11 yr old kid scared as hell and talking to myself to scare away my fears. I think we’re talking a lot to avoid our fears. Unlike the abandoned house, the fears are realistic.
Plantagenet on Tue, 31st Mar 2015 7:05 pm
Beery–you are acting like a climate denial nut, nutterly nut nut.
Look around you. Read a newspaper once in a while. The world is in an oil glut—why not accept reality?
tk on Tue, 31st Mar 2015 7:26 pm
Never forget:
Economists think they can print oil!
QE4ever=infinite oil
That’s what our “economy” is about!
Milton Friedman and his “Chicago School of Economics”
So, if science functions the same in all “countries”, why are there different “schools of economics”, it should be the same everywhere, too! Unless…economics is no science!
Logic, anyone?
BC on Tue, 31st Mar 2015 9:35 pm
Definition: Peak Oil and the “Red Queen Race” at the precipice of the Seneca Cliff.
We’ve fallen over the cliff and can never return, but we don’t yet realize it because of the slow rate of acceleration at which we stepped off the cliff.
rockman on Wed, 1st Apr 2015 7:12 am
As far as the “fraclog” BS goes it’s interesting that such hype doesn’t include the existence of a significant “fraclog” for years in the shale plays. At one point BHI reported that it was taking on average 8 months for frac crews to catch up with the drill rigs. Yes: there are completed wells waiting to be frac’d. And there were many wells waiting to be frac’d every month since the shale boom began.
And once more let me explain why there’s sufficient motivation for most companies, especially the pubcos, to not VOLUNTARILLY delay frac’ng a drilled well. First, an acceptable rate of return: a well might have cost $6 million to drill and case. That investment is a sunk cost and does not affect the go forward economic analysis of doing a frac job on that well. Let’s assume the frac will cost an additional $6 million. Yes: the use of many frac stages has raised the frac price tag to as much as the drilling/casing cost. So the well was estimated to develop X bbls of proven oil reserves and flow at a rate of Y bopd. The decision to drill the well was based upon those estimates and an oil price of $/bbl with a $12 million total cost. So today, when the well has been drilled and cased, the price of oil is now ½$. But guess what…the cost to put that well into production is now ½ of $12 million…the $6 million frac cost. So the go forward economic value of frac’ng an existing well is essentially the same as it was when the decision to drill it was made.
And now consider the situation from the pubco POV. Their stock value hinges greatly on increasing their PDP reserve base…Proved Developed Producing. And the key word there is PRODUCING. A drilled and unfrac’d well can’t be counted, by SEC regs, as PDP. It’s PDNP…Proved Developed Non-Producing. If fact, since he well isn’t capable of producing there’s a legal question as of whether the SEC would even allow a PDNP status. Regardless PDNP reserve values have significantly reduced book value. Additionally the SEC allows offset locations (typically 4) of PUD wells to be classified as PUD…Proved UnDeveloped. Those PUD’s obviously don’t have the full value of a single PDP well but there are 4 of them. Which is why it was typical for pubcos to jump past PUD locations and drill further offsets to develop even more PUD’s in an effort to increase their booked reserves. The SEC does not allow offset PUD reserves to be added to the books if the well isn’t frac’d and producing. A drilled but unfrac’d well is essentially an undrilled well from a practical reserve value standpoint.
Bottom line there’s a significant booked reserve incentive for pubcos, which dominate the shale plays, to frac existing wells. But there’s more incentive: cash flow. It’s well known how much debt the pubcos have taken on to finance their shale projects. In addition to covering overhead and ongoing capex demands they still need to pay on those debts. Same economic incentive: the potential revenue stream of a drilled shale well is now half of what it was a year ago. But guess what: the cost to establish that cash flow is half of what it was when the decision was made to drill. Again: that decision to establish that cash flow was based upon $/bbl and a $12 million investment. The current decision to generate cash flow would be based upon ½$/bbl and just $6 million. Essentially the same motivation that supported drilling the well in the first place.
And lastly the same point made earlier: how many wells VOLUNTARIALLY have their fracs delayed essentially reduces the status to wells not drilled. Remember the record production we’ve recently reached was based upon wells drilled AND FRAC’D. If X wells fall into that category it will reduce the number of wells the cornies had been using to predict future shale production. Like the unheard tree falling in the forest a well drilled but not frac’d is the same as a well never drilled for as long as it isn’t frac’d.
Some can try to blow smoke up our collective asses all they want. Debating it today is pointless IMHO. This isn’t like global PO where we may have to wait decades to see the reality. By this fall all will be obvious.
BTW do you notice how the Rockman tends to give long explanations of his positions while others have only a few seconds to make broad and undetailed counterpoints? It’s almost as if they don’t have much to offer to support their positions. Naa…probably just because the Rockman loves to hear himself type. LOL.
JuanP on Wed, 1st Apr 2015 10:12 am
Rock, Thanks for that lesson!
BobInget on Wed, 1st Apr 2015 11:05 am
swiped from a knowable source:
EIA Trends (and so it begins!)
On weekly basis US supplies declined by 36K barrels to 9.386m barrels, this is after being flat just last week. The YoY growth is still substantial at 14.7% growth or 1.2m barrels increase from last year. Demand seems to have re-accelerated on weekly basis hitting 19.475m barrels or 775K increase (gasoline appears to be the driver with 816K increase offset by a decline in heating fuels). Meanwhile the 4 week YoY demand growth has slowed to 19.07m (2.7% growth) or 509K barrels increase. Core petroleum demand (Gasoline, Kerosene, and Distillates) is up by 300K barrels to 14.321m barrels from 14.025m barrels last year or 2.1% increase. Refinery input is up by an additional 198K barrels this week.
http://ir.eia.gov/wpsr/overview.pdf
This report is quite bullish and does confirm few of my expectations and is running ahead of them in some cases. The decline in US production is quite meaningful after a flat reading last week, the decline took place in March while I expected the decline start in April, I expect declines to accelerate in the next few weeks. The inventory increase was also below the mega builds we experienced for the last many weeks (I was indeed one week ahead with my inventory call last week), and as more refineries come back from maintenance additions to inventories will continue to shrink. Demand year over year has moderated, but it is running ahead of the EIA expectations for 2015 (500K vs 290K expected ). Overall I believe this storage report is setting the stage for the run I have been expecting in Q2, the US will cease to pressure crude going forward (at least until WTI crosses $60).
Regards,
Nawar
BobInget on Wed, 1st Apr 2015 11:26 am
In case you’ve been living on a desert island:
Saudi Arabia is currently busy killing innocent
non combatants in Yemen and bragging about it.
US Pentagon sources are say this war on Yemen could last three years. I’m guessing
thirty unless Iran or Russia pay third parties
to destroy Saudi Arabia’s ability to export oil.
The Saudis are blockading all Yemeni ports.
Without imported grains, water, millions will starve.
If either Iran or Russia come to the aid of Yemeni indigenous population, they will be hailed as saviors.
When, (not if) the Saudi government, export
capacity, collapses there is no way US shale can make up the difference.
Nony on Wed, 1st Apr 2015 4:46 pm
Rock: I will take John Kemp, Reuters analyst, over you. Will take official earnings call discussions by CLR over you. Now don’t make me get Rockdoc to spank you again. 😉
rockman on Wed, 1st Apr 2015 9:24 pm
Nony – As I said: empty words with nothing offered to support them. I’ve seen more insightful fortune cookie observations. LOL.
Nony on Wed, 1st Apr 2015 9:35 pm
You’re s joke Rockman. I get sick of repeating all the facts to disprove you. Rockdoc has done the same and then you just don’t even face things. The funniest was when you confused MONTHLY Marcellus change with yearly change to try to determine that it had stopped growing. Stick to the mudlogger old man.
Davy on Wed, 1st Apr 2015 9:58 pm
NOo, be nice man. Rock knows his shit unlike your cheerleading.
Enno on Thu, 2nd Apr 2015 5:07 am
I much appreciate your insights Rockman.
Nony, i have seen more constructive commenting in the past from you, instead of these ad hominems.
Nony on Thu, 2nd Apr 2015 5:25 am
Go look at the CLR conference call. Go look at Kemp’s columns on the fracklog. Go look at the comments by the head of ND oil and gas government division. Go look at the backlog number itself!
Rock is full of shit and has a tendency to puff himself up and opine on shit he knows nothing about. He’s a joke. way over-rated here. Crap like misreading Marcellus numbers off of production charts, misreading gasoline usage charts, saying he’s an expert on shales from having drilled some Austin Chalk horizontals and being wrong on the matrix-flow (when Rockdoc is both an academic expert on the rocks themselves as well as a served VP at a major shale exploration company).
You’re a good dude, Enno. But I got sick of writing little fact based essays with links and all to show how full of it Rock is. He’s a joke. Take him with a big grain of salt. Probably makes sense that he hangs around a place like this with remnant peakers who can’t face up to how SCREWED UP the 2005 era peaker predictions were.
Nony on Thu, 2nd Apr 2015 5:31 am
http://business.financialpost.com/news/energy/introducing-fracklog-the-new-fangled-oil-storage-system?__lsa=6d39-22ae
Davy on Thu, 2nd Apr 2015 6:36 am
NOo, the day is coming when you won’t have much to crow about with your fracked in the head world. Your Econ 101 is already in disarray. Your quoting your future curves as if they are the future is pure casino not the science of POD. NOo, Rock may have a POV that is angled but it comes from actual industry involvement.
We don’t know what you do. I think you spend your time on the beach in California somewhere. You have some interesting ideas but they are polluted by your industry marketing IOW cheerleading. POD is slowly strangling your message. The economy is contracting despite all the rabbits the authorities claim they are pulling out of that wonderland hat.
NOo, soon you will be whining how you need to get off this site. You will go away for a month or two and maybe return but eventually you will not return a corn because your message will have become completely discredited. If you do come back it will be in conversion to reality not the BAUtopian fantasy that you live completely and unabashedly.
Enno on Thu, 2nd Apr 2015 7:00 am
Nony, still, the ad hominems are worse than a waste of time for you and anybody else.
Even though Continental R. seems to be better run than most shale companies, I also think they have some very dubious claims:
1) average EUR of over 600 k boe (more than 800k for 2015 they claim). Their average well produces less than others in fact, and seem on a path to much less than claimed, closer to 400-450 k.
2) Hamm claimed that over 85% of wells are currently not being completed. Let’s see how that turns out
3) Hamm claimed in the last years to increase production greatly by 2017. Last call: no word about these ambitions, but they surely seem to have been dropped.
If you look at their individual well claims, the picture gets much worse.
shallow sand on Thu, 2nd Apr 2015 7:42 am
I would be interested in Nony explaining how the following is wrong assuming $50 WTI, which at best puts CLR at $40 per their own 10K.
250,000 barrels gross oil in 60 months
300,000 mcf gross gas in 60 months
20% royalty
200,000 net oil
240,000 net gas
200,000 x $40 = $8,000,000
240,000 x $2.50 = 600,000
Total revenue. $8,600,000
Less:
Severance tax 473,000
LOE at $8.00. 1,600,000
G & A at $2.00. 400,000
Interest at 5%. 1,750,000
Net revenue 60m. 4,377,000
I am assuming they are able to drive well cost down to $7 million. Almost 30% reduction from 10k.
Still in a deep hole after sixty months, which is a no no.
I have been posting this stuff since September, still have had no one challenge the calculations.
I would like to know where I have made mistakes.
marmico on Thu, 2nd Apr 2015 9:20 am
What’s the residual value of the well at day 1, year 6?
Nony on Thu, 2nd Apr 2015 10:53 am
Enno:
I don’t think of CLR as night and day. When you actually take the time to read their analyst calls and think in detail, though, there is a lot of good information. and no reason for them to lie about their fracklog decisions. And it’s consistent with statements from EOG, and journalists and the backlog itself GREW (even with lowered drilling). Bottom line.
I agree the CLR EUR is a headscratcher and doesn’t seem to match their inventory.
On the inventory of drilling locations (at last summer’s prices), I don’t think this is that controversial. The peakers talking the Bakken down have had their asses kicked by the last 4 years of growth. Get that price back to $100 and their will be downspacing out the ass. 50 is a whole nother ball of wax. So is 70. If shale is the marginal barrel, if it is the on/off switch…it has to lessen to eliminate the glut and get to new equilibrium.
As far as the ad homs, I appreciate you sticking up for another poster. But I have bit my tongue so much with this pompous Rockman shtick. He’s got a lot of limitations in his understanding and you can see him make a lot of screw-ups. Rockdoc has called him out before with massive posts full of citations (and no ad hom) and the guy just ignored him.
Nony on Thu, 2nd Apr 2015 10:57 am
shallowsand, I’m not a CLR is always right defender. I haven’t done a valuation at $50 oil. In general, I have seen you underestimate their potential at $100 oil, because you overlook their drillable inventory at that level. You seem to want to value things only by flowing barrels of oil. Intuitively, that doesn’t make sense. How would you value them 6 years ago then, before they had developed the flowing barrels they have now. An investment is based on NPV and includes growth and development.
shallow sand on Thu, 2nd Apr 2015 11:38 am
M. That is a good question. Looks like the well will be producing somewhere between 30-50 bopd and 50 mcf gas, and decline will be greatly reduced, somewhere between 6-10%.
If we go with 16,000 bbl of oil sold in year six and 20,000 mcf gas in year six, plug in $50 WTI oil $2.50 Nat gas, we get $552,000 gross income to 80% NRI.
Severance is $30,360
LOE and G & A if we still assume $10 per oil barrel is $160,000.
Of course my example is too simplistic, as the WTI strip is in contango, so if you locked it for 5 years, a little more income, but not a whole lot more, because production is front loaded.
Also, LOE and G&A per barrel will not stay flat, but will go up significantly, as most of those costs are fixed and will rise per barrel as the barrels fall. It will more than cancel out the strip gain, IMO.
Third, I assume no principal pay down in the interest calculation, so interest is too high. Shale companies have not been paying down principal, but using cash flow to drill more wells and pay income taxes, since they cannot write off leasehold equipment and IDC’s in year 1. But that all evens out, so should figure in. But probably cannot borrow at 5% now either. So that should be adjusted some.
From what I can tell, oil production selling from 20-30 per flowing barrel, which is way too high, unless you think oil will go up $20 soon.
Market still valuing shale around $100,000, which is $100 WTI pricing IMO.
A lot of residual value will depend on how much down hole chemical is needed, how much water has to be hauled, and rate of down hole failures. The public companies tend to throw down hole repairs into CAPEX. If well has down hole failure and is 10,000+ deep vertical, looking at $50-$150K expense. That happens 2-3 times in year 6, no profit.
Also, I have read some shale wells on submersibles. Read a submersible failure on a 10,000+ well could run over 200K.
M. We operate high cost stuff. This is first time in 35+ years that we have seen public companies spending more per BOE than us.
Enjoy the cheap gasoline!
BTW, the refiners are killing it like they never have. Minting $$.
shallow sand on Thu, 2nd Apr 2015 11:51 am
N. The whole problem, of course, is the drillable inventory produces no income until drilled. Go ahead and show me your calculations of how those wells payout in 5 years at $50 WTI.
I tend to not place big values on un drilled acreage unless it can payout. Of course, my 5th grade math examples do not include any acreage cost, which only makes payout even less likely.
As you say, the value is the idea that $50 WTI will not last, and $100+ WTI is the long term price. As you know, I would be good with that.
My beef is the claim that these wells, on the whole, are good at $50 WTI. Citibank in particular has made some wild claims about low break evens. If you have a link to how they define break even and where they so the math, I would love to see it.
shallow sand on Thu, 2nd Apr 2015 12:01 pm
N. I think CLR long term debt is $6 billion. Flowing BOE is 200,000. Mix is 70 oil/30 gas. Enterprise value is $23 billion today, or $115,000 per flowing BOE. May make sense at $100 WTI and $7 Nat gas, Nuts at $50 WTI and $2.70 Nat gas. Especially with the high decline and inability of new wells to payout at current strip. The reason the are not completing the wells, aka frack log, is because doing so now rooms them to economic failure.
Lots of BK if WTI strip persists long term.
shallow sand on Thu, 2nd Apr 2015 12:02 pm
Dooms them, I need an edit function.
marmico on Thu, 2nd Apr 2015 12:08 pm
BTW, the refiners are killing it like they never have. Minting $$.
Ya, I have already posted on that issue today.
What I’m trying to get at is that a limited partnership, all equity, to drill a Bakken well, means that a $7 cash investment returns a cumulative $6 cash after 5 years with an unknown residual value, with a $40 Bakken-Clearbrook average well head price for all 5 years.
I was just asking what you thought the residual was and I don’t see your estimate.
shallow sand on Thu, 2nd Apr 2015 1:39 pm
I estimate residual value at $800K
shallow sand on Thu, 2nd Apr 2015 1:43 pm
This estimate includes no abandonment costs and ignores present value issues.
Nony on Thu, 2nd Apr 2015 1:53 pm
Sand: I’m sure they probably have issues at 50. Also sure they do great at 100. I have ALWAYS said that the one thing that would stop the shale-ies was low price. This was when we were at 100 and people were saying they would run out of locations or that it was smoke and mirrors AT 100.
P.s. We have had sub 7 gas prices for years now. The people saying you needed 8-10 since 2009 (like Art Berman) look really, really silly.
———
Again, you don’t value a growth option (and at 100+, CLR definitely showed growth), the way you value a set of stripper wells. A biotech may have ZERO revenue and still have value if they demonstrate clinical trials. Similarly, oil and gas properties are valued by more than the current flowing barrels. This is common sense. This is why leases even with no wells on them still transact at more than zero dollars when resold.
Nony on Thu, 2nd Apr 2015 1:56 pm
BTW, CLR issues at sustained $50 (to drill further) do nothing one way or the other to validate or invalidate the issue of the fracklog. Basically what happened is that E&P companies had wells half drilled or had enough of a penalty clause that finishing off the immediate drilling made sense and that holding off on the completion also made sense. This is not that hard to understand. It’s similar to the decision of drill/not drill at all. And obviously total drilling itself has gone down. but not to zero.
shallow sand on Thu, 2nd Apr 2015 2:23 pm
How I come up with that is assumption that LOE and maintenance capital = $35 per net barrel of oil.
Sales. $552,000
Sev tx. 30,360
LOE CAPEX. $448,000
Net. 73,640
However net should be higher due to contango
If plug in 2021 WTI, Sales bump up to $723,000. So in this example would bump up to $235,235.
So in that example, could hit break even by year 10 if we ignore pv matters.
Now I see your point M. If you do not define break even, you can drive it down pretty far.
I suggest you form a MLP and start leasing and drilling the Bakken, I am just way off here. Sarcasm.
shallow sand on Thu, 2nd Apr 2015 2:27 pm
N. I’m talking $7 gas for associated to help on Bakken, not Marcellus.
I have not reviewed Marcellus as closely, but I agree it has no US shale oil equal at present. LOE re gas is also much cheaper than a 10,000+ rod pumped oil well on a BOE basis.
shallow sand on Thu, 2nd Apr 2015 2:28 pm
I also would not compare oil with biotech, but that’s just me.
Nony on Thu, 2nd Apr 2015 2:48 pm
Shallowsand: I have worked in biotech and in oil (and chemicals, automotive, airlines, filtration, etc. etc. etc.)
if you have a business that is purely an annuity (like your stripper wells) than that is how you value it. But if you have growth potential, you need to value that also.
Now, sure at 50, things might be underwater. (I’m too lazy to check the details, but sure.) But at 100, those wells had positive returns over their lifetime. and the reason why the companies were cash flow negative was because they were investing and growing. that’s just business.
shallow sand on Thu, 2nd Apr 2015 3:23 pm
I understand N. $100 would cure a lot of the problems for US shale oil.
I also know there is value in acreage. Problem is, CLR has 1.5 million undeveloped, and 2/3 expires by end of 2017, including 410,000 just this year. So how do you value that if its not looking like Williston Light Sweet gets much above $40 this year?
I hope I haven’t written that shale cannot work at any price, I don’t recall it if I have. Just big majority needs much higher than present.
There are some wells with production histories that will work sub $30, just not too many. EOG has several in Parshal I will agree. EOG CEO also said they are not interested in growing production at current prices. As shale companies go, they are among the most profitable, IMO.
If current strip persists it will cause both US shale and stripper production problems, that is sure. Look at the Q1 consensus earnings estimates for oil and gas companies. Pretty tough.
Nony on Thu, 2nd Apr 2015 3:29 pm
Sand:
I really appreciate your perspective on things. Let’s keep the dialog up. Good luck with your wells.
P.s. Not to rub salt in wound, but there are some delicious arbitrage and temporary spread type things making it very fun to be in the down (even some mid) stream right now. For once, the downtrodden unromantic oil processors are the ones minting money.
shallow sand on Thu, 2nd Apr 2015 4:53 pm
Kind of funny how several integrated spun off downstream. If you could have seen the future, it should have been the other way around. But it could flip back pretty quick too.
Nony on Thu, 2nd Apr 2015 8:14 pm
Or if you happened to buy one of those spun off refineries. Yum, yum. (Just theoretically of course. ;))