Peak Oil is You

Donate Bitcoins ;-) or Paypal :-)
Page added on November 30, 2010
Middle East OPEC reserves revisited
According to the BP statistical review of world energy 2010, the big six Middle East OPEC oil producers (Saudi Arabia, Iran, Iraq, Kuwait, Unite Arab Emirates (UAE) and Qatar) had 743 billion barrels (Gbs) of proved oil reserves (1P) between them, representing 56% of reported proved global oil reserves. Knowledge of this bounty provides OECD governments with much comfort. The trouble is there is no chance these figures are correct. A simple analysis of the published BP data that corrects reserves for historic production and questions reserves revisions that took place during the 1980s points to a proved plus probable (2P) reserves figure in the range 160 to 545 Gbs for this group of countries. It is high time that BP noted in its statistical review that the reserves reporting standard of ME OPEC countries is different to that used by the OECD.

Figure 1 ME OPEC reserves history from BP statistical review of world energy 2010. Chart is copied from an earlier version produced by Rune Likvern.
What is wrong with ME OPEC reserves reporting?
Many regular readers of The Ol Drum will be all too familiar with the following arguments raised against the validity of ME OPEC reserves as reported by BP, this post is written for those who have not heard the story before. Issues with reporting standard fall into two categories, 1) large upwards revisions to reserves that took place during the 1980s and 2) flat line reporting of reserves over time (Figure 1). I will deal with flat line reporting first, but first a few words on reserves reporting standards and mechanisms.
It is important to know that there are two very different reporting standards in operation. The Security Exchange Commission (SEC) guidelines (pdf warning) are very conservative and will normally lead to gross under reporting of reserves in immature oil fields and provinces. The Society of Petroleum Engineers (SPE) guidelines (pdf warning) are much more flexible, with multiple categories, offering companies and countries the opportunity to estimate what may reasonably be expected to be recovered ultimately.
BP specifically reports proved oil reserves (1P) attaching this definition to the spread sheet:
“Proved reserves of oil – Generally taken to be those quantities that geological and engineering information indicates with reasonable certainty can be recovered in the future from known reservoirs under existing economic and operating conditions.”
This is paraphrasing the SEC guidelines and yet it is quite clear that ME OPEC countries are reporting figures more allied to SPE 2P category that includes proved + probable and are non compliant with the standard adopted by BP.
Flat line reporting
A simple scheme for annual adjustments to reserves is as follows:
reserves at start of year
+ new discoveries
± revisions
– production
reserves at end of year
Since 1980, the 6 ME OPEC countries in question have produced 198 Gbs of oil between them, and yet the flat line annual returns (Figure 1) demonstrates beyond any reasonable doubt that reserves have never been adjusted down for this production. Adjusting reserves for production produces the picture shown in Figure 2 suggesting that ME OPEC oil “reserves” are at most 545 Gbs, well below the declared amount.
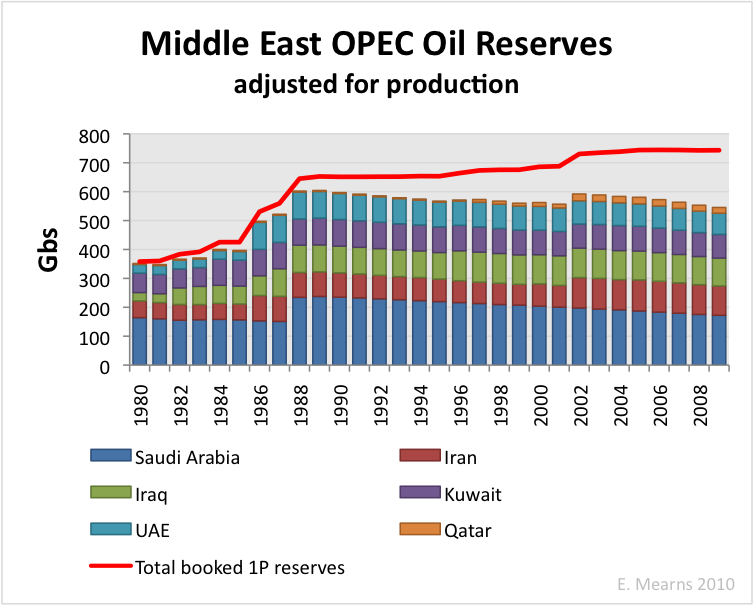
Figure 2 ME OPEC reserves history from BP statistical review of world energy 2010 adjusted over time for cumulative production.
1980s revisions
All companies and countries are entitled to revise reserves estimates in light of new technical data. The most recent revisions in Middle East OPEC took place in 2002 where both Iran and Qatar presumably booked natural gas liquid reserves in the North Field / South Pars Field that spans the Qatar – Iran border. There is nothing wrong with that. What is more often contested is the validity of large upwards revisions to reserves made in the 1980s, starting in 1982 and ending in 1988 (Figure 1). Prior to this time several of the large multi national oil companies operated in the Middle East and with the nationalisation of the oil industry reserves estimates were revised by the National Oil Companies (NOCs). On the one hand, it is sometimes argued that the upwards revisions were justifiable to take into account higher recovery factors expected through application of new technologies such as horizontal wells. On the other hand it is often argued that the reserves adjustments were entirely politically motivated as countries vied for OPEC production quotas. It seems likely that both arguments may be valid and it is impossible to know exactly where the truth lies.
It is worth observing some of the history between Iran and Iraq. The Iran – Iraq war began in 1980 and ended in 1988. In 1980 Iran had 58 Gbs and Iraq 30 Gbs of reserves. In 1982 Iraq raised its reserves to 59 Gbs giving it a narrow lead. In 1986 Iran retaliated with a rise to 93Gbs giving it a clear lead. But in 1987, Iraq retaliated with a knockout blow raising its reserves to 100 Gbs. The war ended in 1988 and the reserves of these two countries have barley changed since. By 1988 the reserves of Iran, Iraq, Kuwait and UAE were all roughly the same, approximately 100 Gbs each, only Saudi Arabia was permitted to bid higher with 260 Gbs.
How much of this is real and how much of this is fantasy it is impossible to say apart from in Kuwait where more details emerged from an unlikely source in the form of IHS Energy. At a conference I attended in 2006, IHS energy presented their view of Kuwaiti reserves based upon their proprietary database of fields. They showed this chart (Figure 3), suggesting that the large upwards revision in Kuwait in 1984 was bogus and that the pre-nationalisation figures from the 1970s were a more faithful reflection of reality. I wrote a post on this rather important information that can be read here.

Figure 3 IHS Energy estmate for 2P Kuwaiti reserves.
It would be wrong to assume that all of the 1980s revisions are equally bogus. The more than 3 fold uplift in Iraq is certainly questionable, however, Saudi Arabia uplifted their reserves by only 50% after reportedly conducting much technical work. It is however reasonable to assume that the pre nationalisation numbers provide a lower bound since these were compiled with the participation of international oil companies (IOCs) who tended then to be conservative in reserve reporting conventions employed. In Figure 4 the pre-nationalistion reserves figures from 1980 are adjusted for production.
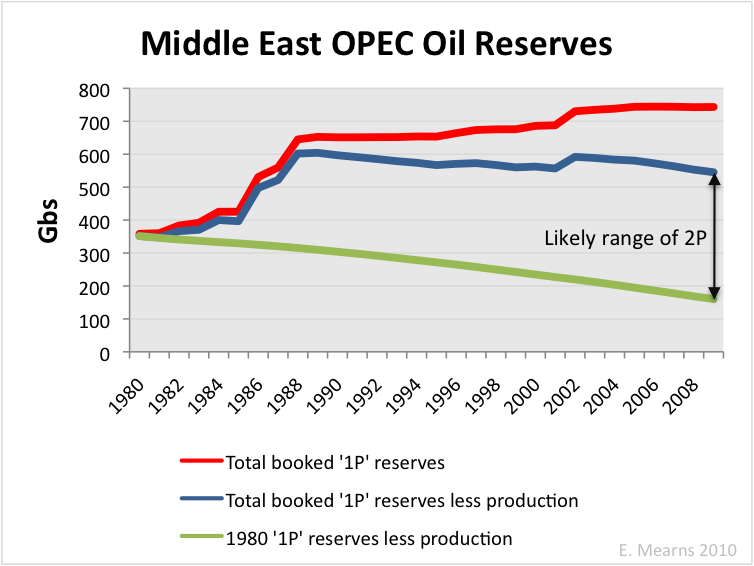
Figure 4 Comparison of official ME OPEC reserves with official reserves adjusted for production and pre-nationalistaion reserves figures adjusted for production. The arrow gives the likely range of 2P reserves.
This exercise provides likely upper and lower bounds for ME OPEC reserves that lie between 160 and 545 Gbs. My best guess would be that reality lies somewhere in the middle at around 350 Gbs, less than half the official figures.
Conclusion
It has long been held that ME OPEC countries are reporting as reserves what would normally be regarded as ultimate recoverable reserves (URR) give or take a few 100 billion barrels of politically motivated revisions. It must surely not be beyond the wit of very smart folks who work at BP to see that it is wrong to classify ME OPEC reserves as “proven” and to give these same weight as the OECD reporting standard. It is high time BP (and other government agencies) got its house in order and noted on the Annual Review spread sheet the anomalies in the ME OPEC reports that are so glaringly obvious.
One Comment on "Middle East OPEC reserves revisited"
KenZ300 on Wed, 1st Dec 2010 1:20 am
It is time to diversify our sources of energy and our energy types.
Don’t put all your eggs in one basket..
Wind, solar, geothermal and biofuels all need to become a bigger part of the energy mix.