David Hughes: The Trouble with Optimistic Shale Gas Projections by the U.S. Department of Energy

On December 3, 2014, Nature published “Natural Gas: The Fracking Fallacy”, which suggested that the forecasts of the Energy Information Administration (EIA) for four major U.S. shale gas plays were wildly optimistic, based on a comparison to forecasts for the same plays by the University of Texas Bureau of Economic Geology (UT/BEG). This was followed by a formal denunciation of the article both by the EIA and UT/BEG, despite the fact that the substance of the article was correct. Arthur Berman provided an excellent overview of the merits—or in this case the lack thereof—of the attack by both of these agencies on what is essentially the reality behind the shale revolution.
The Nature piece steered clear of any discussion of my recent Drilling Deeper report (published by Post Carbon Institute), which looked at twelve major shale gas and tight oil plays accounting for most of U.S. shale production, and which also came to the conclusion that the EIA’s projections were extremely optimistic. Nature focused instead on the four plays described in two published and two unpublished studies by UT/BEG. The Nature article sparked a lot of media attention, which prompted the EIA and UT/BEG to issue rebuttals.
The argument of the EIA and UT/BEG that their projections of shale gas production from the plays mentioned in theNature article are fundamentally similar is untrue, given the publicly available data. The implications of the EIA being wrong on its projections of cheap and abundant gas for decades are considerable, given that investment decisions are now being made based on these projections— including construction of infrastructure for LNG exports, gas-fired generation and even crude oil exports. Hence it is worthwhile to examine the EIA’s optimistic projections in more detail in light of the projections available from UT/BEG and the Drilling Deeper report (DD).
Three Methodologies
The two
published UT/BEG studies are indeed complex, focusing on myriad estimated and measured variables and the development of a tiering of sections utilizing well productivity and other data from which they infer cost of production and future production profiles. They limit the prospective area of a play at the section level and exclude portions of drained and undrained blocks in their analysis. They also determine the number of prospective drilling locations by tier and potential interference between wells which limits downspacing. Production projections are based on price.
The
DD approach is also based on an assessment of all wells in a play. The play area is delimited by productive and non-productive wells, and key fundamentals including well- and field-decline rates, EUR, and first-year production rates. Well quality is determined at the play level and at the county- and partial county-levels. The number of prospective drilling locations is determined from industry and other literature as well as a consideration of surface land use which may limit access to some drilling locations. Production projections are based on assumed drilling rates which in turn are based on price. Drilling is assumed to progress from areas of highest well quality to the well quality of outlying counties as a play is developed.
The EIA uses a system known as the National Energy Modelling System (NEMS) which, although purported to be based on a county level analysis for shale, is complex, is not transparent and its outputs for future shale play production at times defy logic. A statement at the EIA’s
NEMS link says: “Most people who have requested NEMS in the past have found out that it was too difficult or rigid to use.”
The four shale gas plays examined in the Nature article are the Barnett, Fayetteville, Haynesville and Marcellus. Each of these is outlined and compared below. The UT/BEG projections were extended to 2040 using the annual percentage decrease in the final year (2029-2030) to make them comparable to the EIA and DD projections. The data for the UT/BEG and EIA projections are
available here. The DD projections are
available here.
Barnett Play
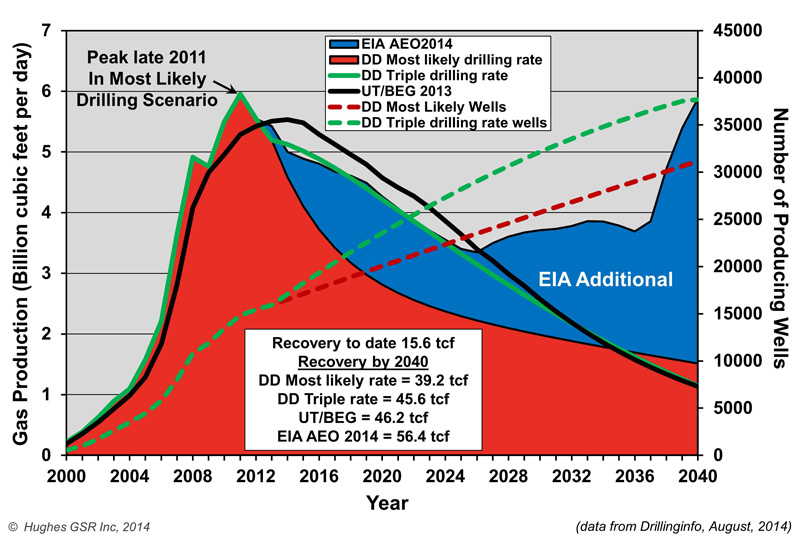
The Barnett Play comparison is illustrated in Figure 1.
Figure 1 – Comparison of shale gas production projections for the Barnett Play through 2040. Two projections are shown from DD compared to the UT/BEG projection, which assumes reference case natural gas prices in the EIA Annual Energy Outlook 2014 (AEO2014), and the EIA reference case projection from AEO2014.
Historical production data is current to yearend 2010 for the UT/BEG projection, 2012 for the EIA projection and mid-2014 for the DD projections. Drilling rates would have to triple from the current 400 wells/year to 1200 wells/year for the DD projection to match the EIA projection out to 2026 – after that the EIA assumes a bizarre ramp up to the level of the 2011 peak by 2040 for which there is no apparent justification. The UT/BEG projection underestimates historical production and assumes peak production in 2014 whereas production peaked in late 2011 and is now down 18% from peak. UT/BEG also apparently assumes a ramp up to much higher drilling rates to meet its projection after peak.
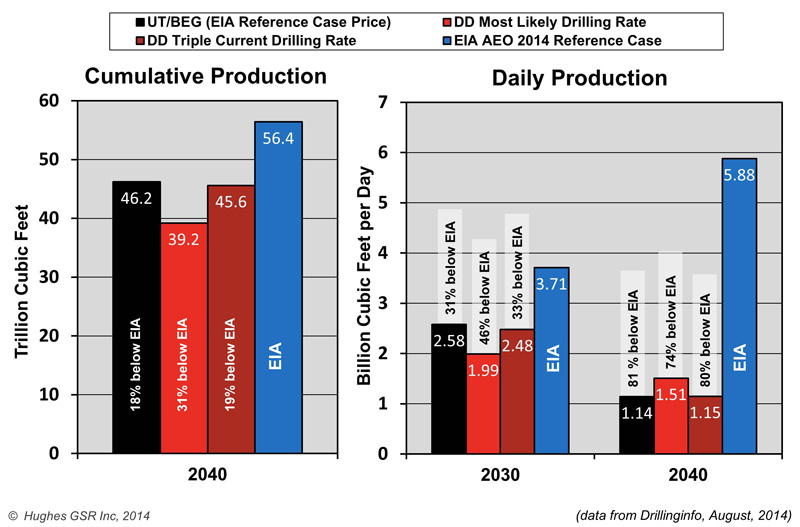
Figure 2 summarizes the EIA overestimates in both cumulative production through 2040 and projected production rates in 2030 and 2040 compared to the other projections. Cumulative production of gas through 2040 is overestimated by the EIA by between 22% and 44%. Daily production in 2030 is overestimated by between 44% and 87%, and daily production in 2040 is overestimated by between 288% and 417%.
Figure 2 – Comparison of cumulative production through 2040 and projected daily production in 2030 and 2040 for four projections for the Barnett Play. The EIA overestimates daily production in 2030 by between 44% and 87%, and daily production in 2040 by between 288% and 417%.
Fayetteville Play
The Fayetteville Play comparison is illustrated in Figure 3.
Figure 3 – Comparison of shale gas production projections for the Fayetteville Play through 2040. The “most likely drilling rate” projection from DD is shown compared to the UT/BEG projection, which assumes reference case natural gas prices in the EIA AEO2014, and the EIA reference case projection from AEO2014.
Historical production data is current to yearend 2011 for the UT/BEG projection, 2012 for the EIA projection and mid-2014 for the DD projection. Both the UT/BEG and EIA projections underestimate production at the 2012 peak but have the timing of peak correct. However the EIA assumes a bizarre ramp up in production, starting in 2014, to nearly double the level of the 2012 peak in 2036, for which there is no apparent justification. The UT/BEG projection assumes a more rapid ramp down of production after peak than DD.
Figure 4 summarizes the EIA overestimates in both cumulative production through 2040 and projected production rates in 2030 and 2040 compared to the other projections. Cumulative production of gas through 2040 is overestimated by the EIA by between 82% and 125%. Daily production in 2030 is overestimated by between 162% and 286%, and daily production in 2040 is overestimated by between 247% and 895%.
Figure 4 – Comparison of cumulative production through 2040 and projected daily production in 2030 and 2040 for three projections for the Fayetteville Play. The EIA overestimates daily production in 2030 by between 162% and 286%, and daily production in 2040 by between 247% and 895%.
Haynesville Play
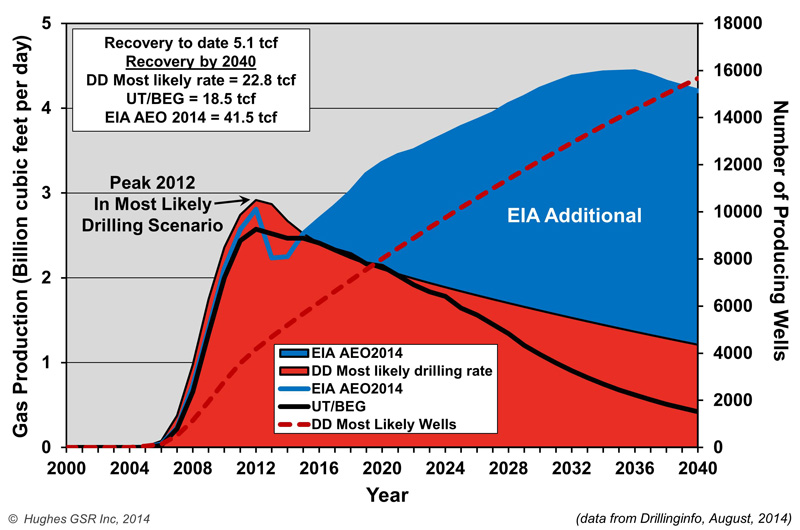
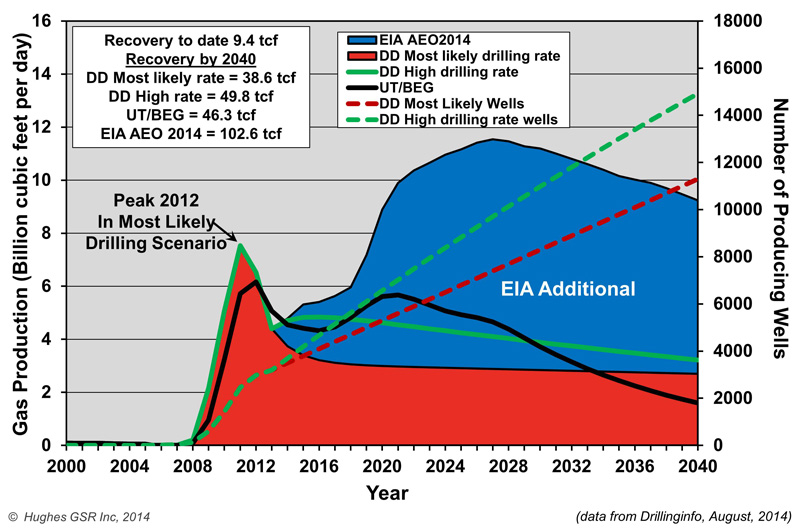
The Haynesville Play comparison is illustrated in Figure 5.
Figure 5 – Comparison of shale gas production projections for the Haynesville Play through 2040. Two projections are shown from DD compared to the UT/BEG projection, which assumes reference case natural gas prices in the EIA Annual Energy Outlook 2014 (AEO2014), and the EIA reference case projection from AEO2014.
Historical production data is likely current to at least yearend 2011 for the UT/BEG projection (vintage is not mentioned in the data source), 2012 for the EIA projection and mid-2014 for the DD projections. Drilling rates for the DD “high drilling rate” projection assume an increase from the current 210 wells/year to 500 wells/year whereas the “most likely drilling rate” assumes an increase to 300 wells/year. The EIA assumes a bizarre production ramp up beginning in 2014 rising to a new peak in 2027 at a level more than 50% higher than the early 2012 peak for which there is no apparent justification. The UT/BEG projection underestimates historical production and production at the 2012 peak but assumes a production rise presumably due to higher drilling rates in the 2020 timeframe followed by a decline to levels considerably lower than any other projection by 2040.
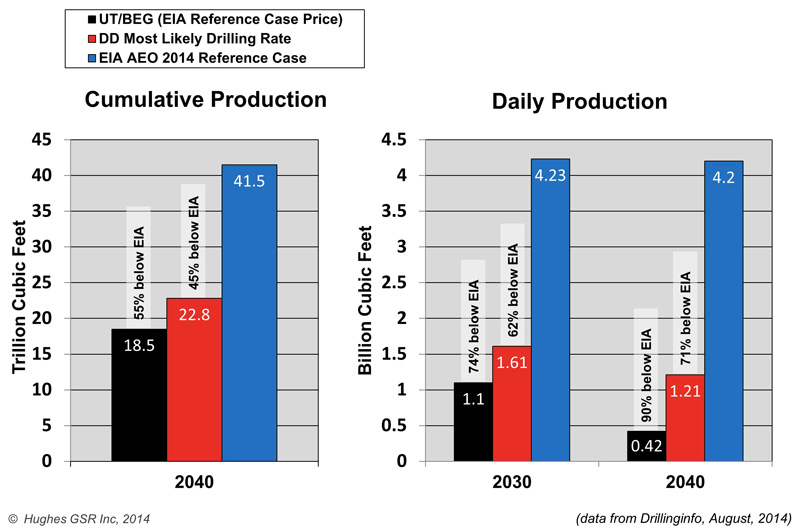
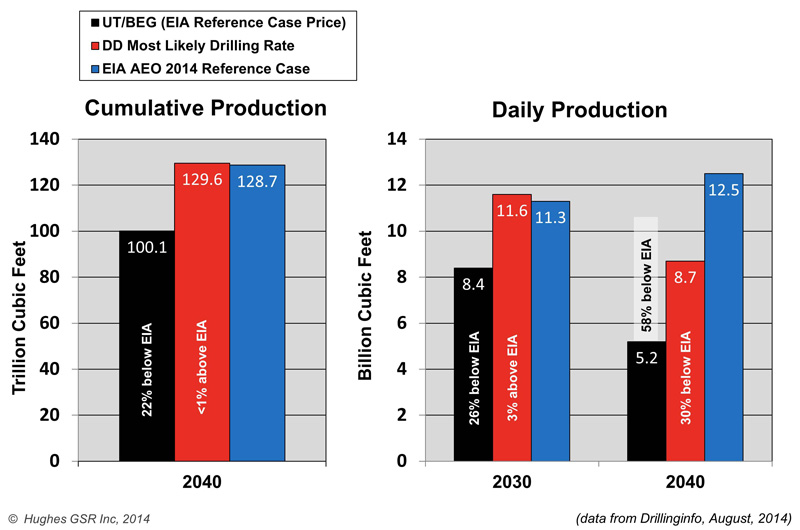
Figure 6 summarizes the EIA overestimates in both cumulative production through 2040 and projected production rates in 2030 and 2040 compared to the other projections. Cumulative production of gas through 2040 is overestimated by the EIA by between 106% and 165%. Daily production in 2030 is overestimated by between 188% and 294%, and daily production in 2040 is overestimated by between 187% and 477%.
Figure 6 – Comparison of cumulative production through 2040 and projected daily production in 2030 and 2040 for four projections for the Haynesville Play. The EIA overestimates daily production in 2030 by between 188% and 294%, and daily production in 2040 by between 187% and 477%.
Marcellus Play
The Marcellus Play comparison is illustrated in Figure 7.
Figure 7 – Comparison of shale gas production projections for the Marcellus Play through 2040. The “most likely drilling rate” projection from DD is shown compared to the UT/BEG projection, which assumes reference case natural gas prices in the EIA AEO2014, and the EIA reference case projection from AEO2014.
Historical production data is likely current to at least yearend 2011 for the UT/BEG projection (vintage is not mentioned in the data source), 2012 for the EIA projection and mid-2014 for the DD projection. Both the UT/BEG and EIA projections seriously underestimate production in the early years of their forecasts. The EIA assumes that production in 2040 will be considerably higher than either of the other projections in 2040. Cumulative recovery of gas by 2040 is similar for both the EIA and DD projections however the UT/BEG projects a considerably lower cumulative production.
Figure 8 summarizes the EIA overestimates in both cumulative production through 2040 and projected production rates in 2030 and 2040 compared to the other projections. The EIA overestimated cumulative production through 2040 by 29% according to UT/BEG. The EIA’s estimate of daily production in 2030 is overestimated by 36% in the UT/BEG projection. EIA daily production in 2040 is overestimated by between 45% and 142%.
Figure 8 – Comparison of cumulative production through 2040 and projected daily production in 2030 and 2040 for three projections for the Marcellus Play. The EIA overestimates daily production in 2030 by up to 36%, and daily production in 2040 by between 45% and 142%.
Combined Plays
Figure 9 illustrates the projections for all plays combined.
Figure 9 – Comparison of shale gas production projections for all four plays combined through 2040. The “most likely drilling rate” projection from DD is shown compared to the UT/BEG projection, which assumes reference case natural gas prices in the EIA AEO2014, and the EIA reference case projection from AEO2014.
Both the UT/BEG and EIA underestimate historical production, likely due to the fact that the data they used is current only to yearend 2010 to 2012. DD projects a peak in 2016 followed by a gradually increasing decline with a cumulative recovery of 230 tcf, which is nearly six times as much gas as has been recovered from these plays so far. UT/BEG projects a later peak, in 2020, at slightly higher levels, followed by a much steeper decline rate with considerably lower cumulative production and 2030- and 2040-production rates than DD. The EIA projects a peak in 2025 at 43% above current levels followed by an undulating plateau, with cumulative production through 2040 that is 43% higher than DD and 56% higher than UT/BEG.
Figure 10 summarizes the EIA overestimates in both cumulative production through 2040 and projected production rates in 2030 and 2040 compared to the other projections. Cumulative production of gas through 2040 is overestimated by between 43% and 56%. Daily production in 2030 is overestimated by between 69% and 93%. Daily production in 2040 is overestimated by between 126% and 282%.
Figure 10 – Comparison of cumulative production through 2040 and projected daily production in 2030 and 2040 for three projections for all four plays combined. The EIA overestimates daily production by between 69% and 93% in 2030, and by between 126% and 282% in 2040.
Summary and Implications
Projections by the UT/BEG and DD, based on all available well production data, suggest that the projections from the EIA for the four plays examined are vastly overstated, including both cumulative gas recovery and production rates. Production from these plays will likely peak between 2017 and 2020, and be less than half to as little as a quarter of that estimated by the EIA by 2040. Projections from the UT/BEG are the most conservative overall, although both the UT/BEG and DD projections are much more conservative than those of the EIA. Taken together, these plays make up 70% of the EIA’s projected shale gas production through 2040 and 59% of its daily shale gas production in 2040.
Using the same methodology, DD analyzed other shale gas plays, along with associated gas from tight oil production, which total 88% of the shale gas production projected by the EIA through 2040. DD found that the EIA has overestimated cumulative shale gas production from all of these plays by 64%, and daily production by 92% and 182% in 2030 and 2040, respectively.
Two things appear certain from the UT/BEG and DD analyses: prices will have to go considerably higher than EIA estimates in the medium- and long-term to keep production up; and that supply will become problematic within a decade barring the emergence and full development of a Marcellus-class play or two that are as yet undiscovered.
The EIA’s production and price projections for both gas and oil are seen as fundamental inputs to energy policy considerations and investment decisions in many quarters. These include:
- Development of LNG capacity to export the perceived shale gas bounty and monetize it at higher international prices.
- Development of gas-fired generation capacity on the assumption of low long term prices and abundant supply, in preference to other alternatives.
- Development of industrial capacity on the assumption of low prices and abundant supply for the foreseeable future. Industrial users are justifiably concerned about the impact of LNG exports on domestic prices.
- Development of pipeline infrastructure to distribute the projected bounty.
Both Drilling Deeper and the University of Texas Bureau of Economic Geology analyses raise serious questions about the wisdom of these policy and investment choices. Although it is certain that natural gas will be an important part of the long-term energy future, a sustainable energy plan behooves us to have a clear vision of future supply and price constraints in the longer term, and the EIA is letting us down in this regard with its extremely optimistic projections. TheNature piece raised the question and it was taken up by the mainstream media – let’s hope the message is not forgotten amid the hype promoting “Saudi America” and “Energy Independence”.
Post Carbon Institute


coffeeguyzz on Wed, 24th Dec 2014 10:18 am
“Both the UT/BEG and EIA projections seriously underestimate production in the early years of their forecasts”. So writes Mr. Hughes just below graph 7 regarding the Marcellus.
Somewhat perplexing that Mr. Hughes did not include the fact that his own projections of Marcellus gas output are not only low, (as can be seen in the above graph), but are – in fact – way low and increasingly so as pipelines are being completed/utilized right now.
I just started to retrieve and post actual data from Mr. Hughes’ Drilling Deeper and the most recent EIA reports, but I’ve come to the conclusion that there are other ‘agenda’ motivations in play here … (that, BTW, is the actual term used in the three page ‘rebuttal’ letter just released by the EIA excoriating Nature’s recent piece on the fracking ‘fallacy’).
Interested parties can do their own due diligence. (Check out/compare the projected output – esp. peak in the Bakken – as depicted in DD while you are at it. The verifiable accuracy/inaccuracy is easily seen).
rockman on Wed, 24th Dec 2014 10:36 am
A good article. Lots of interesting points. But in the longer term everyone’s projection of US NG production will hinge on the accuracy of their projection of NG prices. And a quick review reveals that past projections of NG prices weren’t worth a crap. And that includes some of the most experienced folks who actually back up their expectations with hard cash.
Once again I’ll drag one former client, Devon, thru the mud. In 2008 they were one of the most active shale gas players. Very heavy into the Haynesville Shale. Had 18 rigs running in the play. Devon was one of the largest independent energy companies: US shale plays and Deep Water Gulf of Mexico, Africa and Brazil. Multi $billion budgets. Obviously they would have the best and brightest scanning the NG price horizon.
Consulting for their drilling department I sat with those engineers every morning for the detailed daily ops update. And as 2008 progressed I watched the panic slowly grow from the heady days of $12+/mcf as prices slowly collapsed. Once prices slide down to $6/mcf it became full on despair.
And those 18 rigs Devon signed on with long term contracts? Long term contracts because of the mad rush by all the players to drill the shales. By early 2009 Devon cancelled 14 of those contracts paying $40 million in penalties. IOW it made more financial sense for them to pay $40 million TO NOT DRILL Haynesville wells. But they did hang onto 4 rig lines. As pointed out numerous times there is no one price of oil/NG that makes any trend commercially viable. Those decisions are prospect specific.
Devon survived by selling off huge chunks of their assets: DW GOM, Brazil, Africa. And closing its Houston office and laying off hundreds of employees. But being a public company the had to have a big drilling program to grow their reserve base. No problem: they paid $6 billion to acquire assets in Texas’s Eagle Ford shale formation from privately held GeoSouthern Energy…82,000 acres.
And how did they view the acquisition just last May (just before oil prices began its slide):”Devon has at least 1,200 undrilled locations in the South Texas oil-and-gas play with 400 million barrels of risked recoverable resources, company officials also noted.
Devon’s purchase of the Eagle Ford acreage was 2013’s largest upstream energy deal. It executed the deal so it could move away from the low-margin natural gas business.”
So they continued their escape from NG to the savior of oil producing shales. Since last June their stock price has continually dropped down from $78/share to $60/share. Last June? But prices just began to tumble? Maybe folks with $billions invested in energy company equities were paying closer attention. BTW the Rockman sold his Devon stock at $76/ last spring. Why would the Rockman bail on Devon after their big leap into the EFS with oil selling around $100/bbl? This ain’t the Rockman’s first rodeo. LOL.
Not sure how much holiday joy there is floating around Devon’s OK home office these days. Geosouthern is probably having a very happy holiday counting their $6 billion they got selling out at the recent peak in oil prices. BTW: Geosouthern is privately owned…not a pubco. Old saying in the oil patch: pigs get fat… hogs get slaughtered. I’ve known the boys at Geosouthern for years. This ain’t their first rodeo either. LOL.
So everyone one is free to make whatever predictions they want. Even if they don’t back their words up with their money. And obviously just because a very sophisticated operator backs their predictions up with $billions it doesn’t necessarily mean they know what the f*ck they’re doing. LOL. I wonder how many long term Eagle Ford drill rig contracts Devon has these days?
Jerry McManus on Wed, 24th Dec 2014 10:52 am
The Rockman sez: “Follow the money, but don’t get fooled!”
Nony on Wed, 24th Dec 2014 10:58 am
Berman, etc. have been yammering about natgas needing to be $8. and it just keeps hanging at sub 4. With volume growing. The Marcellus wins.
Nony on Wed, 24th Dec 2014 11:00 am
And Mason Inman is a documented peaker. He was a reporter in search of a narrative. Just read his websites. Not objective.
Oh…and he had a bunch of blather about how he would expose the Marcellus in early 2014. And it has added 3 BCF/day in 2014! And he just shut up and left his earlier half baked half done work.
shortonoil on Wed, 24th Dec 2014 11:42 am
The amount of reserves for any hydrocarbon can be reduced to the effects of two variables: the cost of production, and the price. Total resource in the ground has little to do with EUR (estimated ultimate reserves). The EIA has historically under estimated the first variable, and over estimated the second. It has repeatedly taken the position that most of a “technically recoverable resource” will be extracted. This is a huge assumption that has no historical, or theoretical bases.
This very simplistic approach ignores more significant variables in the production equation: such as, the end consumer affordability of the product, and the spread between that affordability, and the production costs. We have done detailed analysis that demonstrates that ignoring those two variables results in wildly optimistic projections for petroleum reserves. We must conclude that the same can be said for natural gas.
For the prudent investor who’s long term success depends on those reserve estimates, it would be advisable to take David Hughes’, and the Post Carbon Institute’s analysis very seriously.
http://www.thehillsgroup.org/
Nony on Wed, 24th Dec 2014 11:45 am
We’re actually already over 16 in the Marcellus according to the Drilling Productivity Report (projection). So all the graphs for that play are too low.
Also, it’s not unreasonable to expect some improvement in extraction capability with time. After all, look at what has happened already.
The futures markets seem to buy the EIA story more than Berman-Hughes story. If Hughes really buys his price projection, I challenge him to play the futures market on it. Or we can make a bet.
Kenz300 on Wed, 24th Dec 2014 12:52 pm
Shale is the high cost swing producer……
Lower prices for oil means less shale oil going forward…..
High depletion rates will ensure production declines if fewer new wells are drilled.
Nony on Wed, 24th Dec 2014 1:02 pm
agreed. What we are seeing is market equilibrium. $100/bbl was not sustainable. There was too much shale oil coming on line. Futures markets predict some equilibrium 0f 60-70 a few years out.
GregT on Wed, 24th Dec 2014 2:00 pm
What we are seeing Nony, is economic contraction. It is the price of the oil that matters. If/ when the market cannot afford the oil, it will not be produced at that price. The oil age will not end for lack of oil, it will end when the oil is no longer affordable to society as a whole. The price is still above the goldilocks range that has sustained the economic growth necessary to service our fiat monetary systems. Financial well being will continue to be eroded from the bottom of society upwards. Confidence in manipulated markets is what is keeping the facade from being exposed to the general populous. Monetization cannot continue indefinitely.
Nony on Wed, 24th Dec 2014 2:56 pm
You can’t blame the price drop on demand (thus saying supply did not increase) if volume is up. Look at natgas. We have expanding volume AND low price. That is a supply story.
Peakers want to blame every price decline on demand and every price increase on depletion. Watch the volume, though.
shortonoil on Wed, 24th Dec 2014 3:22 pm
Monetization cannot continue indefinitely.
A few day ago I posted that an analysis of WTI pricing between 1960 and 2004, and 2005 and 2013 shows that the variance in oil prices has increase by 412% over those two periods. At the time I stated that we didn’t know exactly why, but that it was causing havoc for oil producers because long term planning, which is required for new projects, requires some reasonable estimate of long term prices.
One reasonable explanation for this dramatic rise in volatility is the Central Bank’s monetary policies. They began when Greenspan reduced interest rates in 2001, and have continued. Injection of $6 trillion dollars, and ZIRP has permitted the pursuit of projects that would have otherwise not been economical. The difference in historic interest rates, and present rates on an $8.5 million Bakken well amounts to a subsidy of $25/barrel over the life time of the well.
If this is the situation, and it seems likely, continued monetization will destroy the petroleum industry, and perhaps many others through increasing market volatility. But the FED has pursed that policy to salvage its member banks. Since those member banks own the FED, the FED is in essence attempting to save itself.
Our interest in this is that our model indicates that the price for 2015 WTI should be about $76/barrel:
http://www.thehillsgroup.org/depletion2_022.htm
Since the model has had a 47 year margin of error of 4.5% it seems highly likely, with oil now at $55.50, that some other variable may have entered the equation. A $25/barrel deferential may be a coincidence, but then again, maybe its not!
http://www.thehillsgroup.org/
Kenz300 on Thu, 25th Dec 2014 9:33 am
The fossil fuel industry always has overly optimistic projections until they are proven to be wrong…….
They will say or do anything to try to keep their hold on the worlds energy supplies and reduce any competition.
They think that by projecting an abundance of resources they can delay or reduce additional investments in alternatives……… the fossil fuel industry hates any competition…….
It will not work….. Climate Change is real and the world is moving to address it……
——————–
China rolls out the world’s largest electric car charging network – YouTube
https://www.youtube.com/watch?v=UkYHxiSrsHY&spfreload=10
Nony on Sat, 27th Dec 2014 9:01 am
I don’t understand some technical details:
David has Marcellus kissing 14 as of AUG2014. EIA drilling productivity report (which has some projection for recent month) has it already above 16 as of DEC. IOW, EIA has the play as already above ALL the projections. And I guess that the AOE2014 is old (from 2013), but why is the UT/BEG study so MASSIVELY low. I mean it has a peak that is 12.5 in 2023, way less than any recent measurement.
And then there is another data source on EIA that says just reached 14 as of NOV. (Click through to the excel spreadsheet [linked below figure].
http://www.eia.gov/naturalgas/weekly/
Whole thing is confusing. Is there some difference of flaring or the like? What are the precise definitions? Why the differences?
John Baldwin on Sat, 27th Dec 2014 11:43 am
Would Mr Hughes and Mr Berman kindly print a summary of their shale oil/gas articles since 2009
Never in the field of energy history have two guys been so wrong for so long
I find it unbelievable that they maintain their shale oil/gas denier stance
The facts are the production rates and long term natural gas price, they are both anti science, selecting evidence that seems to support their prejudices
I think it’s certain they will maintain their 100% wrong position
Nony on Thu, 18th Jun 2015 3:29 pm
Here is David Hughes in 2006 on North American natural gas. Claimed his predictions included unconventional gas. Got BUTT slammed by what happened with shale. Just totally freaking annihilated. This dude predicted 1.5 BCF/d/year declines. And instead production exploded.
https://www.youtube.com/watch?v=poRAEL7M9Ds
(watch around minute 23-24 especially. totally discounted the nascent shale explosion and predicted certain growth in NA LNG imports! HA!!!)
Nony on Thu, 18th Jun 2015 3:35 pm
Also listen to minutes 28-29:
*Unconventional gas will only slow the decline, not reverse it.
*America will become more and more dependent on LNG.
*America will be subject to volatility from offshore gas production.
Wrong, wrong, wrong!
Anonymous on Sun, 13th Aug 2017 3:08 am
Here is David Hughes in 2011 arguing that EAI was too optimistic in their natgas growth prediction by 2035. In fact we reached that growth projection by 2015! EIA wasn’t some crazy optimist. They were way too conservative. (And that was even with prices UNDER EIA preductions!)
http://www.postcarbon.org/publications/will-natural-gas-fuel-america/ (see page 28 to 33)
David Hughes has been consistently wrong and always in the same, peaker, direction. And he doesn’t address his past wrong predictions or learn from them. Just makes more pompous peaker articles every few months.
Davy on Sun, 13th Aug 2017 6:16 am
Nony, peakers and cornucopians alike have been wrong and right. One thing that is not wrong is the physics of depletion. Peak oil dynamics is alive and well. We have multiple sources even MSM sources along with governmental sources sounding the alarm of lack of investment in the oil industry which points to a coming supply crunch. That is peak oil too in my books. Peak oil is not only geologic it is systematic. Peak Oil Dynamics, thanks Rock for your definition, is also systematic and economic. When you consider oil is our foundational energy source that allows a modern global world then you realize POD is very dangerous and destabilizing. No amount of techno optimism whether it is your dirty oily kind or cloggie’s renewable fake green kind is like going to save a civilization brushing up to limits with a growth based global system. Peak oil is going to stop us in our tracks along with several other predicaments. It is the converging and mixing of systematic, environmental, food/water, and energy issues that make this a planetary crisis. You can crow the “baker Hughes is wrong” stuff but that does not make you right about the direction we are going in as a globally interconnected civilization.
Anonymous on Sun, 13th Aug 2017 8:32 am
Nothing is over, Davy.
https://www.youtube.com/watch?v=D7mGrh4JcQo
joe on Sun, 13th Aug 2017 8:38 am
Davy I call it bumpy plateau
https://calhounpowerline.com/2014/10/27/get-ready-for-life-on-the-bumpy-plateau/
Davy on Sun, 13th Aug 2017 8:43 am
nony, how about this:
https://www.youtube.com/watch?v=JSUIQgEVDM4
Davy on Sun, 13th Aug 2017 8:44 am
Yea, joe, I agree
Boat on Sun, 13th Aug 2017 11:28 am
joe,
The bumpy plateau article was well written with excellent points.
But, but, but, humans and their systems do a poor job of managing still massive reserves around the world. There is a long list of countries that could pump more for decades if geopolitics were not an issue. At $60 oil fracking would take off in Mexico and Argentina for example.