Guest Post by
Dr. Minqi Li, Professor
Department of Economics, University of Utah
E-mail: [email protected]
June 2018
This is Part 1 of the World Energy Annual Report in 2018. This author has developed world energy annual reports that have been posted at Peak Oil Barrel since 2014. The purpose of this Annual Report is to provide updated analysis of the current development of world energy production and consumption, consider possible scenarios of world energy supply over the 21st century, and evaluate their implications for global economic growth and climate change. This year’s Annual Report includes multiple parts:
Part 1 World Energy 2018-2050
Part 2 World Oil 2018-2050
Part 3 World Natural Gas 2018-2050
Part 4 World Coal 2018-2050
Part 5 Global Carbon Dioxide Emissions and Climate Change 2018-2100
Part 1 summarizes the general findings of this year’s World Energy Annual Report. Given the currently available information, world oil production is projected to peak in the early 2020s, world natural gas production is projected to peak in the 2030s, and world coal production is projected to peak in the late 2020s. Wind and solar power is projected to grow rapidly and account for about one-third of the world energy supply by the mid-21st century. Despite the rapid expansion of renewable energies, global energy supply and economic growth are expected to decelerate over the coming decades. By the mid-21st century, the energy-constrained global economic growth rates may not be sufficient to ensure economic and political stability for the existing world system. Although world carbon dioxide emissions are projected to peak before 2030, cumulative carbon dioxide emissions over the 21st century will be sufficient to result in global warming by more than two degrees Celsius relative to the pre-industrial time (assuming there will be no large-scale carbon sequestration programs).
Part 2 through Part 5 of this year’s World Energy Annual Report will be posted at Peak Oil Barrel in the coming months. Figures and tables are placed at the end of each section.
World Energy 2017
According to BP’s Statistical Review of World Energy, world primary energy consumption reached 13,511 million tons of oil equivalent in 2017 (BP 2018). Between 2007 and 2017, world primary energy consumption grew at an average annual rate of 1.5 percent.
World oil consumption (including biofuels) was 4,622 million tons of oil equivalent in 2017, accounting for 34 percent of the world primary energy consumption (BP revised the measurement of oil consumption in 2018).
World natural gas consumption was 3,156 million tons of oil equivalent in 2017, accounting for 23 percent of the world primary energy consumption (BP revised the measurement of natural gas consumption in 2018).
World coal consumption was 3,731 million tons of oil equivalent in 2017, accounting for 28 percent of the world primary energy consumption.
World consumption of nuclear electricity was 596 million tons of oil equivalent in 2017, accounting for 4.4 percent of the world primary energy consumption.
World consumption of hydro electricity was 919 million tons of oil equivalent in 2017, accounting for 6.8 percent of the world primary energy consumption.
World consumption of wind and solar electricity was 354 million tons of oil equivalent in 2017, accounting for 2.6 percent of the world primary energy consumption.
World consumption of geothermal, biomass and other renewable electricity was 133 million tons of oil equivalent in 2017, accounting for 1.0 percent of the world primary energy consumption.
According to the World Bank and IMF data, gross world product (global economic output) was 116 trillion dollars (in constant 2011 international dollars) in 2017. Between 2007 and 2017, global economic output grew at an average annual rate of 3.2 percent (World Bank 2018; IMF 2018).
World average energy efficiency was 8,617 dollars per ton of oil equivalent in 2017. Between 2007 and 2017, world average energy efficiency grew at an average annual rate of 1.7 percent.
Figure 1 compares the historical world economic growth rates and the primary energy consumption growth rates from 1991 to 2017. The primary energy consumption growth rate has an intercept of -0.012 at zero economic growth rate and a slope of 0.914. That is, primary energy consumption has an “autonomous” tendency to fall by about 1.2 percent a year when economic growth rate is zero. When economic growth rate rises above zero, an increase in economic growth rate by one percentage point is associated with an increase in primary energy consumption by 0.91 percent. R-square for the linear trend is 0.75.
In 2017, world primary energy consumption grew by 1.9 percent, a rate that is 0.4 percentage points below what is implied by the historical trend.
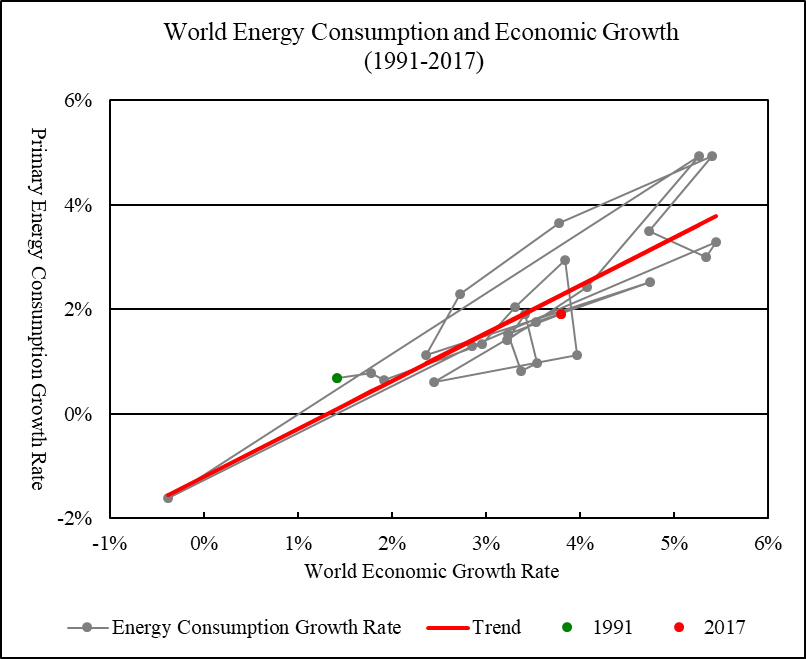
Figure 1 World Energy Consumption and Economic Growth, 1991-2017
Linear Trend: Primary Energy Consumption Growth Rate = -0.012 + 0.914 * Economic Growth Rate (R-square = 0.751)
Sources: World primary energy consumption from 1990 to 2017 is from BP (2018). Gross world product in constant 2011 international dollars from 1990 to 2016 is from World Bank (2018), extended to 2017 using growth rate reported by IMF (2018, Statistical Appendix, Table A1).
Energy Consumption by Major Economies, 1990-2017
Figure 2 compares the per capita primary energy consumption in relation to per capita GDP for the world’s six largest national energy consumers and the European Union.
China is the world’s largest energy consumer. In 2017, China’s primary energy consumption reached 3,132 million tons of oil equivalent, accounting for 23 percent of the world primary energy consumption. From 1990 to 2013, China’s per capita energy consumption surged from 602 kilograms of oil equivalent to 2.14 tons of oil equivalent. Since then, China’s energy consumption growth has slowed. By 2017, China’s per capita energy consumption rose to 2.26 tons of oil equivalent, which is still substantially below the per capita energy consumption levels of advanced capitalist economies.
If China’s per capita energy consumption were to follow its historical trend in relation to per capita GDP, China’s per capita energy consumption would rise to 5.26 tons of oil equivalent by 2050 (when China’s per capita GDP is projected to rise to about 50,000 dollars). China’s population is expected to peak before 2030 and decline to 1.36 billion by 2050. Given these projections, China’s energy demand will exceed 7 billion tons of oil equivalent by 2050.
The US is the world’s second largest energy consumer. In 2017, the US primary energy consumption was 2,235 million tons of oil equivalent, accounting for 17 percent of the world primary energy consumption. The US per capita energy consumption peaked at 8.01 tons of oil equivalent in 2000. From 2007 to 2009, the US per capita energy consumption fell sharply from 7.7 tons of oil equivalent to 7.04 tons of oil equivalent, reflecting the economic damages caused by the “Great Recession”. Since then, the US per capita energy consumption has trended down, falling to 6.87 tons of oil equivalent by 2017.
European Union is the world’s third largest energy consumer. In 2017, the European Union’s primary energy consumption was 1,689 million tons of oil equivalent, accounting for 13 percent of the world primary energy consumption. The EU per capita energy consumption peaked at 3.71 tons of oil equivalent in 2006. As the European Union struggled with both the global economic crisis of 2008-2009 and the Southern European financial crisis, the EU per capita energy consumption fell to 3.2 tons of oil equivalent by 2014. By 2017, the EU per capita energy consumption recovered to 3.29 tons of oil equivalent.
India is the world’s fourth largest energy consumer. In 2017, India’s primary energy consumption rose to 754 million tons of oil equivalent, accounting for 5.6 percent of the world primary energy consumption. As India’s economy grew rapidly, India’s per capita energy consumption grew from 225 kilograms of oil equivalent in 1990 to 562 kilograms of oil equivalent in 2017. If India’s per capita energy consumption continues to follow its historical trend in relation to per capita GDP, India’s per capita energy consumption will rise to 1.21 tons of oil equivalent by 2050 (when India’s per capita GDP is projected to rise to about 19,000 dollars). India’s population is expected to grow to 1.72 billion by 2050. Given these projections, India’s energy demand will exceed 2 billion tons of oil equivalent by 2050.
The Russian Federation is the world’s fifth largest energy consumer. In 2017, Russia’s primary energy consumption was 698 million tons of oil equivalent, accounting for 5.2 percent of the world primary energy consumption. In 1990, when Russia was a part of the Soviet Union, Russia’s per capita energy consumption was 5.8 tons of oil equivalent. As the Russian economy was torn apart by the disintegration of the Soviet Union and the neoliberal “shock therapy” (free market economic policies of privatization and liberalization), Russia’s per capita energy consumption collapsed to 4.03 tons of oil equivalent by 1998. Since then, Russia’s energy consumption has grown steadily. In 2017, Russia’s per capita energy consumption reached 4.83 tons of oil equivalent.
Japan is the world’s sixth largest energy consumer. In 2017, Japan’s primary energy consumption was 456 million tons of oil equivalent, accounting for 3.4 percent of the world primary energy consumption. Japan’s per capita energy consumption peaked at 4.15 tons of oil equivalent in 2005. Since then, Japan’s energy consumption has tended to fall as the economy struggled between recession and stagnation. By 2016, Japan’s per capita energy consumption fell to 3.55 tons of oil equivalent, lower than Japans’ per capita consumption level in 1990. In 2017, Japan’s per capita energy consumption recovered to 3.6 tons of oil equivalent.
Canada is the world’s seventh largest energy consumer and has the highest per capita energy consumption among the world’s major economies. In 2017, Canada’s primary energy consumption was 349 million tons of oil equivalent, accounting for 2.6 percent of the world primary energy consumption. Canada’s per capita energy consumption peaked at 9.77 tons of oil equivalent in 2007 and fell to 9.03 tons of oil equivalent in 2009. Since then, Canada’s energy consumption has slowly but steadily increased. By 2017, Canada’s per capita energy consumption recovered to 9.5 tons of oil equivalent.
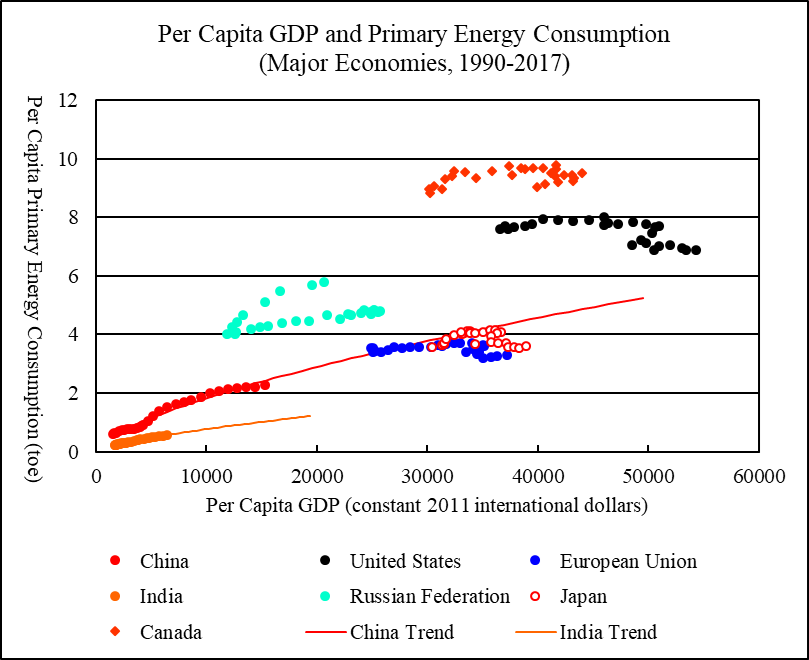
Figure 2 Per Capita GDP and Primary Energy Consumption, Major Economies, 1990-2017
Sources: Per capita primary energy consumption and per capita GDP are calculated using data for primary energy consumption, GDP, and population. National and regional primary energy consumption from 1990 to 2017 is from BP (2018). National and regional GDP from 1990 to 2016 is from World Bank (2018), extended to 2017 using growth rates reported by IMF (2018, Statistical Appendix, Table A1, A2, and A4). National and regional population from 1990 to 2016 is from World Bank (2018), extended to 2017 by assuming that the 2017 population growth rates are the same as the 2016 growth rates. To project China’s and India’s per capita primary energy consumption, a log-linear relationship is estimated between the per capita primary energy consumption and per capita GDP for the period 1990-2017. China’s and India’s GDP and population projections from 2018 to 2050 are from EIA (2017, Reference Case, Table A3 and Table J4), adjusted to make the projected GDP and population levels in 2017 matching the levels reported by World Bank (2018).
Oil: Ultimately Recoverable Resources and Peak Production
World oil production (including crude oil and natural gas liquids) was 4,387 million metric tons (92.6 million barrels per day) in 2017. Between 2007 and 2017, world oil production grew at an average annual rate of 1 percent.
Table 1 summarizes the estimated ultimately recoverable oil resources as well as the projected peak production level and year for the world’s ten largest oil producers, the rest of the world, and the world as a whole. Part 2 of this year’s World Energy Annual Report will discuss the details of oil production projections and show figures of historical and projected oil production for individual regions.
Where available data on historical production allows for the establishment of a Hubbert linearization trend with reasonably high confidence (that is, a clear downward linear trend of the annual production to cumulative production ratio can be identified), Hubbert linearization is used to estimate the region’s ultimately recoverable resources as well as the peak production level and year. This is applied to the Russian Federation, China, Brazil, and the Rest of the World.
For the other large oil producers, it is premature to apply Hubbert linearization. For Saudi Arabia, Canada, Iran, Iraq, United Arab Emirates, and Kuwait, the ultimately recoverable resources are assumed to be the sum of cumulative production and official reserves reported by BP. For the US, the Energy Information Administration’s official projection is used to project the future oil production from 2018 to 2050, extended to 2100 using Hubbert linearization (EIA 2018, Reference Case, Table A1).
World cumulative oil production up to 2017 was 192 billion metric tons. The world’s remaining recoverable oil resources are estimated to be 287 billion metric tons and ultimately recoverable oil resources are estimated to be 459 billion metric tons. By comparison, the BP Statistical Review of World Energy reports that the world oil reserves at the end of 2017 were 239 billion metric tons.
World oil production is projected to peak at 4,529 million metric tons in 2021.
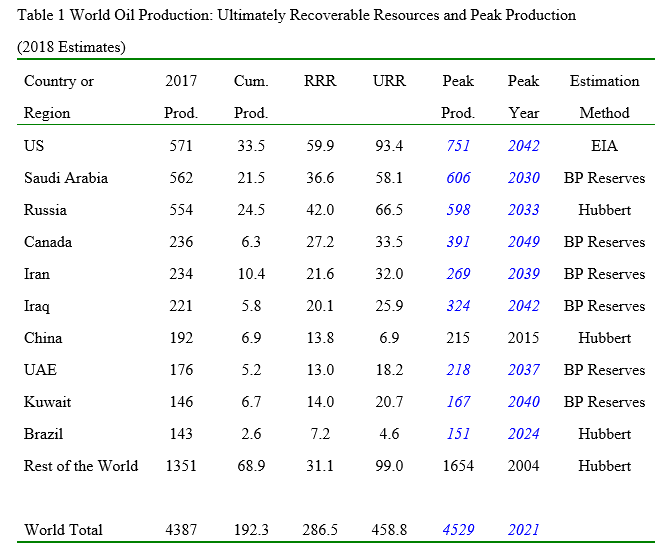
2017 Production and Peak Production are in million metric tons; Cumulative Production, RRR (remaining recoverable resources or reserves), and URR (ultimately recoverable resources) are in billion metric tons. For Peak Production and Peak Year, regular characters indicate historical peak production and year and italicized blue characters indicate theoretical peak production and year projected by statistical models. Cumulative production up to 2007 is from BGR (2009, Table A 3-2), extended to 2017 using annual production data from BP (2018).
Natural Gas: Ultimately Recoverable Resources and Peak Production
World natural gas production was 3,165 million tons of oil equivalent (3,680 billion cubic meters) in 2017. Between 2007 and 2017, world natural gas production grew at an average annual rate of 2.3 percent.
Table 2 summarizes the estimated ultimately recoverable natural gas resources as well as the projected peak production level and year for the world’s ten largest natural gas producers, the rest of the world, and the world as a whole. Part 3 of this year’s World Energy Annual Report will discuss the details of natural gas production projections and show figures of historical and projected natural gas production for individual regions.
For the “Rest of the World” (world excluding the ten largest natural gas producers), a clear downward linear trend of the annual production to cumulative production ratio can be identified for the past several years. Hubbert linearization is used to estimate the region’s ultimately recoverable natural gas resources as well as the peak production level and year.
Meaningful Hubbert linearization trends cannot yet be established for the ten largest natural gas producers. For the Russian Federation, Iran, Qatar, China, Australia, Saudi Arabia, and Algeria, the ultimately recoverable resources are assumed to be the sum of cumulative production and official reserves reported by BP. For Canada and Norway, the official reserves reported by BP appear to be too conservative. The ultimately recoverable natural gas resources estimated by the German Federal Institute for Geosciences and Natural Resources are used for the two countries (BGR 2017, Table A-15). For the US, the Energy Information Administration’s official projection is used to project the future natural gas production from 2018 to 2050, extended to 2100 using Hubbert linearization (EIA 2018, Reference Case, Table A1).
World cumulative natural gas production up to 2017 was 103 billion tons of oil equivalent. The world’s remaining recoverable natural gas resources are estimated to be 281 billion tons of oil equivalent and ultimately recoverable natural gas resources are estimated to be 384 billion tons of oil equivalent. By comparison, the BP Statistical Review of World Energy reports that the world natural gas reserves at the end of 2017 were 194 trillion cubic meters (166 billion tons of oil equivalent).
World natural gas production is projected to peak at 3,921 million tons of oil equivalent in 2036.
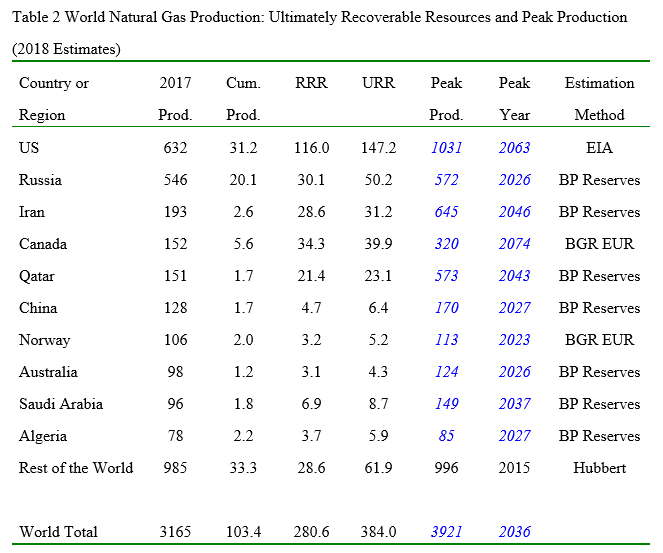
2017 Production and Peak Production are in million tons of oil equivalent; Cumulative Production, RRR (remaining recoverable resources or reserves), and URR (ultimately recoverable resources) are in billion tons of oil equivalent. For Peak Production and Peak Year, regular characters indicate historical peak production and year and italicized blue characters indicate theoretical peak production and year projected by statistical models. BGR EUR refers to the ultimately recoverable resources estimated by the German Federal Institute for Geosciences and Natural Resources. Cumulative production up to 2007 is from BGR (2009, Table A 4-2), extended to 2017 using annual production data from BP (2018).
Coal: Ultimately Recoverable Resources and Peak Production
World coal production was 7,727 million metric tons (3,769 million tons of oil equivalent) in 2017. Between 2007 and 2017, world coal production grew at an average annual rate of 1.5 percent.
Table 3 summarizes the estimated ultimately recoverable coal resources as well as the projected peak production level and year for the world’s seven largest coal producers, the rest of the world, and the world as a whole. Part 4 of this year’s World Energy Annual Report will discuss the details of coal production projections and show figures of historical and projected coal production for individual regions.
Where available data on historical production allows for the establishment of a Hubbert linearization trend with reasonably high confidence, Hubbert linearization is used to estimate the region’s ultimately recoverable resources as well as the peak production level and year. This is applied to Australia, South Africa, and the Rest of the World.
For the other large coal producers, it is premature to apply Hubbert linearization. For China, India, Indonesia, and the Russian Federation, the ultimately recoverable resources are assumed to be the sum of cumulative production and official reserves reported by BP. For the US, the Energy Information Administration’s official projection is used to project the future coal production from 2018 to 2050, extended to 2100 using Hubbert linearization (EIA 2018, Reference Case, Table A1).
World cumulative coal production up to 2017 was 192 billion metric tons. The world’s remaining recoverable coal resources are estimated to be 617 billion metric tons and ultimately recoverable coal resources are estimated to be 992 billion metric tons. By comparison, the BP Statistical Review of World Energy reports that the world coal reserves at the end of 2017 were 1,035 billion metric tons.
World coal production is projected to peak at 8,417 million metric tons in 2028.
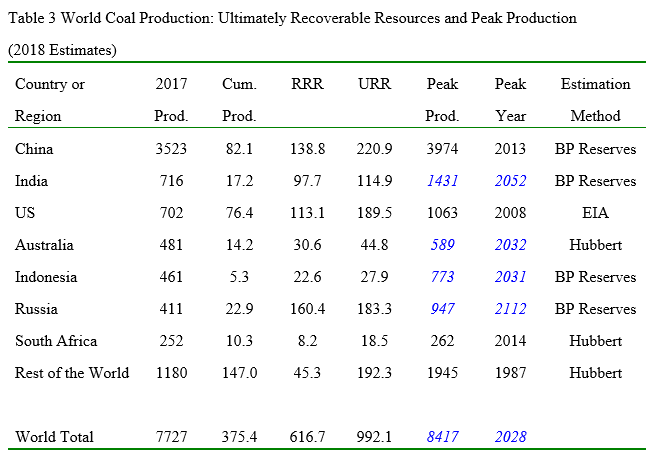
2017 Production and Peak Production are in million metric tons; Cumulative Production, RRR (remaining recoverable resources or reserves), and URR (ultimately recoverable resources) are in billion metric tons. For Peak Production and Peak Year, regular characters indicate historical peak production and year and italicized blue characters indicate theoretical peak production and year projected by statistical models. Cumulative production up to 1980 is from Rutledge (2011), extended to 2017 using annual production data from BP (2018).
World Electricity 2017
According to BP’s Statistical Review of World Energy, world electricity generation reached 25,511 terawatt-hours in 2017 (BP 2018). Between 2007 and 2017, world electricity generation grew at an average annual rate of 2.5 percent.
Electricity generation from oil was 883 terawatt-hours, accounting for 3.5 percent of the world electricity generation in 2017. Electricity generation from natural gas was 5,915 terawatt-hours, accounting for 23 percent of the world electricity generation in 2017. Electricity generation from coal was 9,723 terawatt-hours, accounting for 38 percent of the world electricity generation in 2017. Nuclear electricity generation was 2,636 terawatt-hours, accounting for 10 percent of the world electricity generation in 2017. Hydro electricity generation was 4,060 terawatt-hours, accounting for 16 percent of the world electricity generation in 2017. Non-hydro renewable electricity generation was 2,152 terawatt hours, accounting for 8.4 percent of the world electricity generation in 2017.
Renewable energies are mainly used to generate electricity. The degree of electrification will set the limit to the penetration of renewable energies from the demand side. The energy electrification index is defined as the thermal equivalent of electricity generation as a share of the world primary energy consumption. The thermal equivalent of 4.4194 terawatt-hours of electricity is one million tons of oil equivalent. This is based on the assumption of 38 percent efficiency in conventional thermal electricity generation and is the formula used by BP’s Statistical Review of World Energy to convert nuclear and renewable electricity into primary energy consumption.
Measured by the energy electrification index defined above, world energy electrification was 31 percent in 1985, 33 percent in 1990, 35 percent in 1995, 38 percent in 2000, 38 percent in 2005, 40 percent in 2010, 42 percent in 2015, and 43 percent in 2017. In average, the world energy electrification index has increased at a pace of about 2 percentage points in every five years. At this rate, the thermal equivalent of world electricity generation should account for about 55 percent of the world primary energy consumption by 2050.
The electricity de-carbonization index is defined as the electricity generation from de-carbonized sources (nuclear and renewable energies) as a share of the total electricity generation. Measured by this index, the world average degree of electricity de-carbonization was 36 percent in 1985, 36 percent in 1990, 38 percent in 1995, 36 percent in 2000, 33 percent in 2005, 33 percent in 2010, 34 percent in 2015, and 35 percent in 2017. Despite rapid growth of renewable energies in recent years, there has been virtually no progress in world-wide electricity de-carbonization since 1985. However, as wind and solar electric power continues to grow rapidly, the pace of electricity de-carbonization should accelerate in the coming years.
Figure 3 compares the historical world economic growth rates and the electricity generation growth rates from 1991 to 2017. An increase in economic growth rate by one percentage point is associated with an increase in electricity generation by 0.88 percent. R-square for the linear trend is 0.73. In 2017, world electricity generation grew by 2.5 percent, a rate that is 0.7 percentage points below what is implied by the historical trend.
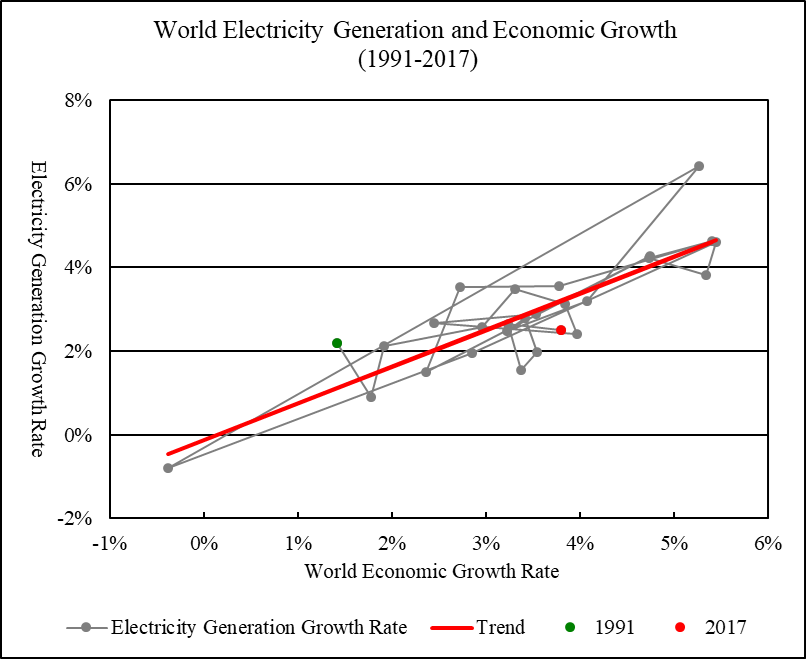
Figure 3 World Electricity Generation and Economic Growth, 1991-2017
Linear Trend: Electricity Generation Growth Rate = -0.001 + 0.878 * Economic Growth Rate (R-square = 0.725)
Sources: World electricity generation from 1990 to 2017 is from BP (2018). Gross world product in constant 2011 international dollars from 1990 to 2016 is from World Bank (2018), extended to 2017 using growth rate reported by IMF (2018, Statistical Appendix, Table A1).
Electricity Generation by Major Economies, 1990-2017
Figure 4 compares the per capita electricity generation in relation to per capita GDP for the world’s six largest national electricity generators and the European Union.
China is the world’s largest electricity generator. In 2017, China’s electricity generation reached 6,495 terawatt-hours, accounting for 25 percent of the world electricity generation. From 1990 to 2017, China’s per capita electricity generation surged from 547 kilowatt-hours to 4,686 kilowatt-hours. If China’s per capita electricity generation were to follow its historical trend in relation to per capita GDP, China’s per capita electricity generation would rise to 15,573 kilowatt-hours by 2050. As China’s population is projected to be 1.36 billion by 2050, China’s total electricity demand will be about 21,000 terawatt-hours by 2050. In term of generation capacity, this is equivalent to the electricity generation by 4,800 gigawatts of coal-fired power plants with 50 percent capacity utilization or by 16,000 gigawatts of solar electric power plants with 15 percent capacity utilization.
The US is the world’s second largest electricity generator. In 2017, the US electricity generation was 4,282 terawatt-hours, accounting for 17 percent of the world electricity generation. The US per capita electricity generation peaked at 14,712 kilowatt-hours in 2007. Since then, the US per capita electricity generation has trended down, falling to 13,160 kilowatt-hours by 2017.
European Union is the world’s third largest electricity generator. In 2017, the European Union’s electricity generation was 3,287 terawatt-hours, accounting for 13 percent of the world electricity generation. The EU per capita electricity generation peaked at 6,770 kilowatt-hours in 2006. The EU per capita electricity generation fell to 6,272 kilowatt-hours in 2014 and recovered to 6,406 kilowatt-hours in 2017.
India is the world’s fourth largest electricity generator. In 2017, India’s electricity generation rose to 1,497 terawatt-hours, accounting for 5.9 percent of the world electricity generation. As India’s economy grew rapidly, India’s per capita electricity generation grew from 331 kilowatt-hours in 1990 to 1,118 kilowatt-hours in 2017. If India’s per capita electricity generation continues to follow its historical trend in relation to per capita GDP, India’s per capita electricity generation will rise to 2,731 kilowatt-hours by 2050. As India’s population is projected to grow to 1.72 billion by 2050, India’s total electricity demand will be about 4,700 terawatt-hours by 2050. In term of generation capacity, this is equivalent to the electricity generation by 1,070 gigawatts of coal-fired power plants with 50 percent capacity utilization or by about 3,600 gigawatts of solar electric power plants with 15 percent capacity utilization.
The Russian Federation is the world’s fifth largest electricity generator. In 2017, Russia’s electricity generation was 1,091 terawatt-hours, accounting for 4.3 percent of the world electricity generation. From 1990 to 1998, Russia’s per capita electricity generation fell from 7,298 kilowatt-hours to 5,601 kilowatt-hours. Since then, Russia’s electricity generation has grown steadily. In 2017, Russia’s per capita electricity generation reached 7,547 kilowatt-hours.
Japan is the world’s sixth largest electricity generator. In 2017, Japan’s electricity generation was 1,020 terawatt-hours, accounting for 4 percent of the world electricity generation. Japan’s per capita electricity generation peaked at 9,243 kilowatt-hours in 2008. By 2016, Japan’s per capita electricity generation fell to 7,893 kilowatt-hours. In 2017, Japan’s per capita electricity generation recovered to 8,041 kilowatt-hours.
Canada is the world’s seventh largest electricity generator and has the highest per capita electricity generation among the world’s major economies. In 2017, Canada’s electricity generation was 693 terawatt-hours, accounting for 2.7 percent of the world electricity generation. Canada’s per capita electricity generation peaked at 19,624 kilowatt-hours in 2000. In recent years, Canada’s per capita electricity generation has stayed above 18,000 kilowatt-hours. In 2017, Canada’s per capita electricity generation was 18,893 kilowatt-hours.
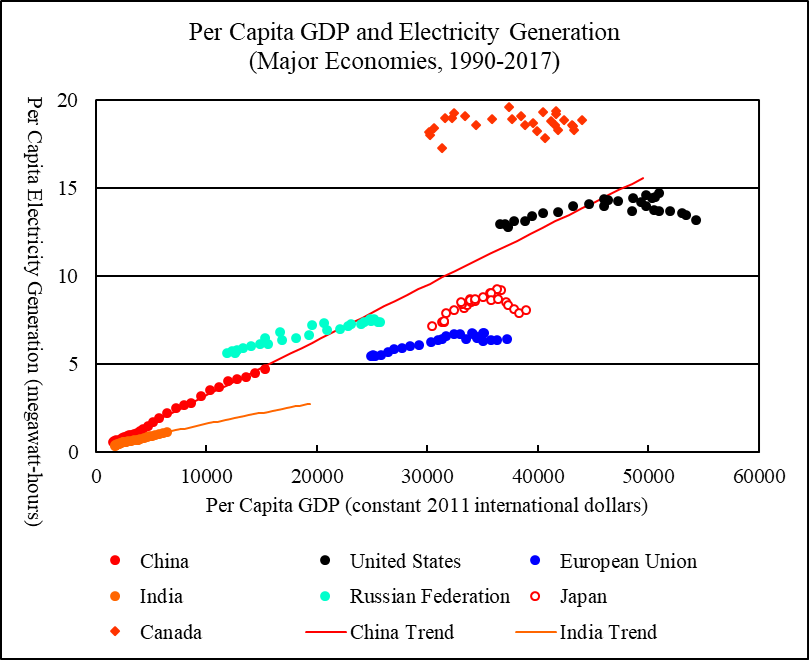
Figure 4 Per Capita GDP and Electricity Generation, Major Economies, 1990-2017
Sources: Per capita electricity generation and per capita GDP are calculated using data for electricity generation, GDP, and population. National and regional electricity generation from 1990 to 2017 is from BP (2018). National and regional GDP from 1990 to 2016 is from World Bank (2018), extended to 2017 using growth rates reported by IMF (2018, Statistical Appendix, Table A1, A2, and A4). National and regional population from 1990 to 2016 is from World Bank (2018), extended to 2017 by assuming that the 2017 population growth rates are the same as the 2016 growth rates. To project China’s and India’s per capita electricity generation, a log-linear relationship is estimated between the per capita electricity generation and per capita GDP for the period 1990-2017. China’s and India’s GDP and population projections from 2018 to 2050 are from EIA (2017, Reference Case, Table A3 and Table J4), adjusted to make the projected GDP and population levels in 2017 matching the levels reported by World Bank (2018).
Wind and Solar Electricity
In 2017, world consumption of wind electricity was 1,123 terawatt-hours, accounting for 4.4 percent of the world electricity generation; world consumption of solar electricity was 443 terawatt-hours, accounting for 1.7 percent of the world electricity generation.
Wind and solar are renewable energy resources. However, wind and solar electricity is intermittent. Integration of wind and solar electricity into electric grids requires maintaining a large backup generating capacity or large-scale storage technologies that are yet to be developed. In the long run, wind and solar electricity will also be limited by the availability of land and mineral resources.
Despite these limitations, it is not unreasonable to assume that wind and solar electricity is likely to keep growing through the 21st century. I assume that the total or cumulative installation of wind and solar electric power will keep growing in the future. However, I assume that the annual installation of wind and solar electric power (that is, the annual addition to cumulative installation) will rise to a plateau and then stabilize.
In 2017, the world installed 47 gigawatts of wind generating capacity and 97 gigawatts of solar generating capacity. Figure 5 compares the historical relationship between the annual installation of wind and solar generating capacity and the annual growth to the annual installation ratio from 2007 to 2017. The annual growth to annual installation ratios fluctuate wildly between individual years. To smooth out the fluctuations and establish a more reliable linear trend, I use ten-year trailing averages of the annual ratios. The downward linear trend indicates that the annual installation of wind and solar generating capacity should eventually approach the maximum of 566 gigawatts (where the linear trend meets the zero horizontal line). The regression R-square is very high (0.87).
The parameters of the linear trend shown in Figure 5 can be used to project the future installation of wind and solar generating capacity. The world’s cumulative installation of wind and solar generating capacity is projected to rise to about 16,400 gigawatts by 2050 (Figure 6). By comparison, the US Energy Information Administration projects that the world’s total installed generation capacity of all types of electric power will be about 9,800 gigawatts by 2050 (EIA 2017, Reference Case, Table H-1).
The future wind and solar electricity generation can be estimated using the following formula:
Electricity Generation (current year)
= (Beginning-of-year Generating Capacity + End-of-year Generating Capacity) / 2 * 8760 Hours * Capacity Utilization Rate
In 2017, the observed world average wind electric power capacity utilization rate was 26.1 percent; the observed world average solar electric power capacity utilization rate was 14.4 percent; the observed world average wind and solar electric power capacity utilization rate was 21.2 percent. From 1997 to 2017, the world average wind and solar electric power capacity utilization rate averaged 21.6 percent. These capacity utilization rates are calculated using wind and solar electricity consumption and generating capacity data provided by BP (2018).
I assume that from 2018 to 2050, the world average wind and solar electric power capacity utilization rate will be 21.6 percent.
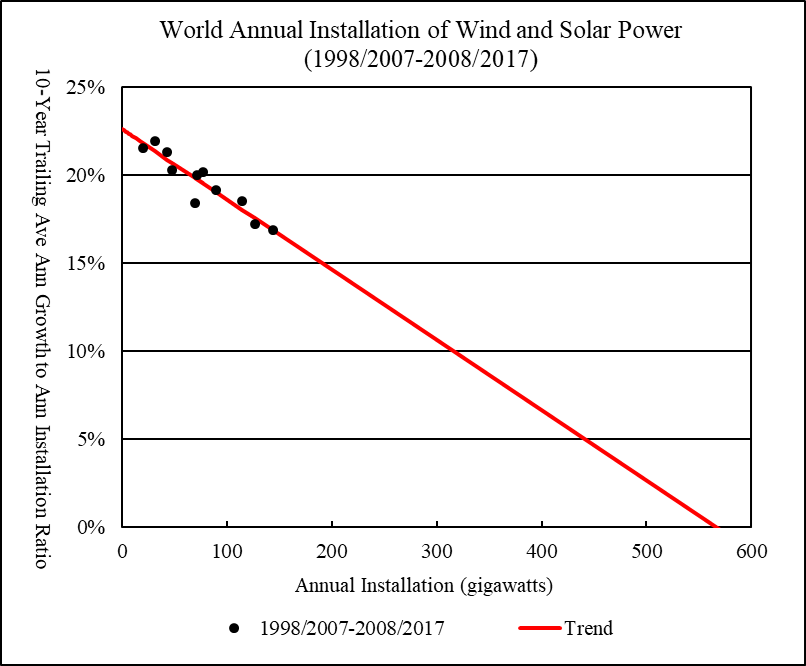
Figure 5 World Annual Installation of Wind and Solar Power, 1998/2007-2008/2017
Sources: Annual installation of wind and solar generating capacity from 1997 to 2017 is calculated using cumulative installation data from BP (2018).
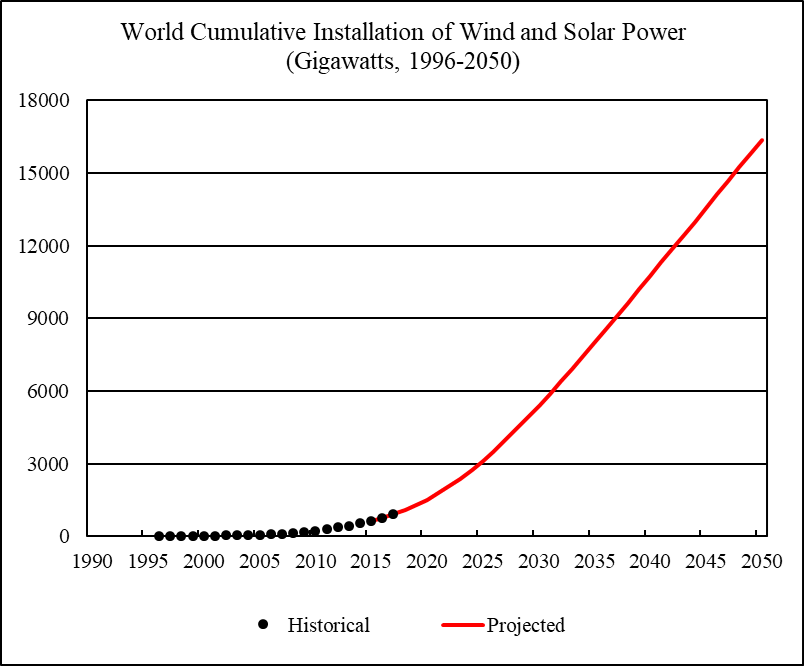
Figure 6 World Cumulative Installation of Wind and Solar Power, 1996-2050
Sources: Cumulative installation of wind and solar generating capacity from 1996 to 2017 is from BP (2018).
World Energy 2018-2050
Figure 7 shows the historical and projected world primary energy consumption from 1950 to 2050.
World historical consumption of oil, natural gas, and coal from 1950 to 1964 is estimated using carbon dioxide emissions from fossil fuels burning (Boden, Marland, and Andres 2017).
World primary energy consumption and its composition from 1965 to 2017 is from BP (2018).
World oil consumption from 2018 to 2050 is assumed to be the same as the sum of the world oil production and world biofuels production. Future world oil production is based the projections reported by Table 1. Oil in metric tons is converted to oil equivalent using the formula: 1 metric ton of oil production = 1.034 tons of oil equivalent (using the observed world average ratio in 2017). Future world biofuels production is based on the US Energy Information Administration’s projection (EIA 2017, Reference Case, Table G3), adjusted to make the projected biofuels production level in 2017 matching the level reported by BP.
World consumption of natural gas and coal from 2018 to 2050 is assumed to be the same as production. Future natural and coal production is based the projections reported by Table 2 and 3. Coal in metric tons is converted to oil equivalent using the formula: 1 metric ton of coal = 0.488 tons of oil equivalent (using the observed world average ratio in 2017).
World consumption of wind and solar electricity from 2018 to 2050 is based on the projections shown in Figure 5 and Figure 6.
To project the future nuclear electricity consumption, I use the US Energy Information Administration’s projection of net nuclear electricity generation (EIA 2017, Reference Case, Table H16), adjusted to make the projected nuclear electricity generation in 2017 matching the level reported by BP (2018).
To project the future hydro electricity consumption, I use the US Energy Information Administration’s projection of net hydro electricity generation (EIA 2017, Reference Case, Table H18), adjusted to make the projected hydro electricity generation in 2017 matching the level reported by BP (2018).
To project the future consumption of geothermal, biomass and other renewable electricity, I use the US Energy Information Administration’s projection of net geothermal electricity generation and net other renewable electricity generation (EIA 2017, Reference Case, Table H20 and H22), adjusted to make the projected sum of net geothermal and other renewable electricity generation in 2017 matching the level reported by BP (2018).
World consumption of nuclear, hydro, wind, solar, geothermal, biomass, and other renewable electricity from 2018 to 2050 is converted to their thermal equivalent using the formula: 4.4194 terawatt-hours = 1 million tons of oil equivalent.
World primary energy consumption is projected to rise to near 20,000 million tons of oil equivalent by 2050. Oil is projected to account for 19 percent of the world primary energy consumption in 2050, natural gas will account for 18 percent, coal will account for 15 percent, nuclear electricity will account for 4.4 percent, hydro electricity will account for 7.4 percent, wind and solar electricity will account for 35 percent, other renewable electricity will account for 1.4 percent.
World carbon dioxide emissions from fossil fuels burning are projected to peak at 36.5 billion metric tons in 2028. Part 5 of this year’s World Energy Annual Report will discuss the details of carbon dioxide emissions projections and the implications for climate change.
The International Monetary Fund predicts that the world economic growth rate in 2018 will be 3.9 percent (IMF 2018, Statistical Appendix, Table A1). For 2019-2050, global economic growth rate is estimated by using the linear relationship between the primary energy consumption growth rate and the economic growth rate observed for the period 1991-2017:
Economic Growth Rate = (Primary Energy Consumption Growth Rate + 0.012) / 0.914
Figure 8 shows the historical and projected world economic growth rates from 1991 to 2050. World average economic growth rate is projected to fall from 3.7 percent in 2001-2010 and 3.6 percent in 2011-2020, to 3.1 percent in 2021-2030, 2.4 percent in 2031-2040, and 1.9 percent in 2041-2050.
Since the end of the Second World War, global economic growth rate has fallen below 2 percent only in several occasions. During 1913-1950, when the global capitalist system suffered from major wars, revolutions, and the Great Depression, world economy actually grew at an average annual rate of 1.8 percent (Maddison 2010). Thus, by the mid-21st century, although the global economy will continue to grow, world economic growth rate may become too low for the global capitalist system to maintain economic and social stability.
Table 4 summarizes the main findings of this year’s World Energy Annual Report.
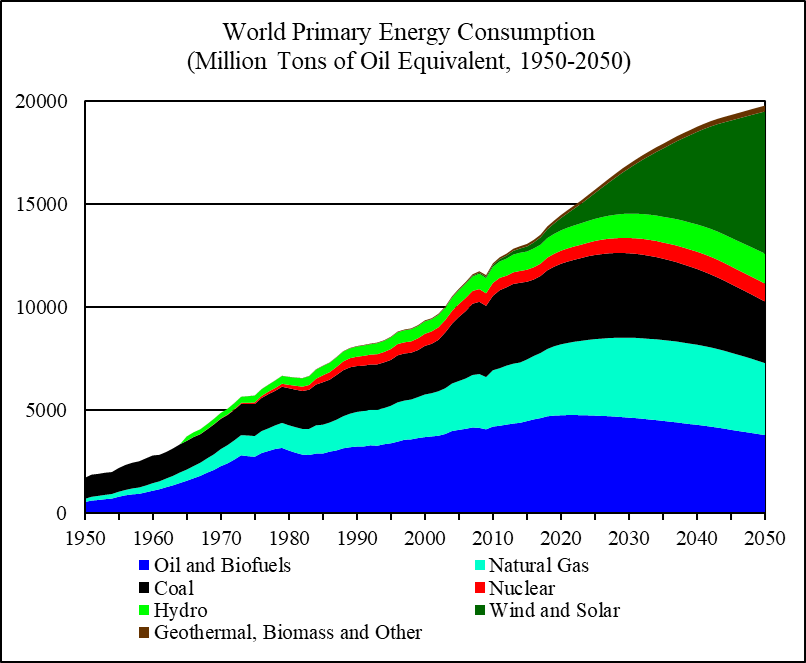
Figure 7 World Primary Energy Consumption, 1950-2050
Sources: World historical oil, natural gas, and coal consumption from 1950 to 1964 is estimated from carbon dioxide emissions (Boden, Marland, and Andres 2017); world primary energy consumption and its composition from 1965 to 2017 is from BP (2018); world primary energy consumption and its composition from 2018 to 2050 is based on this report’s projections.
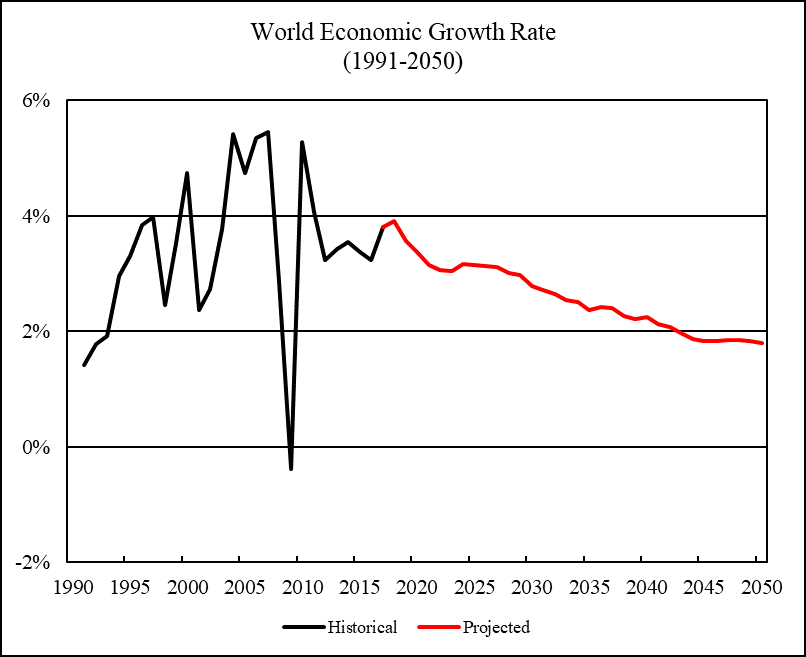
Figure 8 World Economic Growth Rate, 1991-2050
Sources: World economic growth rates from 1991 to 2016 are from World Bank (2018); world economic growth rates in 2017 and 2018 are from IMF (2018, Statistical Appendix, Table A1); world economic growth rates from 2019 to 2050 are based on this report’s projections.
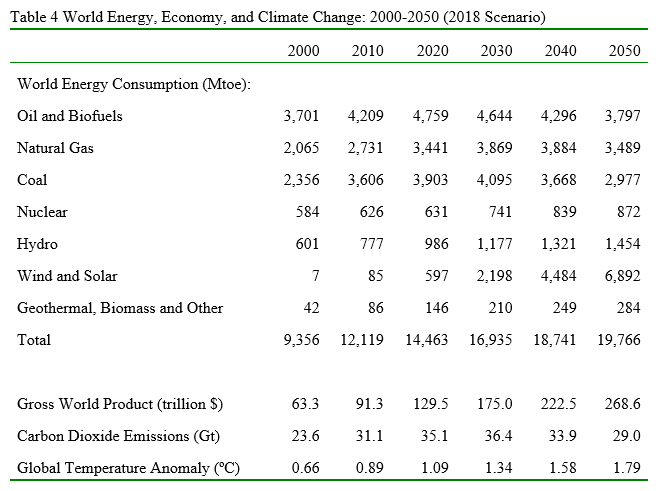
Mtoe: million tons of oil equivalent.
$: constant 2011 international dollars.
Gt: giga-tons or billion metric tons.
Global Temperature Anomaly: ten-year trailing average of the difference between the global average surface temperature and the 1880-1920 global average surface temperature.


Anonymous on Fri, 29th Jun 2018 7:26 am
It’s pretty rich and I appreciate how he uses a mix of different methods (BP, EIA, Hubbert, German) with some comments on why some numbers don’t make sense in every method so you are forced to. But despite the richness, something about it made it hard to read. Seemed long and list-y. Maybe low on the “so what” or the “story”.
Probably more interesting would be if he as “chapter 0” gave (1) a summary of the major results (2) comparison to previous years (how much drifted since last years, since 5 years ago) and (3) what he changed this year in terms of methodology–is interesting if he is learning something not just about the content but how to study it.
MASTERMIND on Fri, 29th Jun 2018 7:50 am
US oil production not peaking until the 2040’s.. LOL
And its nice how the good professor cheery picked his chart of global GDP starting in 1990 instead of going back to the 1970’s or further when the OECD started to decline..
https://imgur.com/a/pYxKa
MASTERMIND on Fri, 29th Jun 2018 8:00 am
The moron who runs this site Dennis believes that we will have a fast transition to solar and wind..How you could run an energy blog and believe in solar and wind is astonishing..I tried to argue with him once and he deleted my comments and blocked me..
Antius on Fri, 29th Jun 2018 10:40 am
“The moron who runs this site Dennis believes that we will have a fast transition to solar and wind..How you could run an energy blog and believe in solar and wind is astonishing..I tried to argue with him once and he deleted my comments and blocked me..”
Don’t laugh too loud. The Western world is wandering blindly into an energy crisis. Having failed miserably to replace fossil fuels with nuclear energy; what meagre investments Western nations are making are focused on natural gas, wind and solar.
But here is the interesting thing. Wind and solar power are relatively expensive from a whole systems point of view, because we presently have to use back-up and storage to counter intermittency. Trying to store electricity with the intention of turning it back into electricity, tends to be capital intensive, inefficient and wasteful. If we are prepared and able to accept an intermittent power supply, then on a kWh basis, a wind/solar electricity system will be no more expensive than coal or nuclear. Let me introduce you to the next big thing for electricity customers:
https://en.m.wikipedia.org/wiki/Rolling_blackout
If we can collectively adapt to an intermittent power supply with demand management, limited backup and end-use storage, the transition to renewable energy will be much easier and more rapid. But it will necessitate a very different was of life. We would generally need to use power when it is there and curtail use when it is not.
I would personally rather see a large increase in the use of non-intermittent, nuclear energy. With large scale economies it will produce low-cost 24/7 power and would therefore allow much higher living standards. But a rapid transition to renewable energy is also workable. Just don’t expect life to be anything like the one you are accustomed to.
Davy on Fri, 29th Jun 2018 12:19 pm
“If we can collectively adapt to an intermittent power supply with demand management, limited backup and end-use storage, the transition to renewable energy will be much easier and more rapid.”
For this to work we need less people, seasonality with food, localization with transport, and the elimination of discretionary economic industries. Education and people power must be strong. Morale must drive people to prepare for hardship but for a higher goal. Leisure and consumerism would have to end. This is part of the answer and the problem. Systematically we have a globalized economy that delivers production and distribution through economies of scale, comparative advantage, and trust based capital flows. Nothing likely can equal globalism in productive capacity. The above changes are not conducive to globalism. Economically we are close to economic dangers from any slowdown now with global growth. Can you imagine a disruptive action like leaving the basic features of globalism and what that would do to the global economy? We could say happiness levels can be achieve in another way but generally human satisfaction comes from affluence. Less globalism likely means less affluence. It is likely the case that globalism as we know it can’t be changed to transition to an alternative without mass loss of life.
It is possible over long time frames this might be achieved locally and regionally. Some areas are sweet spots for alternatives to globalism. “ALL” mega population regions likely are not. “ALL” regions in adverse climatic areas are likely not. “ALL” areas requiring high consumption to maintain big populations are not. So theoretically humans can adapt to intermittency, seasonality, localization, and demand management with the help of technology but this likely can only occur in some areas and while globalism is alive and well. We may be able to build refuges in these places to house survivors of the end of globalism. This is all theoretical because if collapse sets in people will go where they can survive and this areas of refuge will be taken over by migration and destroyed. Some may protect themselves but many will not. The cost of security is huge and beyond most refuge’s abilities. Systematically it may be the case that we just cannot change what we have. We can try to extend it and we can prepare people for pain and suffering.
Cloggie on Fri, 29th Jun 2018 12:39 pm
“The moron who runs this site Dennis believes that we will have a fast transition to solar and wind..How you could run an energy blog and believe in solar and wind is astonishing.”
Now the reality as brought to our attention by the IEA, millimind loves so much to quote:
https://mobile.twitter.com/i/web/status/1012616217625092096
“In March, #renewables accounted for nearly 2/5ths of all OECD Europe electricity generation (38.3%) – a higher share than the combined output of coal and gas (36.6%)”
“Yabut, solar and wind only 1%.lol”
Pssst, renewables are winning, for starters in Europe.
Makati1 on Sat, 30th Jun 2018 5:55 am
And the dream continues. lol