Peak Oil is You

Donate Bitcoins ;-) or Paypal :-)
Page added on February 8, 2016
The Physics of Energy and the Economy

I approach the subject of the physics of energy and the economy with some trepidation. An economy seems to be a dissipative system, but what does this really mean? There are not many people who understand dissipative systems, and very few who understand how an economy operates. The combination leads to an awfully lot of false beliefs about the energy needs of an economy.
The primary issue at hand is that, as a dissipative system, every economy has its own energy needs, just as every forest has its own energy needs (in terms of sunlight) and every plant and animal has its own energy needs, in one form or another. A hurricane is another dissipative system. It needs the energy it gets from warm ocean water. If it moves across land, it will soon weaken and die.
There is a fairly narrow range of acceptable energy levels–an animal without enough food weakens and is more likely to be eaten by a predator or to succumb to a disease. A plant without enough sunlight is likely to weaken and die.
In fact, the effects of not having enough energy flows may spread more widely than the individual plant or animal that weakens and dies. If the reason a plant dies is because the plant is part of a forest that over time has grown so dense that the plants in the understory cannot get enough light, then there may be a bigger problem. The dying plant material may accumulate to the point of encouraging forest fires. Such a forest fire may burn a fairly wide area of the forest. Thus, the indirect result may be to put to an end a portion of the forest ecosystem itself.
How should we expect an economy to behave over time? The pattern of energy dissipated over the life cycle of a dissipative system will vary, depending on the particular system. In the examples I gave, the pattern seems to somewhat follow what Ugo Bardi calls a Seneca Cliff.
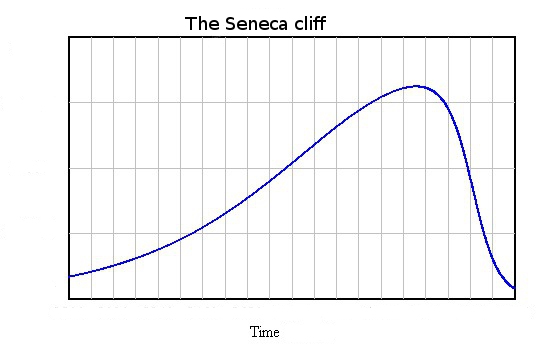
Figure 1. Seneca Cliff by Ugo Bardi
The Seneca Cliff pattern is so-named because long ago, Lucius Seneca wrote:
It would be some consolation for the feebleness of our selves and our works if all things should perish as slowly as they come into being; but as it is, increases are of sluggish growth, but the way to ruin is rapid.
The Standard Wrong Belief about the Physics of Energy and the Economy
There is a standard wrong belief about the physics of energy and the economy; it is the belief we can somehow train the economy to get along without much energy.
In this wrong view, the only physics that is truly relevant is the thermodynamics of oil fields and other types of energy deposits. All of these fields deplete if exploited over time. Furthermore, we know that there are a finite number of these fields. Thus, based on the Second Law of Thermodynamics, the amount of free energy we will have available in the future will tend to be less than today. This tendency will especially be true after the date when “peak oil” production is reached.
According to this wrong view of energy and the economy, all we need to do is design an economy that uses less energy. We can supposedly do this by increasing efficiency, and by changing the nature of the economy to use a greater proportion of services. If we also add renewables (even if they are expensive) the economy should be able to get along fine with very much less energy.
These wrong views are amazingly widespread. They seem to underlie the widespread hope that the world can reduce its fossil fuel use by 80% between now and 2050 without badly disturbing the economy. The book 2052: A Forecast for the Next 40 Years by Jorgen Randers seems to reflect these views. Even the “Stabilized World Model” presented in the 1972 book The Limits to Growth by Meadow et al. seems to be based on naive assumptions about how much reduction in energy consumption is possible without causing the economy to collapse.
The Economy as a Dissipative System
If an economy is a dissipative system, it needs sufficient energy flows. Otherwise, it will collapse in a way that is analogous to animals succumbing to a disease or forests succumbing to forest fires.
The primary source of energy flows to the economy seems to come through the leveraging of human labor with supplemental energy products of various types, such as animal labor, fossil fuels, and electricity. For example, a man with a machine (which is made using energy products and operates using energy products) can make more widgets than a man without a machine. A woman operating a computer in a lighted room can make more calculations than a woman who inscribes numbers with a stick on a clay tablet and adds them up in her head, working outside as weather permits.
As long as the quantity of supplemental energy supplies keeps rising rapidly enough, human labor can become increasingly productive. This increased productivity can feed through to higher wages. Because of these growing wages, tax payments can be higher. Consumers can also have ever more funds available to buy goods and services from businesses. Thus, an economy can continue to grow.
Besides inadequate supplemental energy, the other downside risk to continued economic growth is the possibility that diminishing returns will start making the economy less efficient. These are some examples of how this can happen:
- Deeper wells or desalination are needed for water because aquifers deplete and population grows.
- More productivity is needed from each acre of arable land because of growing population (and thus, falling arable land per person).
- Larger mines are required as ores of high mineral concentration are exhausted and we are forced to exploit less productive mines.
- More pollution control devices or higher-cost workarounds (such as “renewables”) are needed as pollution increases.
- Fossil fuels from cheap-to-extract locations are exhausted, so extraction must come from more difficult-to-extract locations.
In theory, even these diminishing returns issues can be overcome, if the leveraging of human labor with supplemental energy is growing quickly enough.
Theoretically, technology might also increase economic growth. The catch with technology is that it is very closely related to energy consumption. Without energy consumption, it is not possible to have metals. Most of today’s technology depends (directly or indirectly) on the use of metals. If technology makes a particular type of product cheaper to make, there is also a good chance that more products of that type will be sold. Thus, in the end, growth in technology tends to allow more energy to be consumed.
Why Economic Collapses Occur
Collapses of economies seem to come from a variety of causes. One of these is inadequate wages of low-ranking workers (those who are not highly educated or of managerial rank). This tends to happen because if there are not enough energy flows to go around, it tends to be the wages of the “bottom-ranking” employees that get squeezed. In some cases, not enough jobs are available; in others, wages are too low. This could be thought of as inadequate return on human labor–a different kind of low Energy Return on Energy Invested (EROEI) than is currently analyzed in most of today’s academic studies.
Another area vulnerable to inadequate energy flows is the price level of commodities. If energy flows are inadequate, prices of commodities will tend to fall below the cost of producing these commodities. This can lead to a cut off of commodity production. If this happens, debt related to commodity production will also tend to default. Defaulting debt can be a huge problem, because of the adverse impact on financial institutions.
Another way that inadequate energy flows can manifest themselves is through the falling profitability of companies, such as the falling revenue that banks are now experiencing. Still another way that inadequate energy flows can manifest themselves is through falling tax revenue. Governments of commodity exporters are particularly vulnerable when commodity prices are low. Ultimately, these inadequate energy flows can lead to bankrupt companies and collapsing governments.
The closest situation that the US has experienced to collapse is the Depression of the 1930s. The Great Recession of 2007-2009 would represent a slight case of inadequate energy flows–one that could be corrected by a large dose of Quantitative Easing (QE)(leading to the lower cost of borrowing), plus debt stimulus by China. These helped bring oil prices back up again, after they fell in mid-2008.
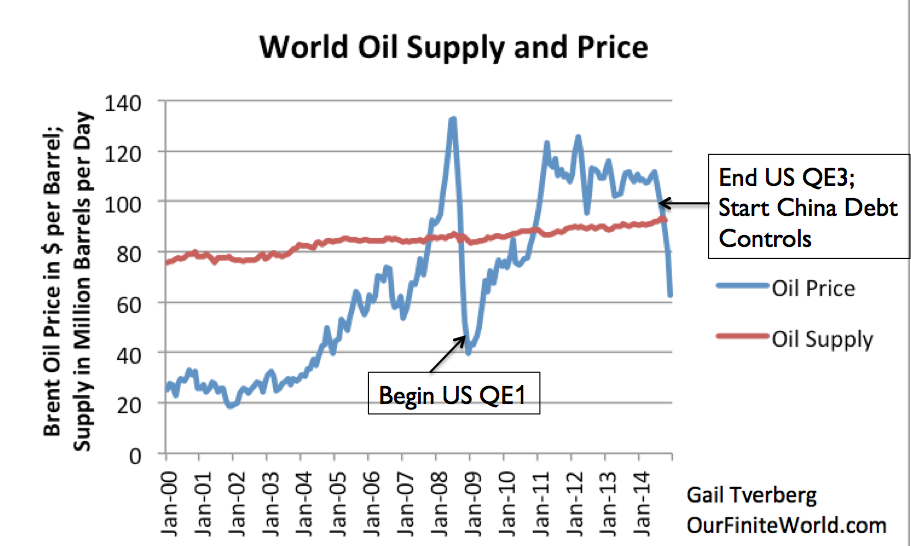
Figure 2. World Oil Supply (production including biofuels, natural gas liquids) and Brent monthly average spot prices, based on EIA data.
Clearly, we are now again beginning to experience the effects of inadequate energy flows. This is worrying, because many economies have collapsed in the past when this situation occurred.
How Energy Flows of an Economy are Regulated
In an economy, the financial system is the regulator of the energy flows of the system. If the price of a product is low, it dictates that a small share of energy flows will be directed toward that product. If it is high, it indicates that a larger share of energy flows will be directed toward that product. Wages follow a similar pattern, with low wages indicating low flows of energy, and high wages indicating higher flows of energy. Energy flows in fact “pay for” all aspects of the system, including more advanced technology and the changes to the system (more education, less time in the workforce) that make advanced technology possible.
One confusing aspect to today’s economy is the use of a “pay you later” approach to paying for energy flows. If the energy flows are inadequate using what we would think of as the natural flows of the system, debt is often used to increase energy flows. Debt has the effect of directing future energy flows in a particular direction, such as paying for a factory, a house, or a car. These flows will be available when the product is already part of the system, and thus are easier to accommodate in the system.
The use of increasing debt allows total “demand” for products of many kinds to be higher, because it directs both future flows and current flows of energy toward a product. Since factories, houses and cars are made using commodities, the use of an increasing amount of debt tends to raise commodity prices. With higher commodity prices, more of the resources of the economy are directed toward producing energy products. This allows for increasing energy consumption. This increased energy consumption tends to help flows of energy to many areas of the economy at the same time: wages, taxes, business profitability, and funds for interest and dividend payments.
The need for debt greatly increases when an economy begins using fossil fuels, because the use of fossil fuels allows a step-up in lifestyle. There is no way that this step-up in lifestyle can be paid for in advance, because the benefits of the new system are so much better than what was available without fossil fuels. For example, a farmer raising crops using only a hoe for a tool will never be able to save up sufficient funds (energy flows) needed to pay for a tractor. While it may seem bizarre that banks loan money into existence, this approach is in fact essential, if adequate energy flows are to be available to compensate for the better lifestyle that the use of fossil fuels makes possible.
Debt needs are low when the cost (really energy cost) of producing energy products is low. Much more debt is needed when the cost of energy extraction is high. The reason more debt is needed is because fossil fuels and other types of energy products tend to leverage human labor, making human labor more productive, as mentioned previously. In order to maintain this leveraging, an adequate quantity of energy products (measured in British Thermal Units or Barrels of Oil Equivalent or some similar unit) is needed.
As the required price for energy-products rises, it takes ever-more debt to finance a similar amount of energy product, plus the higher cost of homes, cars, factories, and roads using the higher-cost energy. In fact, with higher energy costs, capital goods of all kinds will tend to be more expensive. This is a major reason why the ratio of debt to GDP tends to rise as the cost of producing energy products rises. At this point, in the United States it takes approximately $3 of additional debt to increase GDP by $1 (author’s calculation).
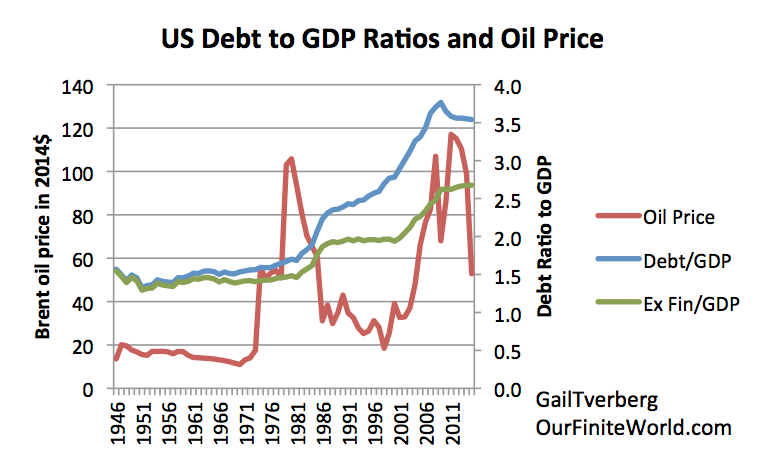
Figure 3. Inflation adjusted Brent oil prices (in $2014, primarily from BP Statistical Review of World Energy) shown beside two measures of debt for the US economy. One measure of debt is all-inclusive; the other excludes Financial Business debt. Both are based on data from FRED-Federal Reserve of St. Louis.
Clearly one of the risk factors to an economy using fossil fuels is that debt levels will become unacceptably high. A second risk is that debt will stop rising fast enough to keep commodity prices at an acceptably high level. The recent slowdown in the growth of debt (Figure 3) no doubt contributes to current low commodity prices.
A third risk to the system is that the rate of economic growth will slow over time because even with the large amount of debt added to the system, the leveraging of human labor with supplemental energy will not be sufficient to maintain economic growth in the face of diminishing returns. In fact, it is clearly evident that US economic growth has trended downward over time (Figure 4).
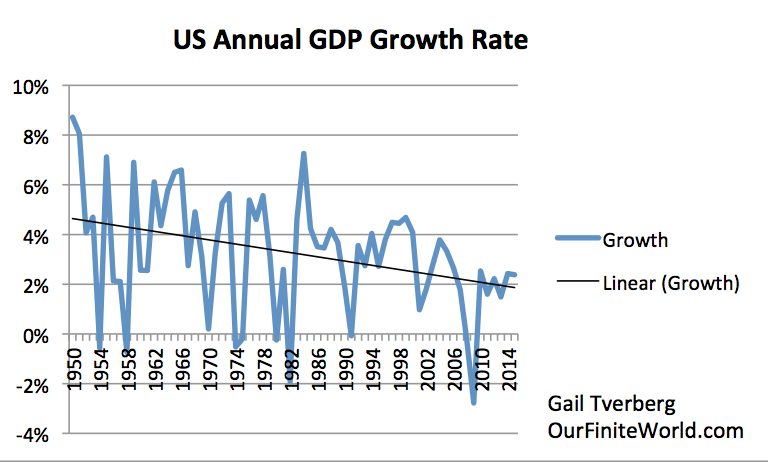
Figure 4. US annual growth rates (using “real” or inflation adjusted data from the Bureau of Economic Analysis).
A fourth risk is that the whole system will become unsustainable. When new debt is issued, there is no real matching with future energy flow. For example, will the wages of those taking on debt to pay for college be sufficiently high that the debtors can afford to have families and buy homes? If not, their lack of adequate income will be one of the factors that make it difficult for the prices of commodities to stay high enough to encourage extraction.
One of the issues in today’s economy is that promises of future energy flows extend far beyond what is formally called debt. These promises include shareholder dividends and payments under government programs such as Social Security and Medicare. Reneging on promises such as these is likely to be unpopular with citizens. Stock prices are likely to drop, and private pensions will become unpayable. Governments may be overthrown by disappointed citizens.
Examples of Past Collapses of Economies
Example of the Partial Collapse of the Former Soviet Union
One recent example of a partial collapse was that of the Former Soviet Union (FSU) in December 1991. I call this a partial collapse, because it “only” involved the collapse of the central government that held together the various republics. The governments of the individual republics remained in place, and many of the services they provided, such as public transportation, continued. The amount of manufacturing performed by the FSU dropped precipitously, as did oil extraction. Prior to the collapse, the FSU had serious financial problems. Shortly before its collapse, the world’s leading industrial nations agreed to lend the Soviet Union $1 billion and defer repayment on $3.6 billion more in debt.
A major issue that underlay this collapse was a fall in oil prices to the $30 per barrel range in the 1986 to 2004 period. The Soviet Union was a major oil exporter. The low price had an adverse impact on the economy, a situation similar to that today.

Figure 5. Oil production and price of the Former Soviet Union, based on BP Statistical Review of World Energy 2015.
Russia continued to pump oil even after the price dropped in 1986. In fact, it raised oil production, to compensate for the low price (energy flow it received per barrel). This is similar to the situation today, and what we would expect if oil exporters are very dependent on these energy flows, no matter how small. Oil production didn’t fall below the 1986 level until 1989, most likely from inadequate funds for reinvestment. Oil production rose again, once prices rose.
Figure 6 shows that the FSU’s consumption of energy products started falling precipitously in 1991, the year of the collapse–very much a Seneca Cliff type of decline.
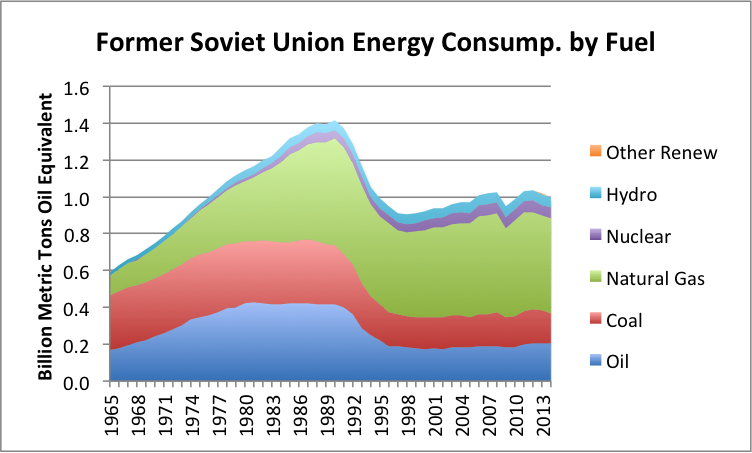
Figure 6. Former Soviet Union energy consumption by source, based on BP Statistical Review of World Energy Data 2015.
In fact, consumption of all fuels, even nuclear and hydroelectric, fell simultaneously. This is what we would expect if the FSU’s problems were caused by the low prices it was receiving as an oil exporter. With low oil prices, there could be few good-paying jobs. Lack of good-paying jobs–in other words, inadequate return on human labor–is what cuts demand for energy products of all kinds.
A drop in population took place as well, but it didn’t begin until 1996. The decrease in population continued until 2007. Between 1995 and 2007, population dropped by a total of 1.6%, or a little over 0.1% per year. Before the partial collapse, population was rising about 0.9% per year, so the collapse seems to have reduced the population growth rate by about 1.0% per year. Part of the drop in population was caused by excessive alcohol consumption by some men who had lost their jobs (their sources of energy flows) after the fall of the central government.
When commodity prices fall below the cost of oil production, it is as if the economy is cold because of low energy flows. Prof. Francois Roddier describes the point at which collapse sets in as the point of self-organized criticality. According to Roddier (personal correspondence):
Beyond the critical point, wealth condenses into two phases that can be compared to a gas phase and a liquid phase. A small number of rich people form the equivalent of a gas phase, whereas a large number of poor people form what corresponds to a liquid phase. Like gas molecules, rich people monopolize most of the energy and have the freedom to move. Embedded in their liquid phase, poor people have lost access to both energy and freedom. Between the two, the so-called middle class collapses.
I would wonder whether the ones who die would be equivalent to the solid state. They can no longer move at all.
Analysis of Earlier Collapses
A number of studies have been performed analyzing earlier collapses. Turchin and Nefedov in Secular Cycles analyze eight pre-fossil fuel collapses in detail. Figure 7 shows my interpretation of the pattern they found.
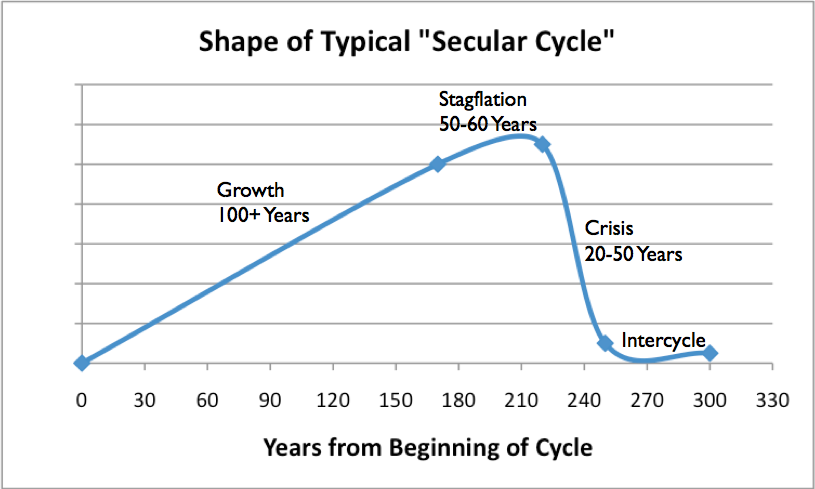
Figure 7. Shape of typical Secular Cycle, based on work of Peter Turchin and Sergey Nefedov in Secular Cycles.
Again, the pattern is that of a Seneca Cliff. Some of the issues leading to collapse include the following:
- Rising population relative to farmland. Either farmland was divided up into smaller plots, so each farmer produced less, or new workers received “service” type jobs, at much reduced wages. The result was falling earnings of many non-elite workers.
- Spiking food and energy prices. Prices were high at times due to lack of supply, but held down by low wages of workers.
- Rising need for government to solve problems (for example, fight war to get more land; install irrigation system so get more food from existing land). Led to a need for increased taxes, which impoverished workers could not afford.
- Increased number of nobles and high-level administrators. Result was increased disparity of wages.
- Increased debt, as more people could not afford necessities.
Eventually, the workers who were weakened by low wages and high taxes tended to succumb to epidemics. Some died in wars. Again, we have a situation of low energy flows, and the lower wage workers not getting enough of these flows. Many died–in some cases as many as 95%. These situations were much more extreme than those of the FSU. On the favorable side, the fact that there were few occupations back in pre-industrial days meant that those who did survive could sometimes resettle with other nearby communities and continue to practice their occupations.
Joseph Tainter in The Collapse of Complex Societies talks about the need for increasing complexity, as diminishing returns set in. This would seem to correspond to the need for increased government services and an increased role for businesses. Also included in increased complexity would be increased hierarchical structure. All of these changes would leave a smaller share of the energy flows for the low-ranking workers–a problem mentioned previously.
Dr. Tainter also makes the point that to maintain complexity, “Sustainability may require greater consumption of resources, not less.”
A Few Insights as to the Nature of the Physics Problem
The Second Law of Thermodynamics seems to work in a single direction. It talks about the natural tendency of any “closed” system to degenerate into a more disordered system. With this view, the implication is that the universe will ultimately end in a heat-death, in which everything is at the same temperature.
Dissipative systems work in the other direction; they create order where no order previously existed. Economies get ever-more complex, as businesses grow larger and more hierarchical in form, governments provide more services, and the number of different jobs filled by members of the economy proliferate. How do we explain this additional order?
According to Ulanowicz, the traditional focus of thermodynamics has been on states, rather than on the process of getting from one state to another. What is needed is a theory that is more focused on processes, rather than states. He writes,
. . . the prevailing view of the second law is an oversimplified version of its true nature. Simply put, entropy is not entirely about disorder. Away from equilibrium, there is an obverse and largely unappreciated side to the second law that, in certain circumstances, mandates the creation of order.
We are observing the mandated creation of order. For example, the human body takes heat energy and transforms it to mechanical energy. There is a dualism to the entropy system that many have not stopped to appreciate. Instead of a trend toward heat death always being the overarching goal, systems have a two-way nature to them. Dissipative systems are able to grow until they reach a point called self-organized criticality or the “critical point”; then they shrink from inadequate energy flows.
In forests, this point of self-organized criticality comes when the growth of the tall trees starts blocking out the light to the shorter plants. As mentioned earlier, at that point the forest starts becoming more susceptible to forest fires. Ulanowicz shows that for ecosystems with more than 12 elements, there is quite a narrow “window of viability.”
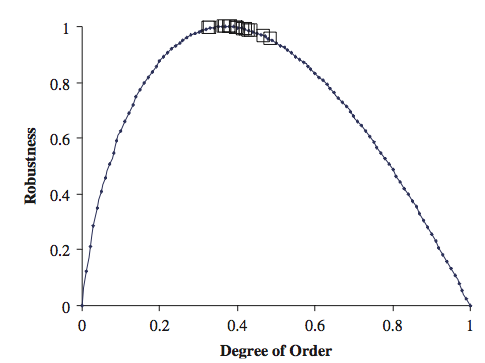
Figure 8. Illustration of close clustering of ecosystems with more than 12 elements, indicating the narrow “window of viability” of such ecosystems. From Ulanowicz
If we look at world per capita energy consumption, it seems to indicate a very narrow “window of viability” as well.

Figure 9. World energy consumption per capita, based on BP Statistical Review of World Energy 2105 data. Year 2015 estimate and notes by G. Tverberg.
When we look at what happened in the world economy alongside the history of world energy consumption, we can see a pattern. Back prior to 1973, when oil was less than$30 per barrel, oil consumption and the economy grew rapidly. A lot of infrastructure (interstate highways, electric transmission lines, and pipelines) was added in this timeframe. The 1973-1974 price shock and related recession briefly brought energy consumption down.
It wasn’t until the restructuring of the economy in the late 1970s and early 1980s that energy consumption really came down. There were many changes made: cars became smaller and more fuel efficient; electricity production was changed from oil to other approaches, often nuclear; regulation of utilities was changed toward greater competition, thus discouraging building infrastructure unless it was absolutely essential.
The drop in energy consumption after 1991 reflects the fall of the Former Soviet Union. The huge ramp-up in energy consumption after 1991 represents the effect of adding China (with all of its jobs and coal consumption) to the World Trade Organization. With this change, energy needs became permanently higher, if China was to have enough jobs for its people. Each small dip seems to represent a recession. Recently energy consumption seems to be down again. If we consider low consumption along with low commodity prices, it makes for a worrying situation. Are we approaching a major recession, or worse?
If we think of the world economy relative to its critical point, the world economy has been near this point since 1981, but various things have pulled us out.
One thing that has helped the economy is the extremely high interest rate (18%) implemented in 1981. This high interest rate pushed down fossil fuel usage at that time. It also gave interest rates a very long way to fall. Falling interest rates have a very favorable impact on the economy. They encourage greater lending and tend to raise the selling prices of stocks. The economy has received a favorable boost from falling interest rates for almost the entire period between 1981 and the present.
Other factors were important as well. The fall of the Soviet Union in 1991 bought the rest of the world a little time (and saved oil extraction for later); the addition of China to the World Trade Organization in 2001 added a great deal of cheap coal to the energy mix, helping to bring down energy costs. These low energy costs, plus all of the debt China was able to add, allowed energy consumption and the world economy to grow again–temporarily pulling the world away from the critical point.
In 2008, oil prices dropped very low. It was only with QE that interest rates could be brought very low, and commodity prices bounced back up to adequate levels. Now we are again faced with low prices. It looks as if we are again at the critical point, and thus the edge of collapse.
Once a dissipative structure is past its critical point, Roddier says that what is likely to bring it down is an avalanche of bifurcations. In the case of an economy, these might be debt defaults.
In a dissipative structure, both communication and stored information are important. Stored information, which is very close to technology, becomes very important when food is hard to find or energy is high cost to extract. When energy is low-cost to extract, practically anyone can find and make use of energy, so technology is less important.
Communication in an economy is done in various ways, including through the use of money and debt. Few people understand the extent to which debt can give false signals about future availability of energy flows. Thus, it is possible for an economy to build up to a very large size, with few realizing that this approach to building an economy is very similar to a Ponzi Scheme. It can continue only as long as energy costs are extremely low, or debt is being rapidly added.
In theory, EROEI calculations (comparing energy produced by a device or energy product to fossil fuel energy consumed increasing this product) should communicate the “value” of a particular energy product. Unfortunately, this calculation is based the common misunderstanding of the nature of the physics problem that I mentioned at the beginning of the article. (This is also true for similar analyses, such as Lifecycle Analyses.) These calculations would communicate valuable information, if our problem were “running out” of fossil fuels, and if the way to mitigate this problem were to use fossil fuels as sparingly as possible. If our problem is rising debt levels, EROEI and similar calculations do nothing to show us how to mitigate the problem.
If the economy collapses, it will collapse down to a lower sustainable level. Much of the world’s infrastructure was built when oil could be extracted for $20 per barrel. That time is long gone. So, it looks like the world will need to collapse back to a level before fossil fuels–perhaps much before fossil fuels.
If it is any consolation, Prof. Roddier says that once new economies begin to form again, the survivors after collapse will tend to be more co-operative. In fact, he offers this graphic.
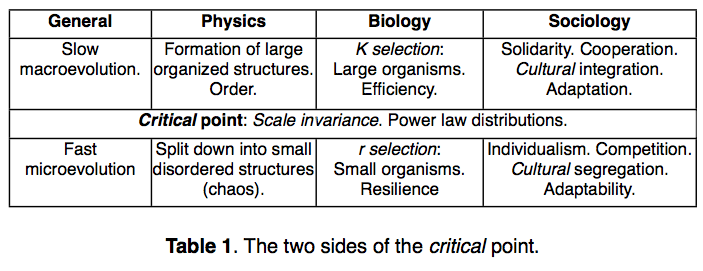
Figure 10. F. Roddier view of what happens on the two sides of the critical point. From upcoming translation of his book, “The Thermodynamics of Evolution.”
We know that if there are survivors, new economies will be likely. We don’t know precisely what they will be like, except that they will be limited to using resources that are available at that time.
Some References to Francois Roddier’s Work (in French)
THERMODYNAMIQUE DE L’ÉVOLUTION “UN ESSAI DE THERMO-BIO-SOCIOLOGIE” -The Thermodynamics of Evolution – Book, soon to be translated to English. Will at some point be available from the same site in English.
Roddier writes:
This is a talk I gave at the CNAM (Paris) on December 2, 2013. The title is:Thermodynamique et économie ; des sciences exactes aux sciences humaines
In this talk, I show that Per Bak’s neural network model can be used to describe an economic system as a neural network of agents exchanging money. The paper gives a brief explanation on how economies collapse.
The other talk is one I gave in Paris on March 12, 2015, for Jancovici’s Shift Project. The title is:
La thermodynamique des transitions économiques
A video of this talk is available on the web at the following address:
https://www.youtube.com/watch?v=5-qap1cQhGA
In this talk, I describe economy in terms of Gibbs-Duhem potentials (akin to chemical potentials). Money flows measure entropy flows (with opposite sign). The cost of energy plays the role of an inverse temperature. I show that economic cycles are similar to those of a steam engine. They self organize around a critical point.
30 Comments on "The Physics of Energy and the Economy"
makati1 on Mon, 8th Feb 2016 7:03 pm
“We know that if there are survivors, new economies will be likely. We don’t know precisely what they will be like, except that they will be limited to using resources that are available at that time.”
1800s? BC? Pre humans? We shall see.
Truth Has A Liberal Bias on Mon, 8th Feb 2016 7:37 pm
We’re currently in phase transition from resource abundant industrial economy to resource scarce industrial economy. This will very soon be followed by transition to scavenger industrial economy, where we pick through the dumps and rubble heaps, and then to a non industrial economy (think Little House on the Prairie or Spaghetti Westerns). Through the course of these transitions world population will likely have to be reduced to 1 or 2 billion. Only the most ruthless will survive the population bottle neck.
Apneaman on Mon, 8th Feb 2016 8:47 pm
Truth, while all this is going on (and I believe it will happen but not last) is every one of the 450 nuke power plants going to be maintained in an orderly fashion? I was under the impression that they need an entire somewhat functioning industrial civilization to maintain them and/or shut them down. Shutting them down takes a long time.
Pennsyguy on Mon, 8th Feb 2016 8:56 pm
Never have there been so many humans on the planet and never have there been so many totally dependent on hyper-complex technologies that require huge amounts of financially affordable, high EROI energy. This is getting to be a problem, but don’t tell the U.S. presidential contenders.
bug on Tue, 9th Feb 2016 12:28 am
Penn, the presidential contenders are just doing/saying what the citizens and backers want to hear. If they said otherwise, they would be tarred and feathered.
Davy on Tue, 9th Feb 2016 4:27 am
“unless the need is dire”
“Another Data Point To Ignore: Dividend Cuts Have Surpassed 2008”
http://www.zerohedge.com/news/2016-02-08/another-data-point-ignore-dividend-cuts-have-surpassed-2008
“number of dividend reductions far surpassed 2008, almost 100 more than at the outset of the Great Recession”
“The ratcheting down of payouts to shareholders is a function of weak commodity prices, sluggish growth dampening corporate profits, and a tightening of credit conditions. This combination—and in particular the stingier lending—could exacerbate the carnage already seen this year in financial markets, further dampening economic activity.”
“Because of the stigma associated with cutting dividends, management is loath to go down that path unless the need is dire. The trend toward trimmed payouts hasn’t let up so far in 2016, especially among companies under stress from soft commodity prices”
Davy on Tue, 9th Feb 2016 4:41 am
Tell me how oil could ever find a sustainable rally with the markets like they are now? Absent a shock event I see little to point to “growing” growth. Everything I see is “stagnating” growth. If an oil shock event occurred how could it be sustained? I think the one option for higher oil prices being a shock would just make the economy react more violently down after the initial price rise. Anything is possible in the short term in this disturbed market but sustained healthy growth is not one of them. I see oil stuck in a sub-par price range now that “panic” price discovery and “risk off” mentality is on. The momentum trading bubble is dying quickly!
“Global Bond Rally Near `Panic’ Level With Japan Yield Below Zero”
http://www.bloomberg.com/news/articles/2016-02-09/treasuries-climb-as-global-market-turmoil-derails-fed-rate-bets
“Sovereign bonds surged, sending the Japanese benchmark 10-year yield below zero for the first time, as investors seeking the safest assets gorged on government debt.”
“It’s almost like a panic,” said Hideo Shimomura, the chief fund investor in Tokyo at Mitsubishi UFJ Kokusai Asset Management. “The flight to quality is exaggerated.”
“It’s hard to find a reason to short Treasuries,” said Tomohisa Fujiki, head of interest-rate strategy for Japan for BNP Paribas SA in Tokyo, referring to bets that a security will fall. Turmoil “is now affecting equity markets in developed countries as well — and commodities and emerging markets have not stabilized yet.”
“The flight to quality gained momentum Monday because of speculation Deutsche Bank AG would have trouble paying its debts”
“That really spooked the market,” he said. “People immediately thought there’s a problem where banks can’t pay and they can’t fund themselves to pay. It does feel like we’re reaching a point where the market is panicked.”
shortonoil on Tue, 9th Feb 2016 7:55 am
“There is a standard wrong belief about the physics of energy and the economy; it is the belief we can somehow train the economy to get along without much energy.”
For the last 10,000 years that is exactly what civilization accomplished before the debut of the fossil fuel age. This whole article makes absolutely no sense! There is no law of physics that states that the complexity of a system must be proportional to its energy consumption. A cell phone is an extremely complex system, but uses only a tiny fraction of the energy of a locomotive; which is a much less complex system. To maintain the form of the present economy with less energy simply requires less economy; and that is exactly what is happening. Attaching ten pages of rambling dialog to that statement is not going to change it.
ghung on Tue, 9th Feb 2016 8:16 am
Short said; “There is no law of physics that states that the complexity of a system must be proportional to its energy consumption. A cell phone is an extremely complex system, but uses only a tiny fraction of the energy of a locomotive;…”
Not sure I agree, Short. This is an industrial age comparison, only valid in a high energy environment. It isn’t the energy embedded in, and used by, things like cell phones. It’s the overall consumer environment required to enable their production, purchase, and use; a very complex set of arrangements only possible for a high energy economy. The complexity of modern electronics is only made possible by burning stuff; lots of stuff.
Don Stewart on Tue, 9th Feb 2016 8:45 am
I posted this on Gail’s site. She doesn’t allow quote from BW Hill.
Dear Gail and Finite Worlders
(There won’t be a single quote from Hill in this…)
I suggest that people take several steps:
*Take a look at
http://earth.nullschool.net
The default screen is a picture of the western hemisphere and the Atlantic and the wind direction and wind speed. Click on the word Earth and you can change the projection of the map and you can overlay things like temperatures. Click on Earth again to get rid of the scale selection panel.
What you almost always see is severe storms in the Southern Ocean. Ponder it a little and you begin to think about the extreme difference between the temperatures in Antarctica and the tropics. And you begin to get the idea that the energy gradient has something to do with the formation of those storms. You may not be able to put precise mathematics to it, but it will begin to seem intuitive that a cold spot and some warm latitudes are going to interact and the interaction will take place through structures. (For discovering this Prigogine got a Nobel?)
Now consider that when Bill Mollison developed Permaculture, he advised people to look for these gradients and use both the built environment and plants to harvest the energy present in gradients.
What we are talking about with both the map and Permaculture are ‘dissipative structures’ in the lingo of thermodynamics. There is nothing sinister or ‘hopeless’ about the term ‘dissipative structure’. We have known since the Buddha, at least, that everything changes and there is nothing permanent. Dissipative structures facilitate the changes.
*Consider the thermodynamics of a primary energy source. If the primary energy source is the sun, then the energy is supplied by fusion happening 93 million miles away on time scales which, to a human, are essentially unimaginable. Consider them a constant. However, Evolution has given us Dissipative Structures which help the creatures on Earth harvest that solar energy and use it. For example, the mitochondria in all multi-celled creatures make the power which keeps our cells running. A plant leaf is a marvelous example of a dissipative structure. The plant plus the soil food web is an example of a dissipative structure combined with a recycling system…recycling not the energy, but the materials such as minerals and atoms such as carbon or phosphorus.
*But if the energy source is fossil fuels, an additional complication arises. It takes fossil fuels to produce fossil fuels from the raw materials in Earth. We can make analogies between a human societies use of fossil fuels and a plant/ soil food web society which uses solar energy, but the primary energy can no longer be considered as free. Unlike sunlight, we have to do work to harvest and use fossil fuels. (We can turn harvesting sunlight into an energy intensive process…keep that thought.)
*If we try to model the fossil fuel system, we find a number of components:
#How much energy does it take for the oil, coal, and gas industries to produce and distribute intermediate products, such as barrels of oil and cubic feed of gas and tons of coal? So we have to subtract the energy used by the energy system to derive a ’net energy’ in one form or another.
#How much energy does it take for the society to turn the barrels of oil, cubic feet of gas, and tons of coal into something which is actually useful to humans, such as food, warmth in a house, and a hole made by a power drill driven by electricity?
And we will find that we spend more energy on the second part of that equation than the first. If we consider only a barrel of oil, we can first estimate how much primary energy the oil industry uses to produce the barrel and refine it and distribute it as products delivered to a pump. Then we can estimate how much energy is required to keep the society running which can turn the product at the pump into something which is actually useful to humans…you can’t drink gasoline or diesel.
Hill’s model puts those two aspects together with some elegant equations. Gail usually approaches the issues with heuristic approaches.
I want to deal with the issue of efficiency in the use of fossil fuels. Consider the Maya farmer that I have recently written about. The Maya use, and have used for 8000 years, hand tools. But the Spanish brought steel, which was produced before fossil fuels but would now be closely associated with fossil fuel use. A Mayan today is frequently pictured with steel-bladed machete in hand…because Milpa agriculture is more about thinning than it is about planting. Having a steel blade makes everything easier. So using some fossil fuels to produce steel is likely a quite efficient use of energy for a Maya farmer.
On the other hand, consider Charles Hugh Smith’s post yesterday:
http://www.oftwominds.com/blogfeb16/fragile-middle-class2-16.html
Charles shows that the income of the bottom 90 percent has flatlined since 1968. But consider that, since 1968, we have all become fatter and sicker and health care expenditures have increased from around 6 percent of GDP to 20 percent of GDP. The cost of a college education has likewise grown enormously. So, at first blush, we would have to say that the real welfare of the bottom 90 percent is probably less than it was in 1968. And if we look at the cost of producing oil from Hill’s graphs, we find that oil is much more costly than it was in 1968 (current price does not reflect cost!). To the extent that being able to make a living depends on how much oil one can use to produce things, and the cost of the oil, then the situation for the bottom 90 percent looks like it is deteriorating. We also know that the bottom 90 percent have a lot more debt than they did in 1968. So more of their income is being syphoned off to the financial institutions which are dominated by the 1 percent and 10 percent.
If you put Charles graph together with my preceding paragraph, you have reason to believe that the affordability of oil and its products is declining for the great majority of Americans. Probably the same phenomena is happening all over the OECD. And probably China is getting a whiff of the same bad air.
Charles frequently writes about the necessity to get rid of the dissipative structures which have arisen to feast on the energy gradient between banks which can print money and the bottom 90 percent who have to negotiate treacherous shoals if they want to repay the debt. Crony capitalism and regulatory capture and the corruption of politics with 200K speeches to bankers and falling prey to the Coca-Colas of the world are all glaring inefficiencies which result, believe it or not, in falling prices for oil and eventually the End of the Oil Age.
It is always true that exponential curves do not go on forever, and our world really is finite, so eventually we would have to learn to live without fossil fuels no matter how efficiently we used them. However, we could extend the Age of Oil IF we were able to rid ourselves of the wasteful dissipative structures which dominate our society. More machetes, fewer derivative traders. More small farmers, less big agriculture and big food. Possibly more groups of 150 and fewer votes by hundreds of millions of ‘citizens’.
Don Stewart
Davy on Tue, 9th Feb 2016 8:53 am
“To maintain the form of the present economy with less energy simply requires less economy; and that is exactly what is happening.” Sure, I agree until a point where the center collapses in on itself. Our complex global system has a minimum complexity level to function and that is not much less than we currently have in my opinion.
marmico on Tue, 9th Feb 2016 9:07 am
Charles shows that the income of the bottom 90 percent has flatlined since 1968
Hughes is like Tverberg. Simpletons wading into complex arithmetic.
The after tax after transfer income of the lowest income quintile has not flatlined since 1968.
http://crfb.org/sites/default/files/growth_in_after_tax_income_1979_to_2011.jpg
Distributional issues are in play, however. All it means is that higher income groups are taking a bigger piece of a bigger pie relative to lower income groups.
Apneaman on Tue, 9th Feb 2016 9:50 am
“All it means is that higher income groups are taking a bigger piece of a bigger pie relative to lower income groups.”
Is that “all” it means fuctard? Bigger? How about almost all of it.
Oxfam says wealth of richest 1% equal to other 99%
http://www.bbc.com/news/business-35339475
No biggie in a retail/services economy eh? All it means is nobodys got any fucking money to buy shit and many can barely subsist. Yabut you can still get a subprime auto loan with 7 year financing if you have a pulse and a signature.
marmico on Tue, 9th Feb 2016 10:03 am
What a fuctard. There was a 12 inch diameter pie in 1968 and the top 1% took 10%. There was a 30 inch diameter pie in 2016 and the top 1% took 20%.
Do the arithmetic, simpleton. A teenager in a low income household in 1968 was unlikely to have a hand held transistor radio. A teenager in a low income household in 2016 is likely to have a hand held computer.
Apneaman on Tue, 9th Feb 2016 10:14 am
marmi fuck off loser. It’s gone and NEVER coming back. Bleeding out.
Global stocks hit the rocks after Asian markets slump
http://www.reuters.com/article/us-global-markets-idUSKCN0VI011
Global Bond Rally Near `Panic’ Level With Japan Yield Below Zero
http://www.bloomberg.com/news/articles/2016-02-09/treasuries-climb-as-global-market-turmoil-derails-fed-rate-bets
‘Panic situation’: Asian stocks tumble amid fears of new global recession
Japan’s Nikkei index falls more than 5% in trading with Australian and some other Asian markets following suit
http://www.theguardian.com/business/2016/feb/09/panic-situation-as-asian-stocks-tumble-amid-fears-of-new-global-recession
GregT on Tue, 9th Feb 2016 10:24 am
“A teenager in a low income household in 2016 is likely to have a hand held computer.”
And the King of Spain in 1900 was unlikely to have either. Irrelevant.
Boat on Tue, 9th Feb 2016 10:36 am
Apeman,
No biggie in a retail/services economy eh? All it means is nobodys got any fucking money to buy shit and many can barely subsist. Yabut you can still get a subprime auto loan with 7 year financing if you have a pulse and a signature.
All this concern about the poor. they have oven, fridge, micro wave, multiple smart phones, multiple tv’s, stereo, playstation etc.
Today’s poor has it better than yesterdays rich because life’s hardware is much cheaper and more efficient.
Apneaman on Tue, 9th Feb 2016 10:40 am
boat, fuck off and die shit stain.
Millions could die as world unprepared for pandemics, says UN
Panel convened to analyse deadly outbreaks says capacity to respond to communicable diseases remains ‘woefully insufficient’
http://www.theguardian.com/society/2016/feb/08/millions-could-die-as-world-unprepared-for-pandemics-says-un
Don Stewart on Tue, 9th Feb 2016 10:48 am
Marmico
If you think that a person earning 30K per year with their own initiative and someone getting 30K per year of charity are equivalent….I don’t think an explanation will help you. You will have to learn the difference by hard experience.
Don Stewart
marmico on Tue, 9th Feb 2016 10:54 am
And the King of Spain in 1900 was unlikely to have either. Irrelevant.
Tiny brain innumerate GreggieTee is at again. The discussion originated with Dear Finite Worlders, Don Stewart, quoting Charles Hugh-Smith about the flatlining income of the 10% decile households in 1968.
Now I am certain that Don Stewart is much more expert than me when it comes to shitting in a fence post hole and spreading it on his permaculture doomstead. My preference is a flush toilet.
Neither Don Stewart, Hugh-Smith, Tverberg is an expert when it comes to household income.
Since ape boy can’t add or subtract, I’ll do it for you. If a 1968 12 inch pie is 100 units, then a 2016 30 inch pie is 250 units. In 1968 the 1% took 10 units of 100 units and in 2016 the 1% took 50 units of 250 units. By arithmetic the bottom 99% moved from 90 units in 1968 to 200 units in 2016. Of course, low income households moved less than their 1968 proportionate share of units, but they moved nonetheless.
marmico on Tue, 9th Feb 2016 11:17 am
You will have to learn the difference by hard experience.
Go set up a rail, drop your drawers, sit down and shit in a fence post hole while reading the latest and greatest permaculture bull shit.
I’ll concede this. You are Tverberg*’s antidote to Fast “Plutonium Rod” Eddy.
* Tverberg is a nutter.
shortonoil on Tue, 9th Feb 2016 12:00 pm
“Not sure I agree, Short. This is an industrial age comparison, only valid in a high energy environment. It isn’t the energy embedded in, and used by, things like cell phones. It’s the overall consumer environment required to enable their production, purchase, and use; a very complex set of arrangements only possible for a high energy economy.”
I have to agree that that is what has happened so far with this civilization. But, “hypothetically speaking”, what would happen if the present world economy fell to half its present level. If it did its total energy consumption would also fall by half. But would that mean that the complexity of what was remaining would fall? It could, but it would not be guaranteed to do so. We could get a much more complex society resulting from an economic decline. Such as greater use of robotics, more emphasis on material science development, and greater computer use resulting from AI applications. The point is that the laws of physics do not dictate that complexity is a function of energy use. I think that you are referring more to human behavior than than a physical principle.
shortonoil on Tue, 9th Feb 2016 12:13 pm
“I posted this on Gail’s site. She doesn’t allow quote from BW Hill.”
Isn’t that interesting? She has full access to the report but comments that it is “bad thermodynamics”. She has 67 pages in which to point out where it is bad, but hasn’t done so to date. Her response would be a little interesting if it was a little more specific. Something like on page 43, equation 14 is in error because it …… So far, nothing?
Davy on Tue, 9th Feb 2016 12:26 pm
If the global economy dropped by half I would be curious how robotics is going to be relevant. A 50% drop in economic activity is a hard swift collapse. This is especially true in this day and age of the totality of globalism as the guaranty in regards to population overshoot.
“The laws of physics do not dictate complexity is a function of energy use.” No, but considering what we have now that is the situation. We don’t need theories to see that this current global arrangement must have energy intensity. It was built that way and will die that way.
shortonoil on Tue, 9th Feb 2016 12:51 pm
@Don Stewart,
No argument here, and well stated. But, the situation that has existed for the last century, or so is now changing. When petroleum reached its energy half way point wealth began moving from the top 1% to the bottom 99%. This is the first time in history that has occurred. Plus, there is absolutely nothing that the 1% can do about it. At present, on a BTU bases, the end consumer is paying less for a BTU from petroleum than they have since 1973. Over the last 20 months that has moved more than $3 trillion from the top to the bottom, and that was from petroleum alone.
Because the price of oil is now range bound, if prices are forced too high (now $66/ barrel) demand will fall, and force prices back down. The 1% now must keep supplying oil at a loss to retain what wealth they have remaining, and that transfer is huge. We see this occurring in every stage of the economy. 70% of the world’s Sovereign bonds now issued are paying negative interest rates. That Sovereign debt is owned mostly by the 1%. The decline of the oil age is not going to produce the results that anyone expected.
Be Well
Don Stewart on Tue, 9th Feb 2016 2:08 pm
Shortonoil
I should have said as much.
Don Stewart
Don Stewart on Tue, 9th Feb 2016 2:48 pm
Shortonoil
Rethinking the ‘transfer of wealth’ argument.
On sober reflection, I think the transfer of wealth only works if the poorer sections of society use the money saved on oil to either pay down debt or else to build capital goods. If they just spend it, no wealth is created. The illusion of wealth for the rich is destroyed, but no real wealth is created as a result.
If oil production takes a hit, and one maintains that there is a pretty strict relationship between oil consumption and income, then the poor people may see a decline in income, and have no money to pay down debt or to build infrastructure.
It might be that we are just going to see enormous destruction of paper wealth, benefitting no one.
Don Stewart
Ifuckyouover on Tue, 9th Feb 2016 3:51 pm
Gail if full of shit.
Her title is called The Physics of Energy and the Economy yet she barely talks about energy according to the real definition of physics.
I could go on and on about what is wrong with her essay.
https://www.youtube.com/watch?v=k4b3oxO0WqE
shortonoil on Tue, 9th Feb 2016 5:18 pm
“The illusion of wealth for the rich is destroyed, but no real wealth is created as a result.”
That is totally correct, the world as a whole is getting poorer; and fast. However, during the decline phase the 1% will be getting poorer faster than anyone else. I haven’t done any calculations on the subject (not sure there is anyway to do it) but I suspect that everyone will hit the bottom at the same time. The end of the oil age will be the greatest equalizer in history.
GregT on Tue, 9th Feb 2016 5:57 pm
And in the end, after both the 1%, and the 99%, have seen all of their ‘wealth’ evaporate, the .0000001% will introduce yet another fiat currency that they have printed out of thin air.
The same as it ever was.