Peak Oil is You

Donate Bitcoins ;-) or Paypal :-)
Page added on April 17, 2017
The Economy Is Like a Circus

The economy is like a circus. It comes to town, and eventually it leaves town. We get paid in tickets to this circus. As long as the circus stays in town, we can use our tickets. Once the circus leaves town, we are pretty much out of luck.1
The reason the circus stays in town is because the economy stays in sufficient balance that the economy can go on. This is much like the way many other self-organized systems function. For example, our bodies continue to function as long as there are suitable balances in many different areas (oxygen, food, water, air pressure). Ecosystems continue to function as long as there is sufficient rain, adequate temperatures, and enough sunlight.
There are many different views as to what limits we reach in a finite world. Some people think we will “run out” of oil, or of energy products. Some think that the energy return will fall too low, as measured in some manner. I see the adequacy of the energy return as being very much tied to the financial system. Thus, the forecast by US Atlanta Fed GDPNow indicating that first quarter 2017 US GDP growth will only be 0.5% is likely to be a problem, assuming it is correct.
Our economy operates on economies of scale. Once we get too close to shrinking, or actually start shrinking, we reach a point where the economic circus starts to leave town. At some point, we will discover the circus is gone. The economy we thought we had, will have left us. If some people are survivors, they will need to pick up the pieces and start over with an entirely new system.
What the Economy Needs to Do to Keep Functioning
For our economy to continue functioning, a number of variables are important:
- Prices of commodities – Prices cannot be too high for the consumer to afford goods made with them. They also cannot be low for producers. If prices of oil and other commodities are too low for producers (as they are now), producers need to keep raising debt levels to stay in business. There is a risk that production will stop from lack of adequate new investment, or from bankruptcy of producers.
- Wages of non-elite workers – These wages need to be high enough so that workers can afford goods made with commodities, such as cars, homes and computers. These big purchases tend to use commodities even after they are made, adding to “demand” for commodities. If commodity prices such as oil are too low (as they are now), it is likely related to inadequate wages of non-elite workers.
- Mandatory payments required of non-elite workers, such as taxes, health care, and education – It is not just wages of non-elite workers that are important. So are required payments, such as payments for taxes, healthcare and education. Clearly, the lower these payments are for non-elite workers, the better the economy functions.
- Interest rates – Low interest rates are helpful for some parts of the economy, while high interest rates are good for other parts. Low interest rates help create affordable monthly payments for goods such as homes and cars. If interest rates decline, the market prices of assets such as real estate, shares of stock, and bonds tend to rise. These rising values are of great benefit to owners of these assets, since they can sell these assets and use the proceeds to add to current consumption. Conversely, high interest rates are important to pension plans and to others depending on investment income. Banks have a problem if there is not a big enough “spread” between short and long interest rates.
- Increase in debt – An increase in debt indirectly makes the economy “look” much better. Increasing debt acts to raise wages, since some of this growing debt adds to funds available for wages. The higher wages tend to increase demand for goods, and thus indirectly raise commodity prices. A virtuous circle starts, pushing up economic growth, provided an adequate quantity of very cheap energy products is available (under $20 barrel oil, for example) that can be used to make goods and services. Increased debt works less and less well, as the price of energy products increases.
- Inflation rates – The higher the inflation rate, the easier it is to repay debt with interest, since most debt is not adjusted for inflation. Also, high inflation rates help keep prices of homes and other buildings from falling as they age, making the use of mortgages more feasible. If the price of a commodity, such as oil or coal, is high and then falls, debt based on the prior high value of the commodity is likely to become a problem.
- Quantity of energy products affordable by economy – It takes energy products to produce goods and services. If the price of commodities is low, it is possible for buyers to purchase a large quantity of these products, even on a low budget. Current relatively low prices tend to help the economy, even if producers cannot afford to make adequate investment in new production with such low prices. Thus, today’s low energy prices make the economy look good for at a short time. Afterwards, the outlook is less rosy.
Ultimately, the issue at hand in determining whether the “circus will leave town” is whether non-elite workers are able to adequately make a living. We know from biology that the return on the labor of animals must be adequate (animals must be able to get enough food by walking, swimming, or flying) or their populations will collapse. The same thing is true for humans. We also know that prior civilizations that collapsed often had wage disparity problems. When this happened, non-elite workers were no longer able to pay adequate taxes. Their nutrition became poorer. They tended to become more susceptible to epidemics. These were things that pushed the economy toward collapse.
The goods and services that non-elite workers can buy with their wages represent the benefits of our fossil fuel powered energy system, as distributed to the most vulnerable workers in the system. Once these benefits start falling too low, the system can no longer function.
There are some indications that benefits are already too low for the economy to keep functioning in a “normal” manner. A major such indication is the fact that energy prices have remained far too low since mid-2014, It is becoming increasingly clear that there really is no oil price which is both high enough for producers and low enough for consumers. We may be living on “borrowed time,” using an increasing amount of debt to support energy producers.
Thus, world economic growth rates may already be too low to keep the world economy operating. Regulators who consider only the US do not seem to understand the world situation. Because of this, they can easily make moves that make the situation worse, rather than better. For example, they have already started raising interest rates and are planning to sell securities currently held by the Federal Reserve.
A Few Graphs Giving Hints of Our Problem
Economists have not understood what our problems really are, so they have tended to omit some important issues from their analyses. I put together a few graphs that might give a little insight as to what is happening.
Interest Paid by Households
Interest paid by households is important because this money is transferred to banks, insurance companies, and pension plans. It leaves the households who paid this interest poorer. Buying goods using debt is convenient, but it has a cost involved.
BEA Table 7.11 shows a category called, “Interest Paid by Households.” If we compare this to BEA “Wages and Salaries,” we find the relationship shown in Figure 1. Admittedly this is not an exact comparison; there are some people who are not wage earners who are making interest payments, for example. I have not tried to offset “interest paid by households,” against “interest received by households,” because the households benefiting from interest payments are likely very different households than those paying interest payments. They are likely richer, and at a later stage in their lives.
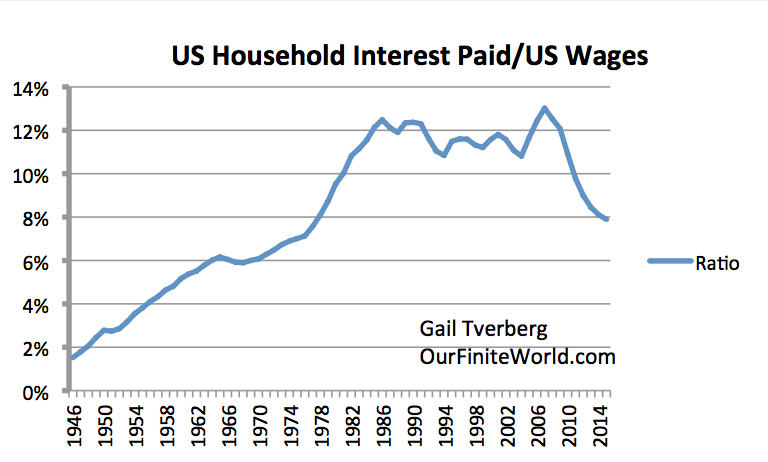
Figure 1. US Household Interest Paid (from BEA Table 7.11 Interest Paid and Received by Sector and Legal Form of Organization) divided by Wages and Salaries from BEA Table 2.11, “Personal Income and its Disposition.”
The pattern might be described as follows:
- A rapid run-up in interest payments that took place until about 1986
- A general flattening, with new peak in 2007
- A rapid fall starting in 2008
It seems to me that the pattern up to 1986 reflects the general run-up in consumer debt levels during this period. The amount of interest paid is also affected by interest rates, such as ten-year treasury rates.
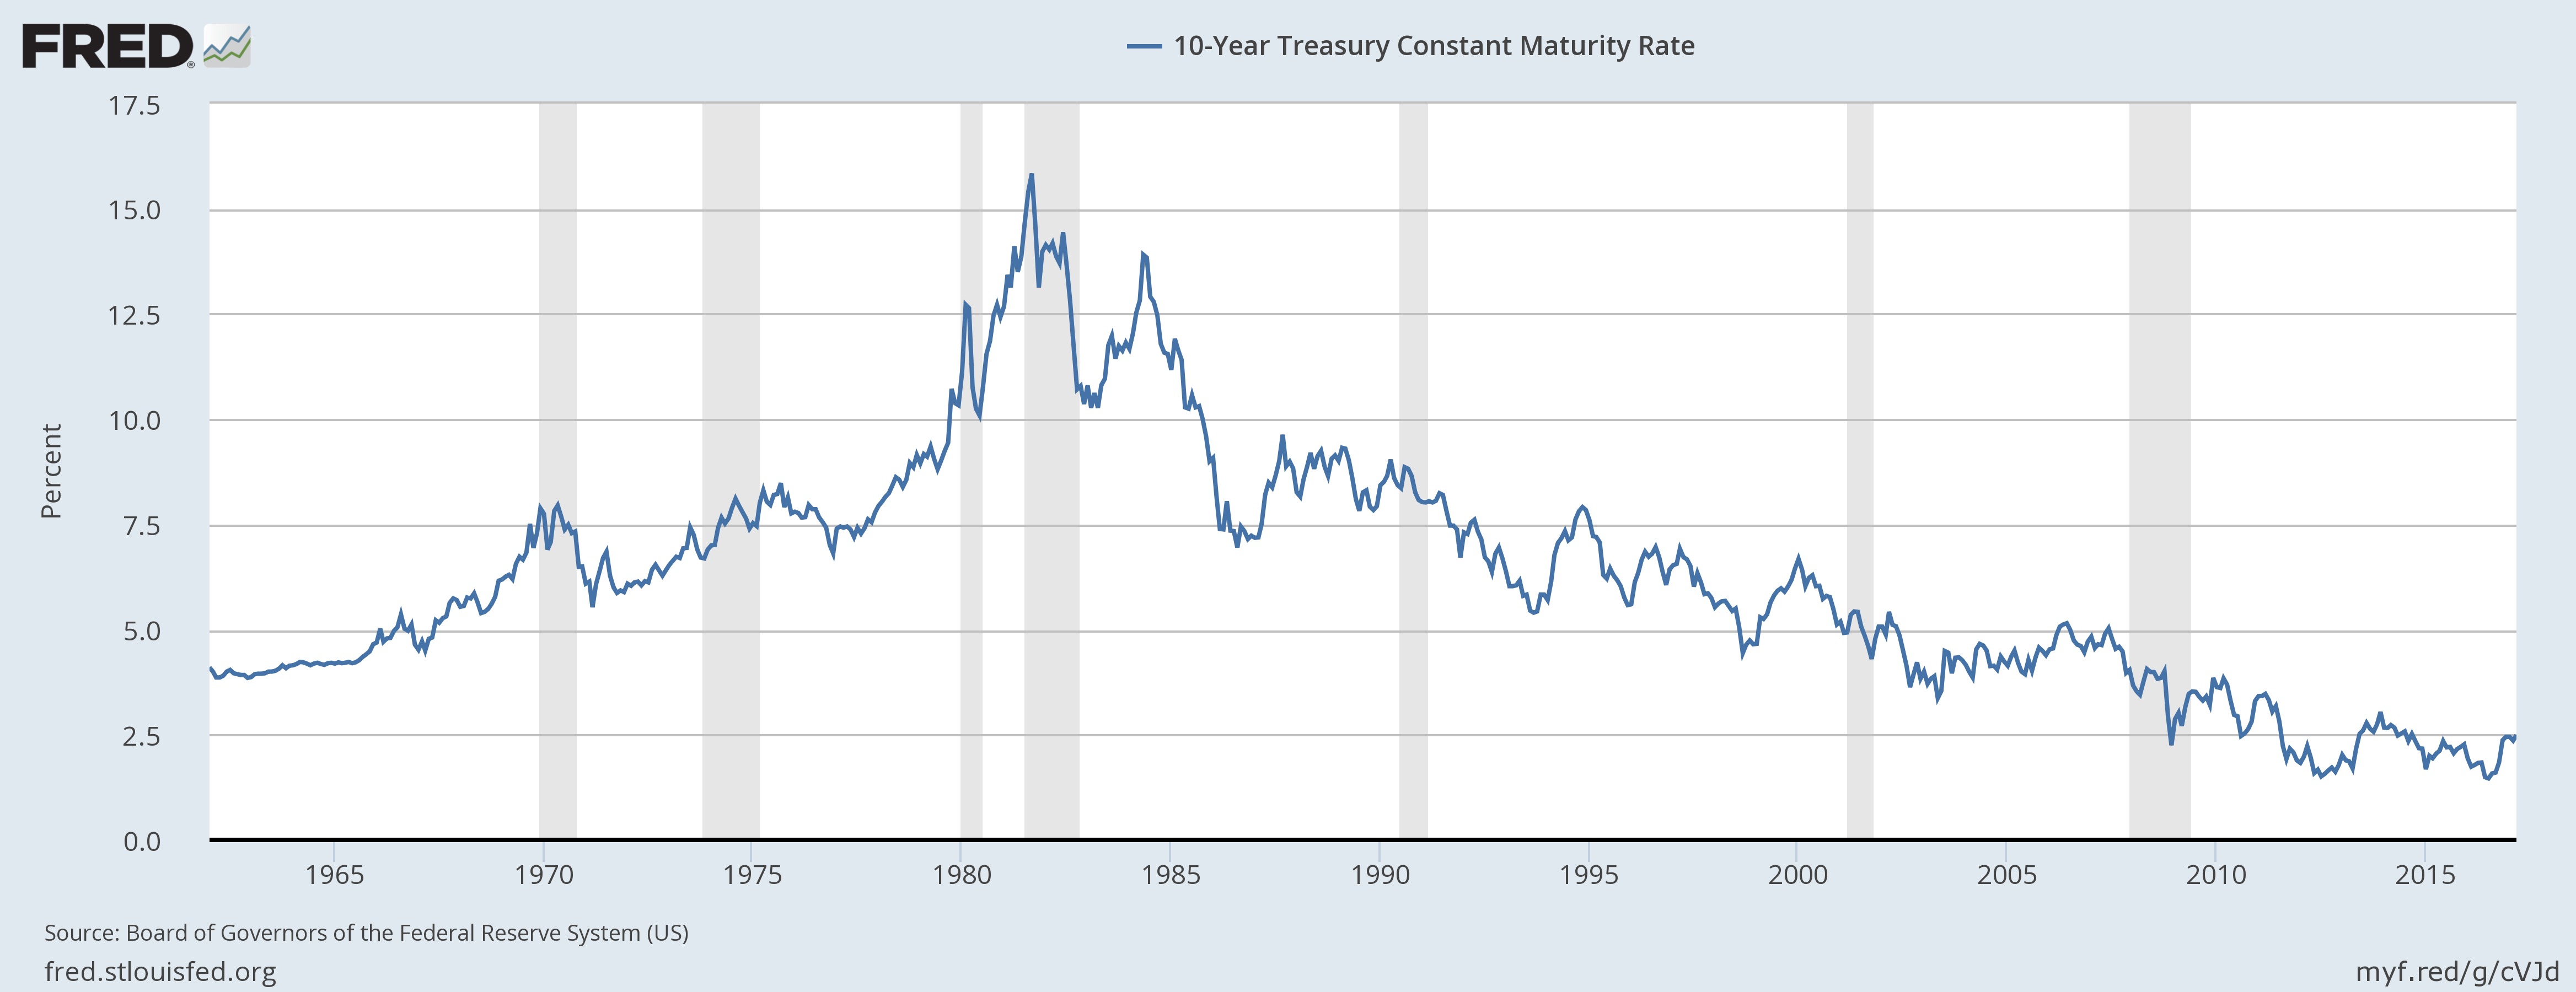
Figure 2. US Federal Bonds 10 year interest rates. Graph produced by FRED (Federal Reserve Economic Data).
Interest rates started falling in 1981. These higher rates only gradually worked their way into the system, because many people had bought houses earlier, and were able to keep their existing mortgages at low interest rates. The amount of debt outstanding continued to rise, allowing the total amount of interest paid to continue to rise until 1986.
After 1986, rising debt amounts and falling interest rates came closer to offsetting each other (Figure 1). By 2008, the economy was in a severe recession. In order to help get out of the recession, interest rates were lowered through Quantitative Easing. These lower interest rates, besides helping the economy in general, helped oil prices gradually increase back to the $100+ per barrel price level that they needed to be profitable. Oil prices had temporarily dropped below $40 per barrel in December 2008.
Figure 1 shows that interest payments for several years amounted to about 12% of wages for households. Interest payments are now down to 8% of wages. Even at this level they are significant. They are likely higher than this for those with low wages and high debt. If interest rates rise significantly, the most vulnerable are likely to find their discretionary income is reduced.
Rising Healthcare Costs
Figure 3 shows a comparison of US healthcare costs to GDP and to wages. A huge increase in costs is evident in the 2001-2005 periods, and also in the 2008-2010 period, especially compared to wages.
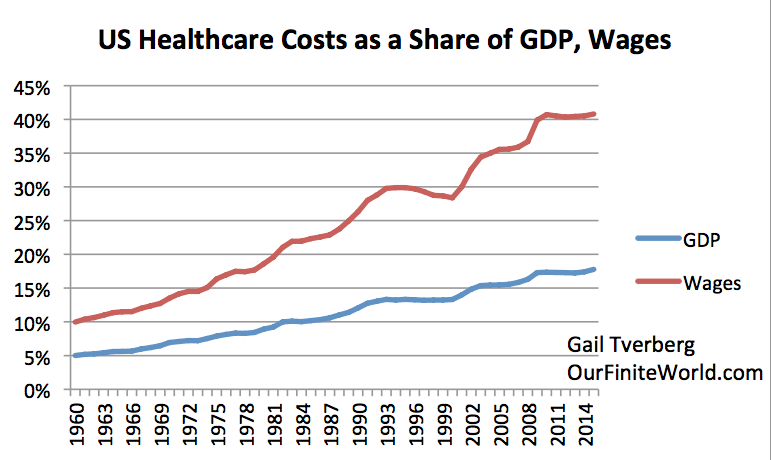
Figure 3. US Healthcare costs as a percentage of GDP and as a percentage of wages. Healthcare costs form cms.gov. Wages and salaries and GDP from BEA.
The increase in healthcare costs since 2008 is one of the costs putting pressure on the economy, and leading to a need for lower interest rates.
The Affordable Care Act should be affecting amounts for the latest years, since the ACA started increasing the number of people with insurance starting about 2014.
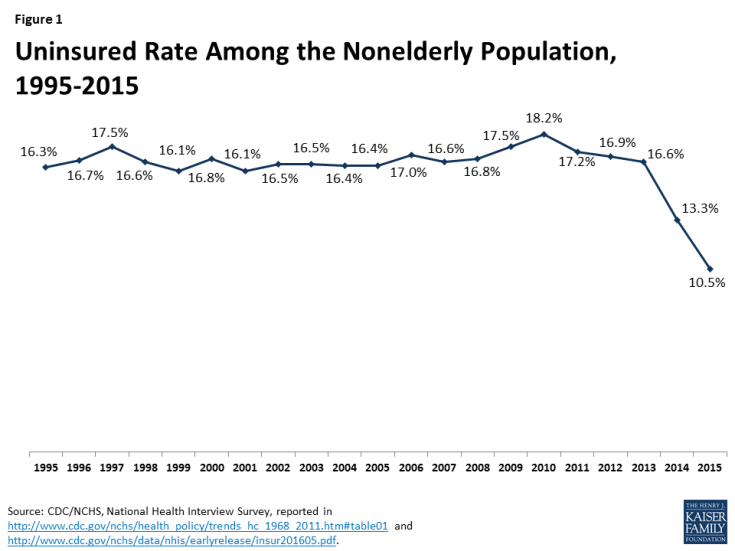
Figure 4. Kaiser Family Foundation chart of percentages of non-elderly people without healthcare insurance, from this Source.
A person might wonder why 2014 and 2015 costs didn’t rise more, with so many more people added to the system. Perhaps care that was being given “free” by hospitals is now being charged back to patients. Or perhaps many of the people choosing to purchase coverage through the program were already insured elsewhere in the system, so were not really added to the healthcare system through the Affordable Care Act.
One very recent US healthcare change is the addition of an automatic penalty for not having healthcare insurance. This penalty began for tax year 2016, filed in the beginning of 2017. This provision particularly hurts young people, because rates are structured in such a way that the rates for young people subsidize the rates for older people. Thus, young people often find that buying health insurance is far more expensive than their out of pocket costs for health care would have been, without insurance.
Young people who are affected by this new requirement will find that they need to cut back on other expenditures (such as restaurant visits), if they are meet the requirements of the law–either buy healthcare insurance or pay the mandated penalty. This change will begin to adversely affect the economy in 2016. Bigger impacts are likely in early 2017, when taxes are filed.
Falling Wages Relative to GDP, and Rising Wage Disparity
The path to lower wages as a percentage of GDP has been a bumpy one. The general pattern is that when the economy is booming, wages tend to grow as a percentage of GDP. Recession tends to send wages down as a percentage of GDP. US wages seem to have increased somewhat since 2013, perhaps because the price of oil is down, and the US dollar has risen to a relatively high level. This is part of what allows some people to talk about the “tightening labor market,” and gives them confidence in the economy.
Figure 5. US wages and salaries divided by US GDP, based on BEA data.
There has been significant growth in wage disparity since about 1980, both in the US and in many other developed countries. Figure 6 shows some data for the US.
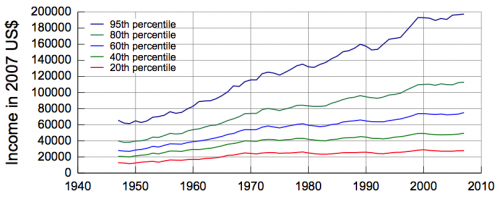
Figure 6. United States Income Distribution_1947-2007 in 2007$. The data source is “Table F-1. Income Limits for Each Fifth and Top 5 Percent of Families (All Races): 1947 to 2007”, U.S. Census Bureau, Current Population Survey, Annual Social and Economic Supplements. Graph is from Wikimedia Commons http://en.wikipedia.org/wiki/File:United_States_Income_Distribution_1947-2007.svg
As the economy becomes more “complex,” in other words, “specialized,” wage disparity tends to be more of a problem. Work that could previously be done by manual laborers is done by machinery, or is transferred to low wage countries. Many people lose their jobs, and have difficulty finding good-paying replacement jobs. All of this contributes to inadequate wages for non-elite workers.
Role of Inflation and Rising Commodity Prices in the Economy
We rarely stop to think how important inflation is to the economy. For example, if inflation is sufficiently high, it will slightly offset normal depreciation in values of home values and business properties. Thus, home and business property values will tend to slightly rise over time. If banks can count on values of structures rising, rather than falling, over time, lenders can assume that mortgage loans are fairly risk-free, because the lender can count on getting its money back through the sale of the property, if the mortgage-holder defaults.
This same principle holds when energy properties, such as coal mines and oil fields are financed. As long as energy prices keep rising, there is a good chance loans can be repaid. Once energy prices fall, debt defaults become a problem. Oil exporting countries also find that the taxes they can collect fall significantly. As a result, energy-exporting countries are in far worse economic position once energy prices fall. Exporters of other commodities, such as metals, have a similar problem if prices fall.
In the last two paragraphs, I mentioned the impact on lenders and governments of rising or falling prices. Owners of properties are also affected by rising or falling prices. If prices rise, these owners can sell their assets, and make a profit. In fact, these owners have often purchased their properties with debt. If the price of the property rises, but the amount of debt is unaffected by inflation, the owner of the property can often get a disproportionate benefit of the price rise. Of course, if the value of a property falls, the property-owner is disproportionately affected by the fall of the price.
We are so used to a rising-price scenario that we have little understanding of how a flat or falling price scenario might work.
To get a little idea of how much inflation has in the past been working through to asset prices in the United States, I looked at some information provided by the US Bureau of Economic Analysis. I compared these amounts to GDP, rather than asset prices, to get an idea of how much impact they have, relative to each current year’s activities (Figure 7). There is about $3 of assets of the types BEA analyzes for every dollar of GDP, so the impact, relative to GDP is about three times as high it would be, relative to the asset prices themselves.
If this same relationship holds elsewhere, a person can see why a commodity-producing country might have a big problem, if the price of that commodity suddenly falls. There is huge “balance sheet” impact that doesn’t directly affect current GDP as reported (since GDP has to do with current goods and services produced). But it can have a major impact on the country, as it goes forward, because affected loans are much less likely to be repaid. Countries often try to be lenient with lenders, hoping that commodity prices will rise again. But if the drop in prices is permanent, countries must use more and more extreme measures to hide the problem of loans that have a low probability of repayment in a low-priced commodity environment. Eventually, these loans seem likely to default, if prices do not rise sufficiently. China and many commodity-exporting countries seem to be affected by this problem.
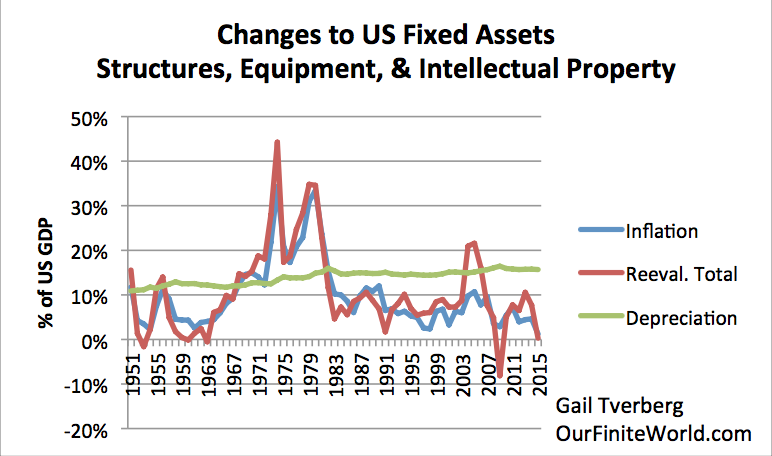
Figure 7. Changes to US Fixed Assets, based on BEA Table 5.10, Changes in Net Stocks of Produced Assets.
BEA shows three amounts of interest with respect to US assets (Figure 7):
- Inflation – Changes in asset values based on changes in the general price level
- Re-evaluation total – Changes to asset prices in particular; includes changes because assets are taken out of service because of disaster or because a business is no longer profitable. Note the spikes related to the housing bubble of the 2003-2006 period and the corresponding dip during the Great Recession of 2007-2009.
- Depreciation – Expected amount of new investment needed to offset “consumption of fixed capital.” This rate is quite high, (about 15.7% of GDP recently) because the asset base includes fairly quickly depreciating assets, such as cars and computers, besides buildings of all types, and intellectual property such as computer programs.
The last year shown is 2015. Inflation (relative to GDP) was only 1.2%, and the re-evaluation total was only 0.3% of GDP. (Calculated as percentages of the assets involved, these inflation rates would be only a third of these amounts.) These low inflation rates make it very difficult to operate a debt-based economy. A shift from inflation to deflation would be a major problem. Unfortunately, it is very difficult to get much inflation, if the wages of non-elite workers remain very low.
Conclusion
We have kept our economy growing through growing debt use and growing energy use. I described this process in my post, What has gone wrong with oil prices, debt, and GDP growth?
Now we seem to be reaching the end of the line. The economy is getting very close to shrinking. When this happens, we are getting close to economic collapse–the economic circus is starting to “leave town.”
People who think our only problem is “running out” and “high oil prices” don’t see the problems the economy is reaching right now. These problems are much more subtle, but they can have a devastating effect. The Federal Reserve talks about inflation rates above 2% being too high, but inflation rates below 2% are at least equally problematic. Somehow, the debt system needs to keep operating for the whole system to work.
We are now at the point where the economy is decidedly unstable. Little things can affect it, like the Affordable Care Act requirement that uninsured people buy healthcare insurance, or pay a penalty. Low commodity prices make debt repayment more difficult in countries producing those commodities.
We should not be too surprised if the economic circus starts to leave to leave town. There are simply too many pieces that are now unstable. The US Government is facing a shutdown in the near future, unless its debt ceiling can be raised and funding can be enacted. The world is depending on China for economic growth, but China’s debt is becoming unmanageably high. Japan’s debt is also unreasonably high. Oil exporters are becoming increasingly unstable, with the continued low prices. We can find problems in almost every country of the world. It looks like it is only a matter of time, until one of these problems starts a downward spiral.
26 Comments on "The Economy Is Like a Circus"
onlooker on Mon, 17th Apr 2017 4:50 pm
All of these factors analyzed and pinpointed as key factors are simply symptoms of the overreach or overshoot of humanity as a whole.
The underlying sickness is a degraded Earth that can no longer supply the resources and desired by such an enormous human population and which is overburdened with the waste byproducts of humans and their civilization. No economic tinkering can solve it as it is hard limits being imposed by Nature on what humans can and cannot do
makati1 on Mon, 17th Apr 2017 5:20 pm
Onlooker, I would say that it is NOT population, but greed that is taking down the Western countries and wannabees. Debt has put a noose around every Western citizen’s neck. Filipinos live fairly comfortable and happy lives with an average income of about $3,000 per person vs the U$ at $56.000 per person. And low, if any, debt. Most have never had a bank account and getting a loan here is not easy even if you have a good job and income.
Yes, Americans live longer, but those last years are pill popping expensive and most do not actually enjoy them. (Philippines 69 years vs U$ 79 years life expectancy.) I can tell you that the years after 70 are not so much fun. I enjoy good health, yet I have my bad days and my good days. There are limits to what I can do physically. And the days get more and more boring. I can only imagine the life of those with serious health problems, living on meds and doctor visits, and wondering of their savings will last as long as they do. That is existing, not living.
makati1 on Mon, 17th Apr 2017 5:24 pm
BTW: Who gives a f–k about the “economy” when the world is on the brink of war and the climate we need to survive is disintegrating as we type? It may be too late to change the course we have set, but if there was less consumption/economy it may slow down the possibility of either and give our kids and grands a chance.
Davy on Mon, 17th Apr 2017 5:27 pm
So makati, you are saying population is not a global problem let alone a predicament. I freely admit greed is also an issue. I think living above the most densely populated city on earth has you bargaining. You want to tell yourself population is not an issue because you are the expression of the issue.
onlooker on Mon, 17th Apr 2017 5:45 pm
Mak, all you are saying is true but does not negate the full panorama of predicaments that derive from BOTH over consumption and overpopulation. Asia and the Middle East are drawing down aquifers that will not be replenished any time soon as it took thousands and millions of years to fill. Soil erosion continues unabated because of wind and rain wash off due to so many forests being cut down. And worse of all China and India, the two most populated countries have themselves adopted a Western consumeristic orientation. Humans have shown to not be content with just the bare necessities. So we can dwell on Western excess but should deny the unsustainable nature of human population growth
makati1 on Mon, 17th Apr 2017 5:47 pm
Greed is THE issue, Davy. Especially Western/American greed. Denial of that fact is the reason we are in the situation we are in. Wasted consumption of resources by the few at the expense of the many is killing the ecology and the human future. Greed.
makati1 on Mon, 17th Apr 2017 5:52 pm
Onlooker, The U$ is drawing down its aquifers even faster than the Asians, but you do not read that in the news. It is a negative that you are not supposed to know. The U$ has no reason to point the finger at others until they clean up their own act. Not going to happen. Americans prefer to consume like locusts. Total collapse of the money system is all that MAY save humanity. Globalization must end or there is no future. Bring it on!
Davy on Mon, 17th Apr 2017 6:07 pm
What is really horrible is an overpopulated Asia combined with Asian greed to boot. Makati is right in the middle of the thick of it and he is bargaining away his complicity and denying his risk.
Davy on Mon, 17th Apr 2017 6:09 pm
“The U$ is drawing down its aquifers even faster than the Asians” LOL, all the more reason for Asians to worry since the US is a major food supplier for them.
AFDF on Mon, 17th Apr 2017 10:43 pm
@Our Finite World.
One minute of sunlight reaching the earth is equal energy expendicture of thw world for an entire year. Let’s be very conservative and says it equals to usable energy for teh world for only one hour. That’s a factor of 60!
My algebra tells me populaton can go all the way up to 420 billions.
AFDF on Mon, 17th Apr 2017 11:19 pm
Money is just a a mean to remove oneself from the labor pool. When we mint a new millionaire we lose him and have to find a new person to fill his role. The millionaire still needs to go shopping and requires services.
The people with money depend on the people who work.
The only way rich people have over poor is the exercising of money. All other forms of exercising power is too costly and risks exponential economic dimishing return.
Money has been around for a long time. It will be around for a long time.
makati1 on Tue, 18th Apr 2017 12:05 am
AFDF, if you mean by “money” you are saying barter and trade will be around. Money, not so much. The metal and paper in your pocket is worthless if no one wants it. However, if you have a chicken to trade for a bottle of vodka, BOTH have true value. After the SHTF, if you offer me a million dollars for that chicken, I would refuse it unless it was in small bills and I could use it to start fires. It’s not even good for wiping your butt. LOL
GregT on Tue, 18th Apr 2017 12:39 am
“LOL, all the more reason for Asians to worry since the US is a major food supplier for them.”
LOL for sure. Total US agriculture exports amount to ~$135 billion per year. Around a third of those exports are to Canada and Mexico.
“Over the past 10 years, U.S. agricultural exports to China have grown over 13 percent annually on average. However, exports to China peaked in 2012 at $25.9 billion, then remained steady for 2 years before dropping by over $4 billion in 2015.”
https://www.ers.usda.gov/data-products/chart-gallery/gallery/chart-detail/?chartId=58374
22 billion divided by 1.3 billion people works out to 17 dollars per person per year. Hardly what anybody should consider to be a MAJOR supplier. Besides, the US is currently running a trade deficit with China alone, of around $350 billion dollars per year.
https://www.thebalance.com/u-s-china-trade-deficit-causes-effects-and-solutions-3306277
GregT on Tue, 18th Apr 2017 1:19 am
“My algebra tells me populaton can go all the way up to 420 billions.”
You might want to work on getting a firm grasp of basic arithmetic, before jumping head first into algebra, A Former Davy Fan.
Cloggie on Tue, 18th Apr 2017 1:38 am
My algebra tells me populaton can go all the way up to 420 billions.
Are you sure?
https://en.wikipedia.org/wiki/India
3.3 million km2
1.3 billion people
World’s inhabitable land: 64 million km2
If you want to turn the entire world into one giant India:
(64/3.3) * 1.3= 25 billion people.
And you think that you can increase Indian population density by another factor of 16?
You sir, you are an idiot.
Please don’t take it personally.
Davy on Tue, 18th Apr 2017 4:35 am
Greg, are you aware of minimums? I think you are an emotional nationalist that picks and chooses facts. You want above all else for the US to be brought down and along with makati you preach an agenda that reflects that. I ask you to go back and support what makati said and then get to the part where I commented. You will see I showed that his agenda and yours are against themselves. China and Asia are nearing their limits of food production if the US supplies drop then what? Are you saying the largest global exporter of the basics of the global food chain is irrelevant? Yes, that is what you are saying. Earlier makati was crowing how unemployed Asians are returning to their self-sustaining villages. What villages are there that have not been destroyed by overdevelopment, pollution, and overpopulation. This is about all of us in this together with altered circumstances. It is not about an anti-Americanism claiming a victory and failure. You and makati are warped nationalistic hateful people and your message is hate based. You will fail because of your hate.
makati1 on Tue, 18th Apr 2017 5:36 am
GregT, few people do the math. The per capita numbers are the important ones. Americans want to think they are important, but the world would n9t miss them for more than a minute if they were to disappear. Whereas, if China stopped exporting to the U$, the Americans would be in a world of hurt. They should check and see where the components for all of their techie toys come from. They are afraid to check the “Made In” labels. EVen if it doesn’t say China, the parts inside were made there, then shipped to Taiwan, Japan, S. Korea, etc for assembly. Ah well. You cannot educate those who don’t want to be educated.
Davy on Tue, 18th Apr 2017 5:52 am
Not only is China approaching food supply limitations it now has a significantly declining domestic oil base. Sinophiles here gloss over these details with targeted anti-Americanism. They crow about fake Chinese growth with the argument that big numbers are more than small. This without the “all important” detail and fine print. Basically we have a forum of intellectual lazy agenda gaming. The gamers highlight well know US issues of decline and dismiss China’s. Maybe the truth it is closer to both economic superpowers, who are connected at the hip, are facing limits that can only bode ominously for the rest of the world especially Europe. When the US and China are in decline so is the world. Game over.
“Where Does The World’s Biggest Oil Importer Get Its Crude”
http://tinyurl.com/lgwclfq
“Growth in China’s total crude oil imports in 2016 reflected both lower domestic crude oil production and continued demand growth. After increasing steadily between 2012 and 2015, China’s crude oil production declined significantly in 2016. Total liquids supply in China averaged 4.9 million b/d in 2016, a year-over-year decline of 0.3 million b/d, the largest drop for any non-OPEC country in 2016. U.S. crude oil production fell by more than 0.5 million b/d in 2016, but total liquids declined by less than 0.3 million b/d because other liquids production increased by less than 0.3 million b/d.”
“Much of Chinese production growth from 2012 through 2015 was driven by more expensive drilling and production techniques, such as enhanced oil recovery (EOR) in older fields. As oil prices declined during 2016, investments in developing new reserves also fell and were not high enough to offset the natural production declines of older fields.”
GregT on Tue, 18th Apr 2017 9:34 am
Davy,
Canada has much more to be concerned about in regards to US agricultural exports than China does. The past several years of California drought have already affected grocery prices here considerably. We have however, been seeing an increase in produce imported from other countries. China being one of them.
AFDF on Tue, 18th Apr 2017 11:36 am
China has tons of water so it’s not a problem. Considering the amount of water being pumped from the ground and diverted for agriculture uses, it is peak fresh water is a real concern.
They would like us to focus on industrial fertilizer and insecticides, plus GMO.
When putting everything into quantitative perspective, it is water that made possible modern agriculture.
Apneaman on Tue, 18th Apr 2017 12:00 pm
I’ll gladly pay you tuesday.
Restaurants in Worst Tailspin since 2009/2010
This thermometer for discretionary spending is the first to react when consumers hit their limits.
http://wolfstreet.com/2017/04/13/chain-restaurant-sales-traffic-in-worst-tailspin-since-2009-2010/
Apneaman on Tue, 18th Apr 2017 12:03 pm
U.S. Car Demand Collapse Jeopardizes Trump’s Auto Factory Push
-Swerve in consumer taste changes equation for the industry
-‘You’re not going to see’ new U.S. car plants, consultant says
https://www.bloomberg.com/news/articles/2017-04-04/u-s-car-demand-collapses-in-threat-to-trump-s-auto-plant-push
Apneaman on Tue, 18th Apr 2017 12:07 pm
Neurological diseases cost the US Nearly $800 billion per year
“Costs will increase even further over the coming years as the elderly segment of the population nearly doubles between 2011 and 2050. The costs of dementia and stroke alone are projected to total over $600 billion by 2030.”
https://www.sciencedaily.com/releases/2017/03/170328105855.htm
Same in all the fat spoiled countries.
Apneaman on Tue, 18th Apr 2017 7:41 pm
Too cheap to meter
World’s nuclear giants limp toward extinction
” Any lingering hope that a worldwide nuclear power renaissance would contribute to combating climate change appears to have been dashed by US company Westinghouse, the largest provider of nuclear technology in the world, filing for bankruptcy, and the severe financial difficulties of its Japanese parent company, Toshiba.”
http://www.carbonnews.co.nz/story.asp?storyID=12245
Cloggie on Wed, 19th Apr 2017 2:52 am
World’s nuclear giants limp toward extinction
It’s official, renewable energy has won the competition world-wide. It’s now the cheapest and least problematic form of energy generation. On top of that, the energy generation is local, eliminating all sorts of entanglements, military bases, long supply lines through geopolitical hot spots, etc.
Solar Age is next.
Cloggie on Wed, 19th Apr 2017 2:58 am
The US-based global management consulting firm A.T. Kearney produces a global “foreign direct investment confidence index”. The 2016 result are in:
https://www.atkearney.com/gbpc/foreign-direct-investment-confidence-index
The US is still on top, but almost all European countries improved their ranking, including Britain. Germany surpassed China and is now #2.
The report also states that Germany could very well become the big winner of the Brexit drama:
http://www.spiegel.de/wirtschaft/unternehmen/investitionen-unternehmen-finden-deutschland-besonders-attraktiv-a-1143807.html