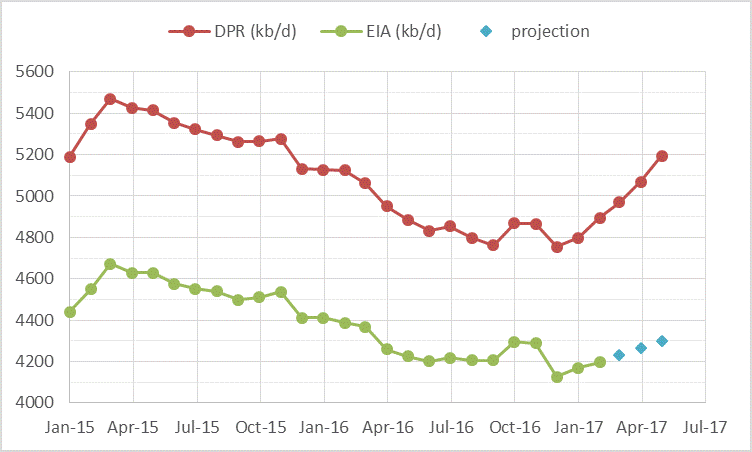
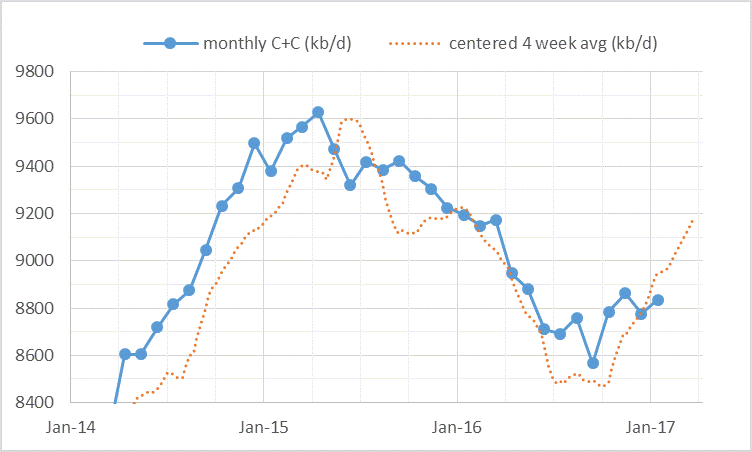
A number of news media pieces have recently suggested that oil prices may fall due to soaring output in the US. Output from US light tight oil (LTO) may not rise as quickly as some EIA reports may suggest. One source of confusion is that the EIA creates many reports and some are more reliable than others. The two charts below cover US LTO and US crude plus condensate (C+C) output.
US LTO Output from the EIA Drilling Productivity Report (DPR) and EIA Tight Oil (LTO) estimates in kb/d.

US EIA monthly C+C output and centered 4 week average output in kb/d.

The data for the DPR and for tight oil output are found at the links provided at the US EIA website. The data for US monthly C+C output and the 4 week average US C+C output is also from the EIA. The 4 week average data is a trailing 4 week average, I centered it by moving it back in time by 2 weeks.
The reason the DPR has higher output is that it covers all output from the various LTO regions which includes conventional C+C output from those regions. The EIA Tight oil estimate reports primarily LTO output from these regions, in Nov 2016 the difference was about 575 kb/d and this is similar to the average difference from August 2016 to November 2016. If we assume conventional output remained close to 575 kb/d in the LTO regions from December 2016 to February 2017 and that the EIA estimate may be more accurate than the DPR model, then the DPR data is too high by 50 kb/d in Dec and Jan and about 100 kb/d too high in February 2017. The EIA expects oil prices to remain at $55/b or less until the end of 2017, if this guess is correct (based on futures contracts), I give my projection of LTO output from March to May 2017 (an increase of 35 kb/d each month). The DPR estimate from Dec 2016 to May 2017 is about 3 times higher and not consistent with oil prices of $55/b or less in my view.
The second chart above is another reason that many analysts seem to think that US oil output will rise very rapidly, especially if one fails to realize that the weekly output data is often wrong by 200 to 300 kb/d for any given four week average. The monthly data is far more accurate and is revised when incorrect (the weekly data is never revised). In my opinion the weekly data is so inaccurate that it would be better not to report it at all as it simply increases oil price volatility by giving false signals to the market.
A sample of some recent stories at the Peak Oil News website.
Oil prices dip on bloated U.S. market, mixed Saudi signals
U.S. Shale Surging, But Oil Holds Steady
Oil prices fall on expected surge in U.S. shale output
Citi Sees $65 Oil By Christmas
The market would be a little less confused if it paid less attention to the Drilling Productivity Report and the Weekly Supply estimates from the US EIA. The monthly US crude plus condensate estimates and the monthly tight oil estimates are not perfect, but are far better estimates of reality.


rockman on Thu, 20th Apr 2017 8:01 am
There’s an even more basic problem matching oil prices to production levels regardless of the data base used: they often don’t correlate regardless of the data base. Just consider that from 2008 to 2009 oil prices fell from an average of $89//bbl to $57/bbl. And how much did production/consumption increase in 2009? It didn’t…it decreased. So high prices and higher production in 2008 and both lower in 2009. And yet in recent years just the opposite: lower prices and increased consumption/production.
Of course, adjusting for lag can help except that’s often is problematic given other factors that can kick in.