Peak Oil is You

Donate Bitcoins ;-) or Paypal :-)
Page added on December 29, 2015
Want To Bring The Oil Market Into Focus? Adjust Prices For Inflation
Summary
The world oil market is estimated to be oversupplied by 1.5M BBL/d, yet Saudi Arabia and OPEC continue to maintain higher rates of production.
Prices of oil have plummeted since mid-2014 from highs above $100 per barrel to recent lows below $35 per barrel in December 2015.
This article reviews the oil supply and pricing dynamics since the Arab Oil Embargo, including 5 other points over the past 40 years when oil went up and down dramatically.
The data reveal that if you inflation adjust prices back to a time pre-Embargo, using 2015 prices, $50 per barrel is currently the point that prices are likely to stay.
Additionally, market price and supply levels post 1986 provide valuable investor insight into the geopolitical landscape changes required to change the current market trajectory.
Market discussion was heated after the December 4, 2015 OPEC meeting about whether the organization was “losing its relevance.” The argument was that since the price of oil continued to free fall after the meeting because the Saudi led cartel did not scale back production to support the price, that somehow the organization had lost its grip on the world oil market. The inability of the group to agree on an official quota left organization members producing at a rate of 31.5M BBLs a day. The result of the meeting was not received well by the market. Subsequent to the meeting, the prices of crude dropped below $35 per barrel for WTI and $40 per barrel for Brent and show little sign of quickly rebounding.
To understand the relevance of OPEC today, I believe you need to review the history of points in time that the price of oil moved significantly, both up and down. And, since oil is priced in U.S. dollars, the prices need to be normalized for U.S. inflation through time so that changes in the supply of oil relative to demand can be better understood. With this framework in mind, I went back to the point in history when OPEC was arguably at the peak of its power as an organization, the Arab Oil Embargo, and examined 5 major price discontinuity points since that time. I share the results in this article.
Early 1970s: Arab Oil Embargo Creates New Oil Price Paradigm
In the history of OPEC, the rise of the organization’s power closely aligns with the 1971 abandonment of the gold standard by the United States. In early 1971, the price of oil was trading at $3 per barrel. It was an acceptable price because under the Bretton Woods fixed exchange rate system, the U.S. government backed every trade transaction with gold. Under the system, every $35 in trade was exchangeable into 1 oz of gold (about 12 to 13 barrels per ounce).
Once the gold standard was abandoned by Nixon in 1971, there was a major problem. Gold was not trading in the free market at $35 per ounce in 1971, and began to escalate in value more quickly once Nixon abandoned the fixed exchange system. By 1973 gold began trading at over $100 per ounce. However, the price of oil did not keep up, constrained by U.S. price controls. Many cartel members voiced increasing discontent, and there were revolts which led to the nationalization of many oil companies by OPEC countries. The result by 1974 was the ability of OPEC members to constrain supply to western economies and demand an increase the price of oil in U.S. dollar terms.
(click to enlarge)
Tensions surrounding the growing impasse eventually escalated to a climax point in late 1973, the Arab Oil Embargo. The international settlement led to the dollar price of oil, set by OPEC, increasing, overnight in January 1974, from $4.31 per barrel to $10.11. (See nominal price line) The upward adjustment reflected the movement in the gold relative to oil since the U.S. abandoned the gold standard. From that point on through the late 1970s, the price of oil was periodically increased by OPEC. The price increases were highly correlated with U.S. inflation which was rampant at the time. The U.S. fixed price control regime was phased out beginning in June 1979, and since that time the world price of oil has mostly been influenced by open market trade, quoted in U.S. dollars. However, 40 years after the Embargo, Saudi Arabia, because it is the low-cost supplier of oil, continues to have the biggest say on the price level that oil actually trades.
As the U.S. maintained regulatory price controls through the 1970s, you can see that the incentive to find new oil in the U.S declined, as did production, resulting in shortages and pent up price pressures that were released at the end of the decade.
There was one important outcome of the Western Energy Conference in February 1974 which led to a new agreed pricing paradigm between the U.S. and OPEC. During the conference, led by Henry Kissinger, Saudi Arabia, as the market leader, agreed that it would quote and settle its oil trade in USD in exchange for U.S. defense support if necessary for its oilfields. This agreement insured that the market would trade primarily in USD for all international transactions, and migrate away from gold through time as a relative value measure. This event gave birth to the petro-dollar recycle industry, and laid the foundation for massive expansion of western capital markets, and the subsequent escalation of the U.S. national debt.
(click to enlarge)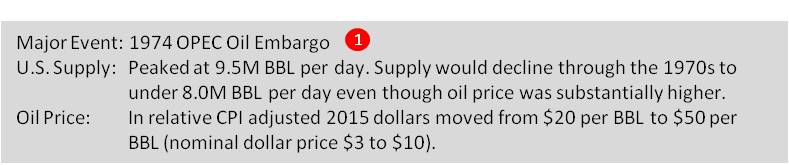
One of the implied agreed outcomes of the Arab Oil Embargo was to protect the value of oil from U.S. fiat currency inflation. Going back in time and adjusting the price of oil for inflation, therefore, has real value in bringing the current oil market into focus. When you look at the pre-Embargo and post-Embargo price in 2015 dollars, what you find is that $20 per barrel today was completely unacceptable to all cartel members. Post-Embargo, the settlement price in 2015 dollars was $51.42 per barrel. In short, the December 2015 price of oil reaching $35 per barrel is a price point 42 years ago that would not have been acceptable, but it also is still higher than the pre-Embargo level. As you move forward through time to other significant price disrupting events, you will see the significance of this point.
Iran Hostage Crisis – Oil Prices Escalate Much Higher Than Post-Embargo Level
The Iran Hostage Crisis is described by many historians as having its origins in an increasingly intense conflict over oil. In cooperation with the Iranian government, the first Middle East oil was discovered in Iran in 1911 by the Anglo-Persian Oil Company, a British company. In 1951, Iran’s newly elected Prime Minister, Muhammad Mossadegh, announced a plan to nationalize the country’s oil industry. A regime change followed, said by various historical accounts to have been led by western interests. The new leader was a member of Iran’s royal family named Mohammed Reza Shah Pahlavi – a.k.a. “The Shah” of Iran. The Shah was predisposed to lean toward western interest when it came to the pricing of oil. However, the sentiment within the country was that the price of oil should be much higher, as much as 10 times higher than the pre-Embargo level.
Tensions within Iran escalated to the point that the Shah was forced into exile in January 1979. The revolt, known as the Iranian Revolution, led to a theocratic Islamist government being instituted in Iran under the control of Ayatollah Khomeini. As the Revolution continued, Iranian oil production curtailed. The tensions between Iran and the U.S. culminated in the Iran Hostage Crisis which began on November 4, 1979. In response to the hostage taking, Jimmy carter banned U.S. imports of Iran oil. All of the geopolitical tension was taking place simultaneously to the price decontrol of the oil industry, beginning in June 1979.
(click to enlarge)
With the high level of geopolitical tension and constraints in supply from the Middle East region, in nominal terms, the price of oil did rise to 10 times greater than the pre-Arab Embargo level during the Hostage Crisis.
(click to enlarge)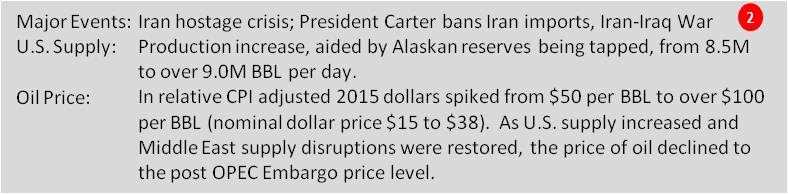
The Iran Hostage Crisis did not end until the beginning of Ronald Reagan’s presidency in 1981. Historically, that marked the peak in that time period of oil prices in nominal terms at $38 per barrel ($120 in 2015 dollars). World supply began to increase at the higher price levels, including U.S. supply, and the price of oil began to decline through the early 1980s. As the price began to decline, it was said that OPEC was losing control of world oil prices (sound familiar?). However, geopolitical unrest remained in the Middle East, as the Iran-Iraq War which commenced in 1980 raged on until resolution in 1988. World supplies of oil continued to be tight as Saudi Arabia pumped less oil while the U.S. pumped more oil. In the early 1980s, the oil price remained above the post Embargo level in inflation adjusted terms until a counter acting event began in August 1985, led by Saudi Arabia.
Saudi Arabian Initiates Market Share Strategy
The OPEC driven dramatic oil price rise in the 1970s is fascinating when reviewed in the context of world demand for oil versus supply. During the 1970s, world oil demand rose significantly, from just over 45M BBL/d in 1970 to an interim peak of over 65M BBL/d in 1979. After the spike in prices in 1979, however, world demand began to decline, particularly in the United States, as initiatives to cut energy consumption such as new car auto mileage standards began to have an effect.
(click to enlarge)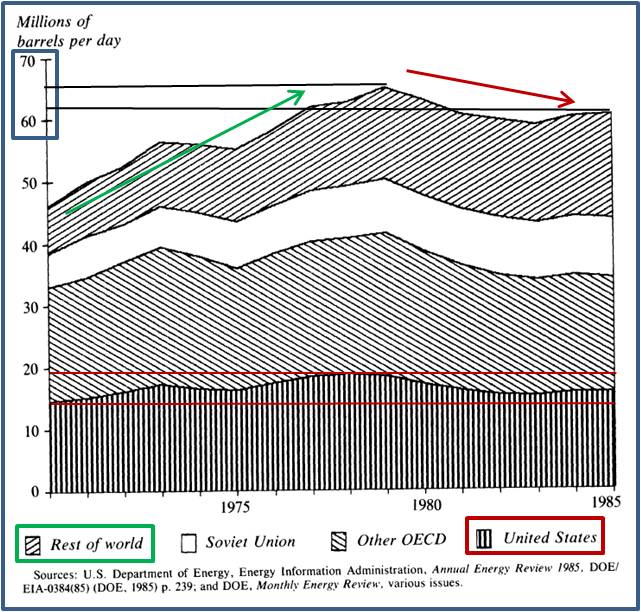
United States oil consumption fell in the early 1980s from a peak of almost 20M BBL/d to levels experienced a decade early closer to 17M BBL/d.
In 1985, against the backdrop of falling world demand for oil, particularly in the United States, Saudi Arabia initiated a major unilateral price and production policy change counter to the desires of many OPEC members such as Iran.
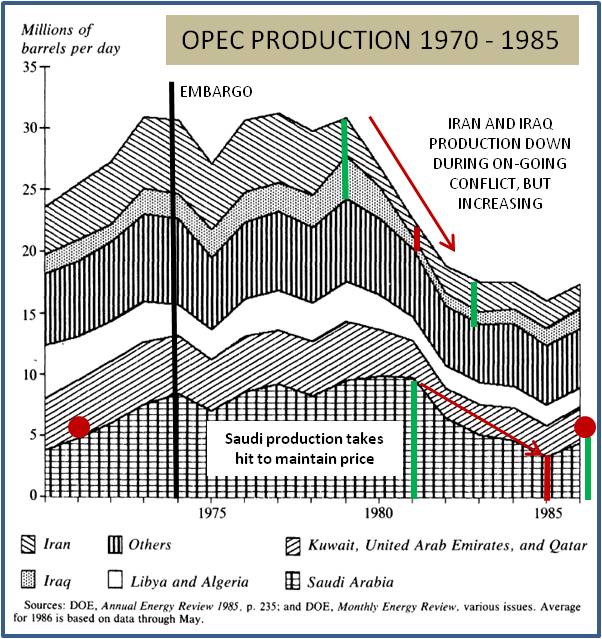
In August of 1985, Saudi Arabia signaled that it would link oil prices to the spot market. At that point in time, they also began raising output. The Saudis raised production from 2-3 MMB/D in August 1985 to 5 MMB/D by early 1986. The production move restored its production to levels prior to the Arab Oil Embargo. Given the supply and demand situation in the world at that time, the drop in oil prices was dramatic and quick.
In November of 1985, the nominal price of oil was $30.85 per barrel ($67.29 adjusted for inflation in 2015 dollars). By July of 1986, oil was trading at $11.86 per barrel ($25.16 inflation adjusted). The Saudi strategy change from residual swing supplier to market share maintenance dropped the price of oil into the pre-Embargo zone of $20 to $50 per barrel in 2015 dollars.
(click to enlarge)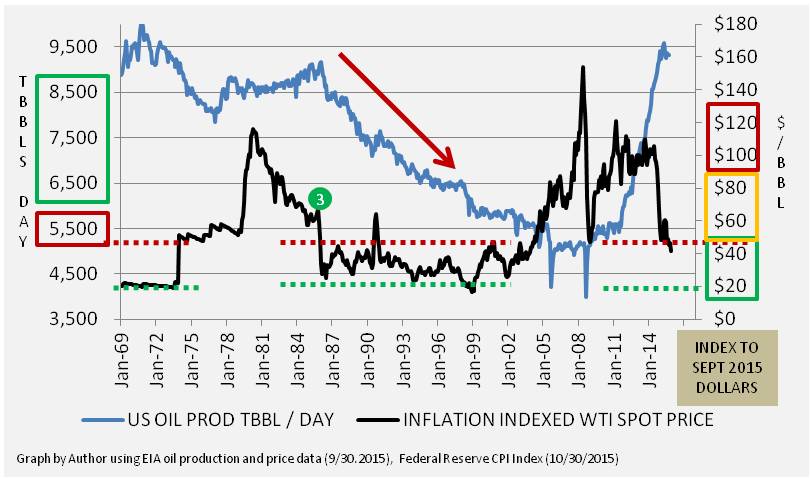
U.S. production at the lower price level took an immediate hit, peaking at 9.2M BBL/d in February 1986 and dropping to 8.4M BBL/d by December 1986. U.S. supply would drop year after year for the next 20 years, reaching levels below 6M BBL/d by the 1999.
The price of oil in inflation adjusted prices, remarkably to me, stayed contained below the inflation adjusted zone from 1986 through 2005, with only one exception. The exception was the Persian Gulf War, when Saddam Hussein invaded Kuwait in early August 1990. The conflict, as usual for the region, was over oil. Hussein accused Kuwait of using directional drilling to siphon oil from the Ar-Rumaylah oil fields located along their common border. Additionally, Iraq owed Kuwait $18B in loans it wanted forgiven from the Iran-Iraq War. With U.S. and allies intervening, the conflict over on February 28, 1992 when President Bush declared a cease fire.
(click to enlarge)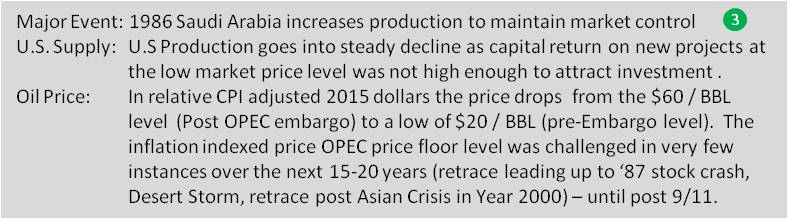
As a result, oversupply of oil in the world market persisted as OPEC cartel members continued to cheat on their quotas in order to drive volume to satisfy dollar needs for their own economies. It would take many years before the world over supply of oil would tighten up.
1997 Asian Currency Crisis Marks Turning Point for Oil Prices
A series of events at the end of the 1990s is worth noting because it marked an important turning point in the cycle of oil prices.
The Asian Currency Crisis in 1997 led to a major collapse in oil prices to levels not witnessed in inflation adjusted terms since prior to the Arab Oil Embargo. OPEC cut production quotas throughout the crisis in 1998 to reign in the price drop. Once the supply cuts took hold a very strong retracement rally in oil began from 1999 through 2000.
The peak of the rally stopped short in November 2000 of breaking above the post-Embargo level of $50 in 2015 dollar terms. The U.S. economic recession post year 2000 briefly arrested the oil price turnaround. But, the foundation for much higher oil prices was in place. Asian demand growth recovered and the U.S. dollar began to weaken, wounded by lower petro-dollar flow and higher trade deficits. These elements, combined with continued declines in U.S. production, were creating a recipe for a return to a 1970 style price spike.
Tumultuous 2000s – U.S. Currency Weakens, Oil Currency Strengthens
From 1986 until 2005, the incentive for U.S. investment in new oil was low, and production steadily declined. The trend finally showed signs of changing by mid 2000. What changed? Middle East geopolitical tension combine with world oil demand driven by Asia led to the tightening of the world supply and demand imbalance, and higher prices made U.S. production feasible again.
As the U.S. came out of the 2001-02 recession, the country was on the verge of U.S. oil production dropping to levels not experienced since the 1940s. Meanwhile, the U.S., not only engaged in a War in Afghanistan, also became entangled in a War in Iraq in 2003. The price of oil breached the post Arab Oil Embargo level in inflation adjusted terms in July 2004 when in nominal dollars it surpassed $40 per barrel. From that point forward until June 2008, just prior to the September Lehman Brothers bankruptcy, oil sky-rocketed higher, reaching a peak over $145 per barrel.
(click to enlarge)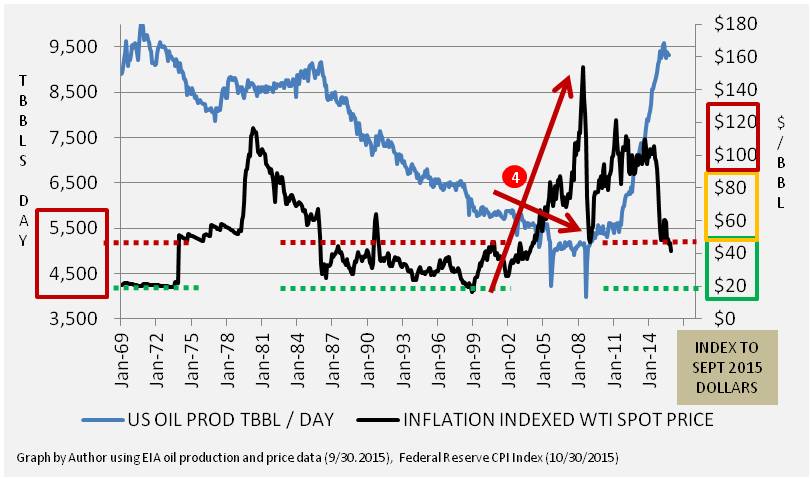
Because the U.S. was heavily dependent upon the war torn Middle East for oil in the face of very low domestic production, the market scenario was a classic set-up for the oil currency to dominate the U.S. dollar from 2004 through 2008. Much like the 1970s as the Vietnam War waged on, the U.S. dollar was vulnerable relative to oil. But unlike the 1970s, in the mid-2000s, the U.S. was also in a very weak position with respect to domestic oil production and exportable goods for trade. The U.S. current account trade deficit exploded higher. The end result was a massive build-up of U.S. dollars caught in the Middle East and China with nowhere to be invested. Mortgage backed securities became the investment du jour created by investment banks like Bear Sterns, Lehman Brothers, Goldman Sachs (NYSE:GS), Merrill Lynch (NYSE:BAC) and Morgan Stanley (NYSE:MS) to re-cycle dollars back into the United States.
The U.S. housing market became inflated by the influx of dollars and the percentage of borrowers that were overextended became painfully evident in the market. A classic run on the bank by holders of the structured investments ensued. As a result, the mortgage lending conduit dried up, as did many other financial channels. Lending facilities to finance mortgages in line to be securitized were withdrawn, leaving the entire U.S. and international banking system exposed to a meltdown.
(click to enlarge)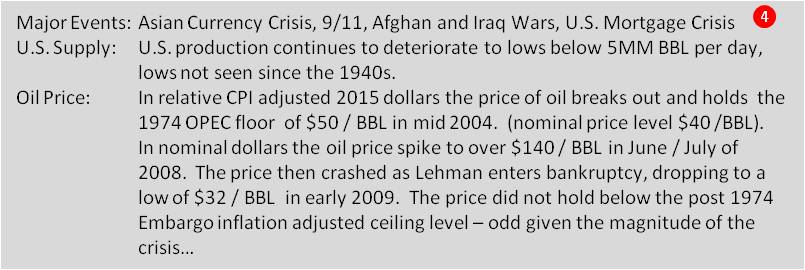
The most interesting aspect about the dramatic fashion in which financial markets in the U.S. and throughout the world collapsed as the false security of “insured” structured securities disappeared, was that oil bounced at the post Arab Oil Embargo price despite the financial chaos. And, China is credited with increasing domestic spending as the crisis ensued, helping the world economy pull out of recession.
2010-14: Shale Oil Production Boom
Leading up to the 2008 financial crisis, prompted by prices in the oil market not experienced in relative terms since the 1970s, there was a renaissance beginning to commence in the U.S. oil patch. Capital expenditures in shale oil drilling firms rose sharply in 2007 and 2008. Horizontal drilling technology was being refined for use to economically reach tight oil in the Bakken, Eagle Ford, Barnett Shale and other plays throughout the United States. With the futures market providing 2-year plus hedge protection above $70-80 per barrel, projects which previously were deemed too risky or uneconomical became attractive because the upfront drilling investment could be recovered quickly at the guaranteed higher price levels.
(click to enlarge)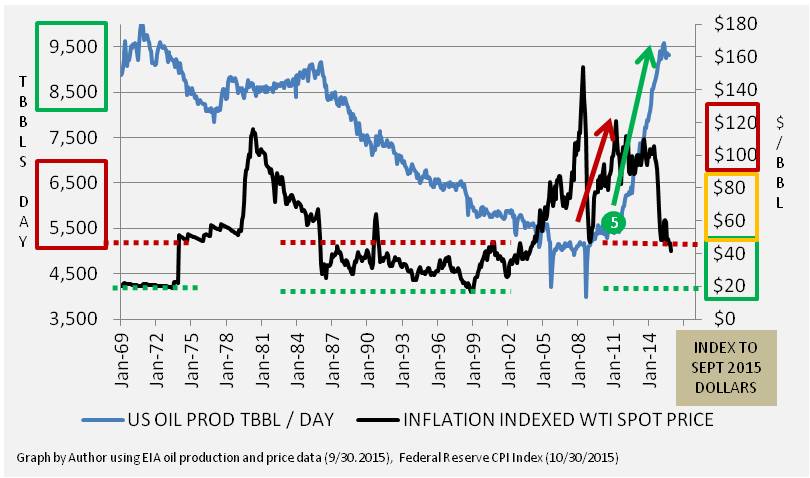
The 2008 financial market collapse provided a brief setback, but oil firms exited the crisis with strength. And the march in oil prices back above $80 per barrel by Q4 2011, U.S. drilling expanded rapidly, encouraged by buoyant futures markets as end-users tried to lock in long-term supplies before price levels went even higher. As a result, shale oil production began to boom in the United States from 2011 through 2014.
(click to enlarge)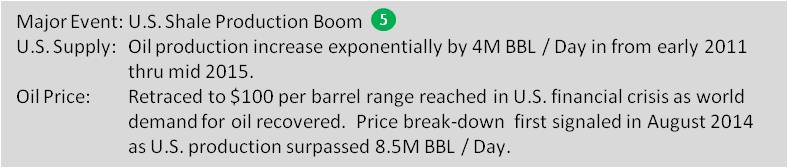
At the end of 2010, U.S. oil production was 5.6M BBL/d. By the end of 2014, production had increased to 9.4M BBL/d, a whopping 3.8M BBL/d increase. By 2015 the world was swimming in oil, and the U.S. quest for “Energy Independence” was the primary reason. Fed QE programs from 2010 through 2014, which spawned a major influx of capital chasing yield into the oil industry during the time period, seems to have broken the back of the world price spike in oil. Saudi Arabia announced a change the market share they used in 1986 in September 2014. World oil prices plummeted to below the inflation adjusted post Arab Oil Embargo level of $50 per barrel by January 2015.
Oil Price Paradigm – Where Are We Now?
As of the end of 2015, the world supply of oil is still higher than the demand by 1.5M BBLs per day, and the price of WTI crude oil for January delivery closed trading 12/18/2015 at $34.55 per barrel. The price level dropped below the historical Arab Oil Embargo floor in inflation adjusted terms in July 2015 (below $51 per barrel), and has closed below the mark at the end of each month since that time. A retracement rally in early October of 2015 failed to hold. The futures curve on 12/18 shows oil prices expected to be below $40 per barrel through June of 2016, and below the inflation adjusted post Embargo level through the end of 2018. If this market scenario holds true, the shale oil industry in the United Sates is going to be under severe financial stress for the next several years. I cover my perspective on the current market circumstances faced by shale E&P firma, and Continental Resources (NYSE:CLR) in particular, in a recent article titled “Oil Lower Longer, How Long? You Decide.”
The current oil price correction is very ominously beginning to resemble the crash in prices that took place in 1986. If oil prices remain below the $50 per barrel level after being in the range of $80 to $100 per barrel for an extended time frame, the world is definitely going to experience an oil price “shock” that it has not experienced in almost 30 years.
(click to enlarge)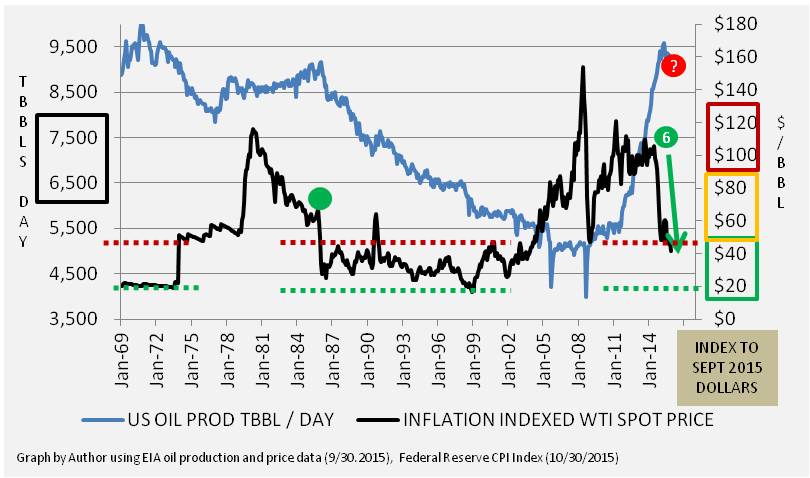
One of the primary drivers for the weakness in prices is the excess supply that U.S. shale drilling has put onto the market. The big question mark with respect to the supply is how sustainable the U.S. supply is long term. After 1986, U.S. production went on a decline path over a fifteen-year span before world demand triggered major imbalances relative to supply. The supply imbalance currently, because of increasing emerging market demand from Asian countries and the steep shale oil well depletion rates, appears to be on a shorter correction interval until imbalances are resolved. Time will tell.
(click to enlarge)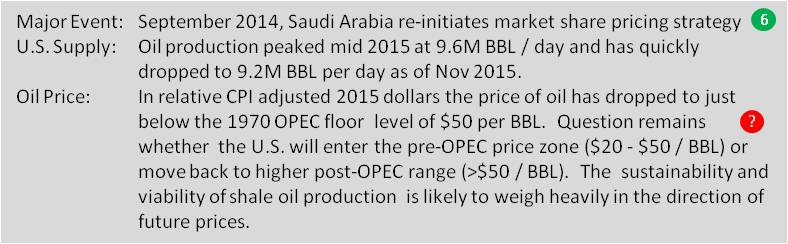
Based on the data contained in my previous article, I put forward a premise that Oil QE was in the process of trumping Fed QE. After the article was published, the Fed raised short-term interest rates for the first time since 2006, as was expected by the market. And, Saudi Arabia is reported as having maintained production again in November 2015 above 10M BBL/d, 550,000 BBL/d higher than one year ago despite world oversupply and falling world price levels.
(click to enlarge)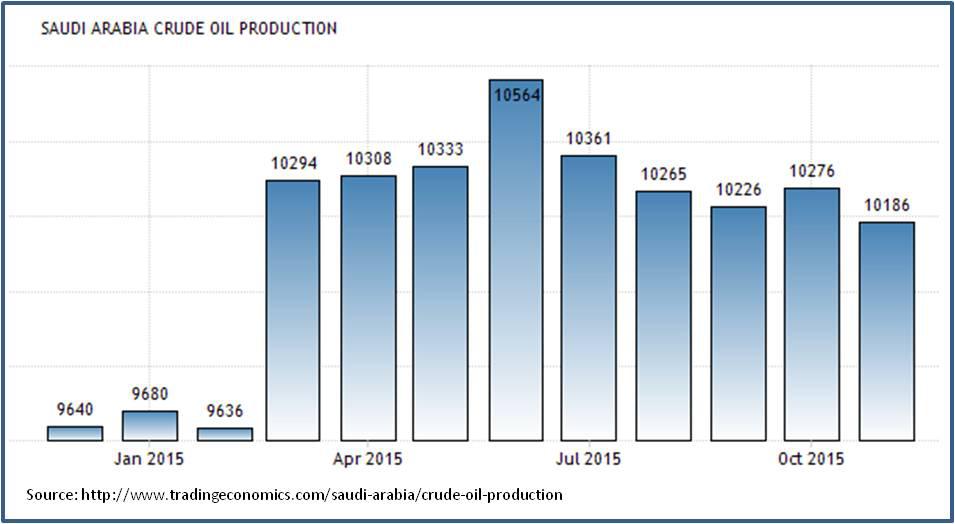
The current Saudi 10M BBL/d production level is 1.5M BBL/d higher than the level they were pumping during 2007 prior to the world financial crisis (see data here). The fascinating aspect of the Saudi actions prior to the 2008 crisis was that they cut production in 2007, tightening the market, and then raised production as the super spike in prices happened in 2008. It appears their increased supply actions likely killed the oil spike simultaneous to the Lehman Brothers bankruptcy.
In December 2015, OPEC also was unable to officially set a production quota, rather allowing its members to pump at their unofficial levels of 31.5M BBL/d. All indications are that the OPEC cartel, with Saudi Arabia as the swing supplier, is going to keep flooding the market with crude oversupply until marginal supplies in the U.S. and Russia are scaled back. Even if the supplies are cut from these countries, and the U.S. is already on track to see major reductions in 2016 of up to 1M to 1.5M BBL/d because of major capital expenditure reductions, Saudi Arabia is showing no indication that a quick return to much higher oil prices should be expected. There is ample oil headed to storage currently, and what goes into storage, must come out of storage before a strong rebound in prices can hold.
Where Do Oil Prices Go From Here?
Harold Hamm, Chairman and CEO of Continental Resources, was quoted on Dec. 21, 2015, as saying on CNBC that “2016 will be the year for correction, and we estimate the first half.” His rational in the interview primarily referred to the supply situation, which is tightening in the U.S. and other countries due to lower capital spending by E&P companies like Continental. He also stated that demand for U.S. product was still rising, up 3% on an annual basis.
However, he stopped short of saying the “2016 correction” would push prices back above the 1974 inflation adjusted Arab Oil Embargo settlement price of $50 per barrel in 2015 dollars. In the interview he said the price would return to $40-$50 per barrel in the first half of 2016. I would categorize this type of price move as a retracement, not a strong upside correction. Shale oil companies in the U.S. are encountering serious financial difficulties at the present price level of $35 per barrel, and will continue to be in “survival mode” even if prices rebound to $50. It will take some time before survival mode turns into panic mode for some of the larger firms.
History from 1986 forward says that Saudi Arabia can and will play this game of starving its competition (like the U.S., Mexico and Canada) and its enemies (like Russia and Iran) for a long time. And currently Saudi Arabia has a $700B sovereign wealth fund war chest to execute the current plan, as do Kuwait and the United Arab Emirates. The Saudis have been very candid in news reports that the price of oil will never reach $100 again. Never is a long time and you can bet the view will change if U.S. inflation ever accelerates again. But right now, inflation is not a problem.
No one truly knows how long this price war will last, but odds are high that it last for a lot longer than the first half of 2016 unless there is some major geopolitical event that disrupts international production. Playing geopolitical oil roulette with the Saudis can be painful, and U.S.-centric shale oil producers are going to feel the brunt of the pain.
My opinion is that prices will attempt the rally expected by Harold Hamm going into the first half of 2015, but the rally will cut short of holding above $50 per barrel. Be careful playing Continental Resources and other U.S. shale companies when the retracement frenzy takes place (Pioneer Natural Resources (NYSE:PXD), Hess Corporation (NYSE:HES), Antero Resources (NYSE:AR), Range Resources (NYSE:RRC), Noble Energy (NYSE:NBL), Apache Corp. (NYSE:APA), Concho Resources (NYSE:CXO), Chesapeake Energy (NYSE:CHK)). In my last article, I said I expect oil prices (NYSEARCA:USO) to average below $40 per barrel through the 2016 election.
By the way, the inflation adjusted price of oil in 2015 dollars from January 1986 through June 2004 averaged $34.20. Through that time period. it exceeded $50 on an inflation adjusted basis only during the Kuwait War.
14 Comments on "Want To Bring The Oil Market Into Focus? Adjust Prices For Inflation"
makati1 on Tue, 29th Dec 2015 7:12 pm
He said. She said. No one knows. LMAO
HARM on Tue, 29th Dec 2015 8:30 pm
“The Saudis have been very candid in news reports that the price of oil will never reach $100 again.”
Well, shucks, I guess it’s time to turn in the old Prius and get me a new Hum-Vee! With a 30′ luxury trailer in tow!
shortonoil on Wed, 30th Dec 2015 7:57 am
Another long, convoluted, Econ 101 presentation that substitutes hamburg for steak and then calculates the inflation adjusted price for oil. It must have something to do with how much methane those cows are emitting? We wonder if the authors actually went out in the fields, and made the measurements themselves?
The price of oil is range bound, it lays somewhere between its average lifting cost, and its maximum affordability level:
http://www.thehillsgroup.org/depletion2_022.htm
For 2016 that range will fall between about $25 and $66. What the average yearly price will come out to be we don’t have anymore of a clue than the methane measuring authors of the article. The only part that we can be certain of is that it will be insufficient to compensate for the $2.3 trillion per year hit in revenue that the industry is now enduring. Of course the authors could be correct? Throw enough darts, and eventually one is likely to hit a bulls eye!
http://www.thehillsgroup.org/
rockman on Wed, 30th Dec 2015 7:57 am
So much bullsh*t I don’t know where to start. lol:
“The data reveal that if you inflation adjust prices back to a time pre-Embargo, using 2015 prices, $50 per barrel is currently the point that prices are likely to stay.” The dynamics of oil production and pricing today have no relationship to past dynamics…especially those that were in place 35 years ago. At a minimum the price of oil required to develop replacement reserves today is very much higher: the US shale boom stands as sufficient proof of that fact. Add that to the fact that in the late 70’s OPEC supplied 50% of global oil production while today it’s closer to 1/3. “…$50 per barrel is currently the point that prices are likely to stay.” Again based on what? From 1959 to the embargo the adjusted price stayed at half of $50/bbl…or less. And when was this crap written: oil today is selling for 30% less than the $50/bbl where they predict prices “will stay”.
“After the spike in prices in 1979, however, world demand began to decline, particularly in the United States, as initiatives to cut energy consumption such as new car auto mileage standards began to have an effect.” Absurd. The average mpg of US autos changed imperceptibly during those years. There was a significant improvement in US mpg in the 80’s but that came long after the oil price collapse. IOW according the US govt DOT the big improvement in mpg came after the price of oil fell 70%+. In fact US mpg reached its peak the same year the inflation adjusted price of oil fell under $20/bbl. And how much did mpg increase after the oil price collapse? It didn’t. Again according to DOT stats mpg gradually decreased from the high in 1987 to 2004 when it began to increase again. Global oil consumption went down because of the severe global recession brought on by the high oil prices of the late 70’s. And what did the post ’80 oil price spike see: a
“When you look at the pre-Embargo and post-Embargo price in 2015 dollars, what you find is that $20 per barrel today was completely unacceptable to all cartel members.” What the hell does “not acceptable” mean? When the adjusted price fell from $107/bbl in 1980 to $31/bbl in 1986 was that “acceptable” to OPEC? It’s not like they had a choice to accept the lower price or not: that was what consumers were willing to pay. Just as OPEC had no choice but to accept the 1998 price of $17/bbl. OPEC might not like getting $35/bbl today and sure as hell would like getting $20/bbl even less. But are they going to a choice as to what they accept any more than they did in 1986 and 1998? In theory they could cut production to increase the price of oil but they didn’t do that in 1986 or 1998. And for a simple reason: OPEC members don’t give a crap what the price of oil is: they are concerned about their revenue stream. And increasing the price of the lower volume of oil they would sell generates LESS INCOME…not more. They knew that in 1986 and 1998. And they know it today.
paulo1 on Wed, 30th Dec 2015 8:25 am
More bombs and unrest = higher prices. Who knows where this can go?
Anyone heard from Davy regarding the floods in Missouri?
Good luck, mid-westerners.
Make sure you remind the 2016 candidates that climate change and weather swings are hoaxes.
shortonoil on Wed, 30th Dec 2015 11:16 am
“The Saudis have been very candid in news reports that the price of oil will never reach $100 again.”
Well, shucks, I guess it’s time to turn in the old Prius and get me a new Hum-Vee! With a 30′ luxury trailer in tow!
If the Saudis, or the Russians have seen this graph:
http://www.thehillsgroup.org/depletion2_022.htm
Or more likely have constructed their own (which isn’t very difficult to do once one pulls their head out of a barrel) they would be selling every barrel they could produce, while it is still possible to produce it.
It sure seems like that is exactly what they are doing!!
http://www.thehillsgroup.org/
ghung on Wed, 30th Dec 2015 11:27 am
Meanwhile,the Energy Information Administration confirmed an increase in U.S. crude stockpiles by 2.6 million barrels last week. Seems Americans aren’t doing their part. Get out and drive dammit! How can we keep importing Saudi oil if we don’t burn it?
JN2 on Wed, 30th Dec 2015 11:45 am
Ghung, yes:
>> At 484.8 million barrels, U.S. crude oil inventories remain near
levels not seen for this time of year in at least the last 80 years. <<
Maybe Plant is right? There is a glut?
ghung on Wed, 30th Dec 2015 12:11 pm
I never got into the semantics argument regarding ‘glut/no glut’. Seemed pointless. Fact is, we’re sitting on a shitload of oil, and, best I can determine, near to maxxing out crude storage capacity (hard to determine what that actually is, excepting SPR). Then again, I figure that’s still roughly only 25 days supply, give or take. Depends on how one looks at it.
Apneaman on Wed, 30th Dec 2015 12:27 pm
paulo1, those Missouri floods could have serious downstream consequences.
The Floods of Five Rivers Heading for the U.S. Industrial South
“Brace yourself, U.S. South. The Mississippi River is coming, and so are the Arkansas, the Red, the Ohio and the Missouri.
The water on the Mississippi River is already so high that Missouri closed interstate highways. Governor Jay Nixon activated the National Guard to stave off disaster. And Kinder Morgan Inc. shut two terminals near St. Louis, declaring a force majeure that protects it from liability for contracts that go unfulfilled for reasons beyond its control.”
http://www.bloomberg.com/news/articles/2015-12-30/the-floods-of-five-rivers-heading-for-the-u-s-industrial-south
antaris on Wed, 30th Dec 2015 12:42 pm
“levels not seen for this time of year in at least the last 80 years.”
Can’t they just say “the highest ever” rather than have people think levels were higher 80 years ago!
rockman on Wed, 30th Dec 2015 1:09 pm
ghung – The aspect to remember that is that much of the oil going into storage isn’t oil that producers weren’t able to sell or didn’t want to sell due to low prices. IOW we’re selling our oil: whether it’s being bought by a refiner or a speculator sending it to storage it’s the same to us: oil that has been BOUGHT. Also some folks still don’t understand the difference between the working volumes of oil that makes up part of the oil storage numbers. Every week there are 100+ million bbls going into storage AND 100+ million bbls leaving storage. Depending on which ‘storage’ numbers you’re looking at it might even include oil in pipelines as well as the standing inventories at the refineries waiting to be cracked the next day.
So any time someone claims that we are nearly full on crude oil storage, you ask them to quantify that. “Highest levels in 80 years” isn’t quantified. You could be at the highest levels in 80 years and still have a lot of capacity left. But again much of the gain in storage is oil that has been PURCHASED by folks who are paying storage fees on hopes that somewhere down the line they sell to refiners at a net profit. With that in mid if oil does drop down to $20/bbl I would expect a huge surge in storage: much higher profit potential when it comes time to flip it. IOW it’s your chicken/egg dynamic: does increasing storage lead to lower oil prices (and how would that happen if there are suddenly more BUYERS for the Rockman’s oil) or do lower oil prices drive up the push to send more oil to storage: I BUY at $X/bbl to day and then sell at $1.5X later this year.
Consider this: as you point out there was a gain of 2.6 million bbls last week. That same week US refiners cracked 115 million bbls of oil. IOW that inventory gain represents 2.3% of the oil refined that week. Thus 2.6 million bbls of oil doesn’t seem like a lot when put into context, does it? lol.
I think a more illustrative metric is the “U.S. Ending Stocks of Crude Oil and Petroleum Products” as compiles by the EIA. This is the whole enchilada of liquid hydrocarbons in the USA. Their latest number (for 9/2015) was 2.001 BILLION BBLS. And 12 months ago it was 1.840 BILLION BBLS. IOW as of Sept we had 8.8% more inventory of oil and products. And 9.2% more than 2 years ago. And about the same 3 years ago…9.2%.
There has been a continuous gradual rise in oil and product stocks since 2000. A few minor dips but an increasing trend for the last 15 years. IOW the current build up in stocks isn’t something new…it’s been going on for a long time. Here’s an easy visual for folks who have trouble with %’s. lol.
http://www.eia.gov/dnav/pet/hist/LeafHandler.ashx?n=pet&s=mttstus1&f=a
ghung on Wed, 30th Dec 2015 1:28 pm
Thanks, Rock. Another question is; where does that stuff go after it’s been cracked? A lot of it gets sold/burned, but I’m sure there’s a glut of distillates and other stuff that there isn’t a sufficient market for. Where do they store that, and at what cost?
Apneaman on Wed, 30th Dec 2015 6:36 pm
“Miracle of American Oil”: Continental Resources Courted Corporate Media to Sell Oil Exports
“A document published by the Public Relations Society of America, discovered by DeSmog, reveals that from the onset of its public relations campaign, the oil industry courted mainstream media reporters to help it sell the idea of lifting the ban on crude oil exports to the American public and policymakers.
Calling its campaign the “Miracle of American Oil,” the successful PR effort to push for Congress and the White House to lift the oil exports ban was spearheaded by Continental Resources, a company known as the “King of the Bakken” shale oil basin and founded by Harold Hamm. Hamm served as energy advisor to 2012 Republican Party presidential candidate Mitt Romney.”
http://www.desmogblog.com/2015/12/28/miracle-american-oil-continental-resources-corporate-media-oil-exports