Donate Bitcoin

Donate Paypal


PeakOil is You

PeakOil is You

Production Forecast with a Population Constraint

Discuss research and forecasts regarding hydrocarbon depletion.

Production Forecast with a Population Constraint

Unread postby khebab » Thu 23 Jun 2005, 14:43:23

This little exercise is based on the following observation: the oil production per capita per year has been nearly constant since 1983 at about 4.43 barrels/capita/year (see Figure 2).

Question:
What will be the production pattern if we manage to keep up with the polulation growth as long as we can (magenta points on the graph)?
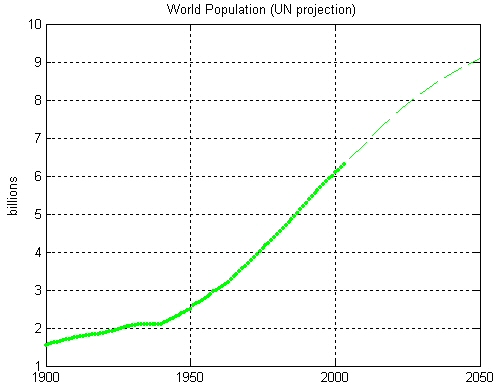
Image
Figure 1

Image
Figure 2

We assume the following:
1- population grow according to UN prediction (Figure 1)
2- we extract enough oil to maintain a constant number of barrel/capita/year to 4.43 up to 2020 (cumulative production= 1564 Gb)
3- a Verhulst curve model with two values for Q-inf: 2461.82 (BP) and 4173 Gb (USGS)

Results:

The fit is performed by non linear fitting:

Code: Select all
qinf= 2461.82 Gb: PO date= 2014.81+/-  0.89 PO value=  31.28+/-   0.52 Gb/year
k=   0.04+/- 0.002 n=   0.25+/-  0.14 t_half= 2007.64+/-  0.67

qinf= 4173 Gb: PO date= 2025.74+/-  1.24 PO value=  33.99+/-   0.54 Gb/year
k=   0.04+/- 0.002 n=   1.78+/-  0.23 t_half= 2033.49+/-  0.80

If Q-inf= 2461.82 Gb, the model cannot keep up and the mid-point is reach toward 2007 and the maximum production date is end of 2014 at 31.28 Gb/year. If we manage to grow our reserve as USGS is predicting the mid-point is 2033 and the PO date is 2025 at 34 Gb (see Figure 3).

Figure 4 shows the projected barrel per capita per year according to the two models. We should go back to the 1965 level in 2020 (Q-inf= 2461 Gb) or 2030 (Q-inf= 4173 Gb).

Image
Figure 3

Image
Figure 4

Data source: BP review 2004, World Population Prospects The 2004 Revision Population Database
______________________________________
http://GraphOilogy.blogspot.com
khebab
Tar Sands
Tar Sands
 
Posts: 899
Joined: Mon 27 Sep 2004, 03:00:00
Location: Canada

Unread postby turmoil » Thu 23 Jun 2005, 15:53:36

as someone who enjoys math, and looking at graphs :), i really appreciate you posting this.

plus it helps to educate family!
User avatar
turmoil
Heavy Crude
Heavy Crude
 
Posts: 1088
Joined: Fri 13 Aug 2004, 03:00:00
Location: Richmond, VA, Pale Blue Dot

Unread postby khebab » Thu 23 Jun 2005, 16:00:14

Thank you! :)
______________________________________
http://GraphOilogy.blogspot.com
khebab
Tar Sands
Tar Sands
 
Posts: 899
Joined: Mon 27 Sep 2004, 03:00:00
Location: Canada

Unread postby khebab » Thu 23 Jun 2005, 17:19:09

I just want to precise that the UN projection used here is the "medium variant", there is also a high and low variant.
______________________________________
http://GraphOilogy.blogspot.com
khebab
Tar Sands
Tar Sands
 
Posts: 899
Joined: Mon 27 Sep 2004, 03:00:00
Location: Canada

Unread postby LadyRuby » Thu 23 Jun 2005, 21:46:56

I second that, nice charts!
User avatar
LadyRuby
Heavy Crude
Heavy Crude
 
Posts: 1177
Joined: Mon 13 Jun 2005, 03:00:00
Location: Western US

Unread postby pup55 » Fri 24 Jun 2005, 09:57:07

This population-driven consumption curve is really interesting because of the issue of distribution, as it were.

We know that at the moment the US is consuming at a rate of about 24 b/y per capita, so this is 6 times higher than the global average, so this is not going to fly.

You have China consuming at a rate of about 1 b/y per capita, and they have made the political decision to increase this level by having all of their people go out and buy cars. We know that this is not going to fly either.

You have nations like India and Bangladesh, consuming at a rate of less than .5 b/y per capita. Bangladesh is really vulnerable in this, as is Indonesia: lots of people, low consumption, but minimal ability to defend their oil supply. India not in very good shape either, due to its high population. They do have one thing Bangladesh does not have, though (WMD).

You have a nation like Mexico, consuming 8 or so b/y per capita, but with so much poverty that a lot of them are leaving. What happens to them?

All of the above are going to have to deal with reality, as the old saying goes.
User avatar
pup55
Light Sweet Crude
Light Sweet Crude
 
Posts: 5249
Joined: Wed 26 May 2004, 03:00:00


Return to Peak oil studies, reports & models

Who is online

Users browsing this forum: No registered users and 11 guests