Donate Bitcoin

Donate Paypal


PeakOil is You

PeakOil is You

Cushing, OK Peak

Discuss research and forecasts regarding hydrocarbon depletion.

Cushing, OK Peak

Unread postby PeakOiler » Thu 01 May 2014, 19:46:45

Image

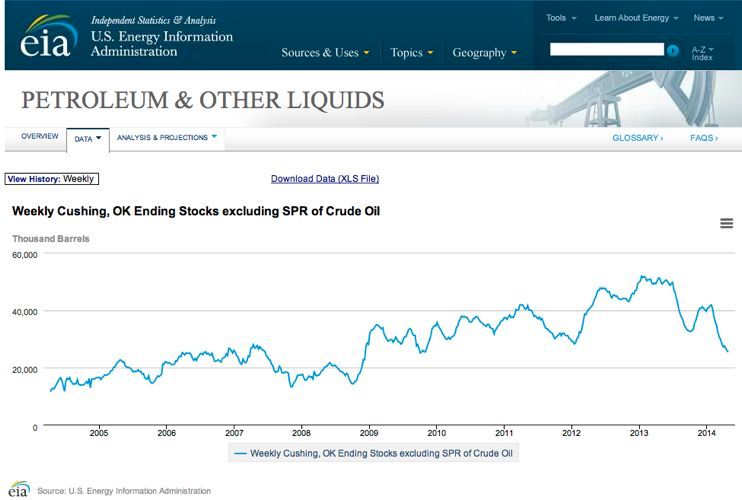
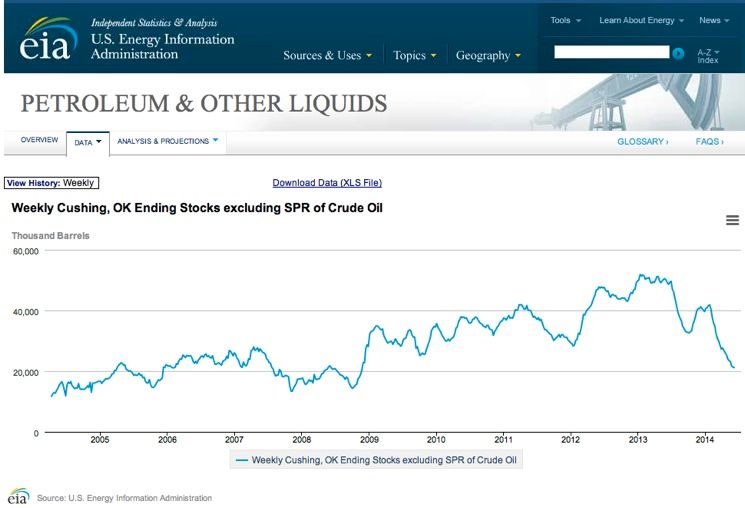
Source: EIA Cushing, OK Ending Stocks

It's been almost five years since the inventory at Cushing has been this low. Looks like Cushing peaked in Jan, 2013.

The Seaway pipeline is doing it's job...
There’s a strange irony related to this subject [oil and gas extraction] that the better you do the job at exploiting this oil and gas, the sooner it is gone.

--Colin Campbell
User avatar
PeakOiler
Intermediate Crude
Intermediate Crude
 
Posts: 3664
Joined: Thu 18 Nov 2004, 04:00:00
Location: Central Texas

Re: Cushing, OK Peak

Unread postby ROCKMAN » Thu 01 May 2014, 21:25:31

Yep. The current inventory could be emptied in less than two months. And within a month or two the parallel lines to the reversed Seaway pipeline will increase the flow from Cushing to Texas by more than 400,000 bopd. But the capacity will be needed when the other pipelines (and not the Northern leg of Keystone) underway to move production from Alberta to Cushing are completed.
User avatar
ROCKMAN
Expert
Expert
 
Posts: 11397
Joined: Tue 27 May 2008, 03:00:00
Location: TEXAS

Re: Cushing, OK Peak

Unread postby Pops » Fri 02 May 2014, 08:21:42

(ETA) But storage on the gulf is maxed,
according to Tom Whipple the US has the highest total inventory since 1931.

Woo-hoo

Image


Where art thou, oh glut pricing?

(hint, there is no "glut" - the market is supply constrained, still short maybe 5-10Mbopd of cheap oil)
The legitimate object of government, is to do for a community of people, whatever they need to have done, but can not do, at all, or can not, so well do, for themselves -- in their separate, and individual capacities.
-- Abraham Lincoln, Fragment on Government (July 1, 1854)
User avatar
Pops
Elite
Elite
 
Posts: 19746
Joined: Sat 03 Apr 2004, 04:00:00
Location: QuikSac for a 6-Pac

Re: Cushing, OK Peak

Unread postby Tanada » Fri 02 May 2014, 08:37:49

ROCKMAN wrote:Yep. The current inventory could be emptied in less than two months. And within a month or two the parallel lines to the reversed Seaway pipeline will increase the flow from Cushing to Texas by more than 400,000 bopd. But the capacity will be needed when the other pipelines (and not the Northern leg of Keystone) underway to move production from Alberta to Cushing are completed.


This raises in my mind at least the question, how low will inventories get and will it effect prices elsewhere in the USA? If it does effect prices how soon and how quickly? WTI is still at a substantial discount to Brent, and the discount has lasted even though inventories have fallen steeply in the mean time.
Alfred Tennyson wrote:We are not now that strength which in old days
Moved earth and heaven, that which we are, we are;
One equal temper of heroic hearts,
Made weak by time and fate, but strong in will
To strive, to seek, to find, and not to yield.
User avatar
Tanada
Site Admin
Site Admin
 
Posts: 17057
Joined: Thu 28 Apr 2005, 03:00:00
Location: South West shore Lake Erie, OH, USA

Re: Cushing, OK Peak

Unread postby Pops » Fri 02 May 2014, 09:18:00

Tanada wrote:how low will inventories get and will it effect prices elsewhere in the USA?

That was my point, inventories aren't low - except in OK - they are full up along the gulf where the refineries are.

I think we need to realise that Cushing and so WTI ain't what it used to be due to the pipeline reversals and increasing rail shipments.

Image
The legitimate object of government, is to do for a community of people, whatever they need to have done, but can not do, at all, or can not, so well do, for themselves -- in their separate, and individual capacities.
-- Abraham Lincoln, Fragment on Government (July 1, 1854)
User avatar
Pops
Elite
Elite
 
Posts: 19746
Joined: Sat 03 Apr 2004, 04:00:00
Location: QuikSac for a 6-Pac

Re: Cushing, OK Peak

Unread postby basil_hayden » Fri 02 May 2014, 09:42:16

Buh bye, Brent-WTI Spread.
User avatar
basil_hayden
Heavy Crude
Heavy Crude
 
Posts: 1581
Joined: Mon 08 Aug 2005, 03:00:00
Location: CT, USA

Re: Cushing, OK Peak

Unread postby ROCKMAN » Fri 02 May 2014, 09:42:36

T/Pops - Something to bear in mind about US inventories today vs. years past: we're holding not just for US demand but also global demand for refined products. I estimate about 30% - 40% of our oil imports are now being shipped back overseas as products. So it would follow that some amount of that storage is being held for those foreign buyers. And now that matters have gotten more tense with those choppers being shot down in the Ukraine they may beef up inventory even more. If it goes very badly and Russia reduces exports the value of that inventory could increase by $billions overnight.

Folks waiting for a price break may have to hold their breaths for a while.
User avatar
ROCKMAN
Expert
Expert
 
Posts: 11397
Joined: Tue 27 May 2008, 03:00:00
Location: TEXAS

Re: Cushing, OK Peak

Unread postby Pops » Fri 02 May 2014, 09:56:18

WTI is not only increasingly irrelevant but it is increasingly misleading

Based on what refiners are actually paying (vs the reported "spot price") it turns out there is an $8.33 Premium for domestic (US) oil and has been for over a year!
The spread we all read about is exactly backwards!

EIA refiner acquisition cost
Image
The legitimate object of government, is to do for a community of people, whatever they need to have done, but can not do, at all, or can not, so well do, for themselves -- in their separate, and individual capacities.
-- Abraham Lincoln, Fragment on Government (July 1, 1854)
User avatar
Pops
Elite
Elite
 
Posts: 19746
Joined: Sat 03 Apr 2004, 04:00:00
Location: QuikSac for a 6-Pac

Re: Cushing, OK Peak

Unread postby westexas » Fri 02 May 2014, 10:01:00

I suspect that rising inventories of Crude + Condensate (C+C) mostly reflect rising inventories of condensate.

Note that Texas RRC data show that the Texas Condensate/(C+C) Ratio increased from 11% in 2005 to 15% in 2012.
westexas
Expert
Expert
 
Posts: 248
Joined: Tue 04 Jun 2013, 06:59:53

Re: Cushing, OK Peak

Unread postby Pops » Fri 02 May 2014, 10:48:57

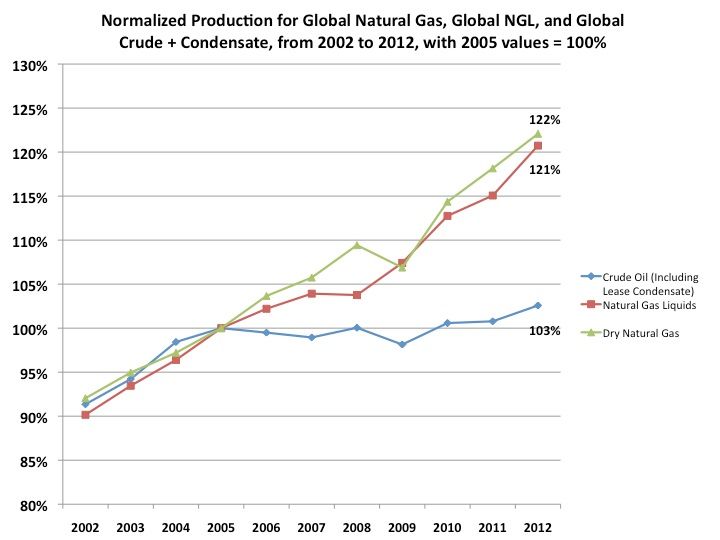
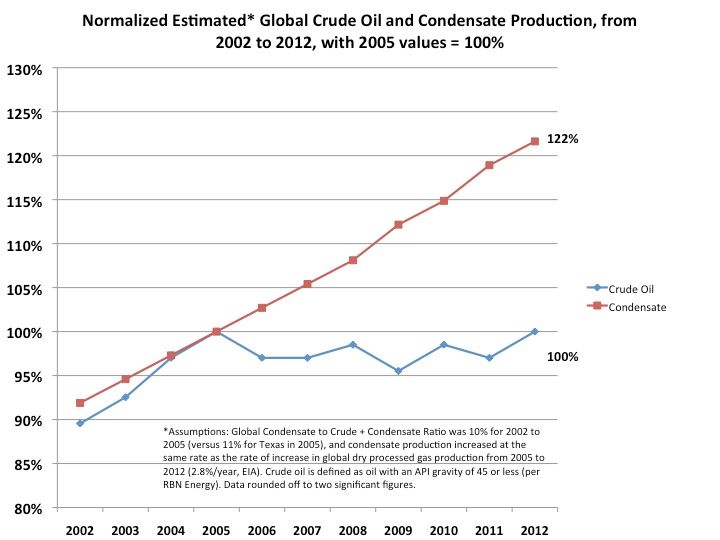
westexas wrote:I suspect that rising inventories of Crude + Condensate (C+C) mostly reflect rising inventories of condensate.

Can you explain the relevance of increasing condensate production and maybe point to the products that might be evidence if that's the case?

http://www.eia.gov/dnav/pet/pet_stoc_ty ... mbbl_m.htm
The legitimate object of government, is to do for a community of people, whatever they need to have done, but can not do, at all, or can not, so well do, for themselves -- in their separate, and individual capacities.
-- Abraham Lincoln, Fragment on Government (July 1, 1854)
User avatar
Pops
Elite
Elite
 
Posts: 19746
Joined: Sat 03 Apr 2004, 04:00:00
Location: QuikSac for a 6-Pac

Re: Cushing, OK Peak

Unread postby westexas » Fri 02 May 2014, 11:50:25

As I'm sure you know, what the EIA calls crude oil is actually crude oil (generally defined as 45 or lower API gravity oil) + condensate (a byproduct of natural gas production), AKA as C+C. The EIA does not appear to have recent data for US condensate production, but as noted the Texas RRC shows a very large increase in the ratio of Texas Condensate to C+C production, i.e., Texas condensate production accounted for an increasing percentage of Texas C+C production from 2005 to 2012 (11% to 15%). Condensate is basically natural gasoline, but it's not of much use for refining distillate products.

Note that US net crude oil imports remain quite high, given very high US C+C inventories, which, as noted above, suggests to me that most of the increase in US C+C inventories may be condensate.

Re: Global Data:

When one asks what the price of oil is, one gets the price of 45 or lower API gravity crude oil. When one asks for the volume of global oil production, one gets some combination of Crude Oil + Condensate + Natural Gas Liquids (NGL) + Biofuels + Refinery Gains. It’s analogous to asking a butcher the price of beef, and he gives you the price of steak, but if you ask him how many pounds of beef he has on hand, he gives you the total pounds of steak + roast + beef.

Shouldn’t the price be keyed to the actual volume of the product being priced?

Global Crude + Condensate (C+C) production increased at about the same rate as global dry processed gas production from 2002 to 2005, but then we saw a significant divergence between the rates of increase in global gas production and in global C+C production from 2005 to 2012, 2.8%/year versus 0.4%/year respectively. Crude oil is generally defined as 45 or lower API gravity oil.

According to the EIA, global gas production increased by 22% from 2005 to 2012, and I think it’s a reasonable assumption that condensate–a byproduct of natural gas production–increased by about the same amount, especially given the large increase in condensate production in the US.

The problem is that other than OPEC and Texas, no one appears to track crude versus condensate, but the Texas RRC shows that the Texas condensate to C+C ratio increased from 11% in 2005 to 15% in 2012. Note that OPEC, which accounted for 43% of global C+C production in 2012 showed no material increase in crude oil production from 2005 to 2012 (31 mbpd in both years).

If we cross correlate the OPEC (Crude only) and EIA (C+C) data bases for the OPEC 12 countries for 2005 to 2012, their Condensate/(C+C) Ratio doubled–from 3% in 2005 to 6% in 2012. OPEC accounted for 43% of global C+C production in 2012, which is a pretty good (and conservative) sampling of global crude and condensate production, especially when one considers the fact that the large increase in US condensate production would be in the remaining 57% of global C+C production.

In any case, the data bases that we have that track condensate versus crude, Texas RRC and OPEC/EIA, both show large increases in their Condensate/C+C Ratios from 2005 to 2012, 11% to 15% and 3% to 6% respectively.

If we extrapolated the OPEC crude versus C+C data, and assumed that OPEC was a representative sampling of global data, it would imply that global condensate production increased by about 2.1 mbpd from 2005 to 2012, which would account for all of the EIA’s reported 2 mbpd increase in global C+C production from 2005 to 2012.

My approach has been to assume that the global Condensate/(C+C) Ratio was about 10% in 2005 (partly based on an RBN Energy estimate that put the ratio at about 11% in 2010), and I assumed that global condensate production (a byproduct of natural gas production) increased at about the same rate as the rate of increase in global gas production, from 2005 to 2012. Based on these assumptions, global condensate production would have increased from about 7.4 mbpd in 2005 to about 9.0 mbpd in 2012, an increase of 1.6 mbpd, accounting for virtually all of the EIA’s reported increase in global C+C production from 2005 to 2012.

Based on the foregoing, the global Condensate/(C+C) Ratio would have increased from about 10% in 2005 to 12% in 2012, versus 11% to 15% for Texas and versus 3% to 6% for OPEC. I estimate that actual global crude oil production averaged about 65 mbpd for 2006 to 2013 inclusive, versus 67 mbpd in 2005.

In other words, in my opinion global crude oil production probably peaked in 2005, but natural gas and associated liquids (Condensate & NGL) have (so far) continued to increase.

Following are estimated* values for global crude oil production (excluding lease condensate), 2002 to 2012, mbpd:

2002: 60

2003: 62

2004: 65

2005: 67

2006: 65

2007: 65

2008: 66

2009: 64

2010: 66

2011: 65

2012: 67

*Assumptions: Global Condensate to Crude + Condensate Ratio was about 10% for 2002 to 2005 (versus 11% for Texas in 2005), and condensate production increased at the same rate as the rate of increase in global dry processed gas production from 2005 to 2012 (2.8%/year, EIA). Crude oil is defined as oil with an API gravity of 45 or less (per RBN Energy). Data rounded off to two significant figures.

Kurt Cobb has written a good article on crude oil versus other liquids:

http://www.resilience.org/stories/2014- ... ak-in-2005
Last edited by westexas on Fri 02 May 2014, 11:57:50, edited 1 time in total.
westexas
Expert
Expert
 
Posts: 248
Joined: Tue 04 Jun 2013, 06:59:53

Re: Cushing, OK Peak

Unread postby westexas » Fri 02 May 2014, 11:52:42

Two Graphs:

First graph is normalized global gas production, global NGL production and global C+C production from 2002 to 2012 (2005 value = 100%).

Image

Second graph shows normalized estimated values for condensate and crude separately from 2002 to 2012 (2005 value =100%).

Image
westexas
Expert
Expert
 
Posts: 248
Joined: Tue 04 Jun 2013, 06:59:53

Re: Cushing, OK Peak

Unread postby Pops » Sat 03 May 2014, 08:36:53

Thanks WT.

EIA says:

Crude Oil:
A mixture of hydrocarbons that exists in the liquid phase in natural underground reservoirs and remains liquid at atmospheric pressure after passing through surface separating facilities. Crude oil may also include:

Small amounts of hydrocarbons that exist in the gaseous phase in natural underground reservoirs but are liquid at atmospheric pressure after being recovered from oil well (casinghead) gas in lease separators, and that subsequently are comingled with the crude stream without being separately measured. [lease condensate]

Lease Condensate:
A mixture consisting primarily of pentanes and heavier hydrocarbons which is recovered as a liquid from natural gas in lease separation facilities. This category excludes natural gas plant liquids, such as butane and propane, which are recovered at downstream natural gas processing plants or facilities.


Here is annual US lease condensate production thru 2012, right at 100MMbbls increase over '05 - mostly from TX onshore and state offshore but not consistent at all:

Image


So anyway, does all that jibe with what you're saying, wt?
.
The legitimate object of government, is to do for a community of people, whatever they need to have done, but can not do, at all, or can not, so well do, for themselves -- in their separate, and individual capacities.
-- Abraham Lincoln, Fragment on Government (July 1, 1854)
User avatar
Pops
Elite
Elite
 
Posts: 19746
Joined: Sat 03 Apr 2004, 04:00:00
Location: QuikSac for a 6-Pac

Re: Cushing, OK Peak

Unread postby westexas » Sat 03 May 2014, 10:17:58

Pops,

I think that the EIA is undercounting actual condensate production and/or they are having problems trying to accurately count it (plus budget cutback effects). In round numbers the Texas RRC shows that just Texas condensate production increased from around 120,000 bpd in 2005 to around 300,000 bpd in 2012. Note that the EIA stopped updating their condensate data base.

Also, note that the EIA shows that Texas marketed gas production increased at 5%/year from 2005 to 2012, but the Texas RRC shows that the rate of increase in Texas condensate production (13%/year) far outpaced the rate of increase in Texas gas production.

In any case, the key global chart is the first one above, showing normalized values for global gas, global NGL and global C+C. Since condensate is a byproduct of natural gas production, it only makes sense that condensate almost certainly showed (at least) the same kind of increase that we saw with natural gas and NGL. Therefore, what virtually stopped increasing or fell was actual Black Gold, i.e., 45 or lower API gravity crude oil.
westexas
Expert
Expert
 
Posts: 248
Joined: Tue 04 Jun 2013, 06:59:53

Re: Cushing, OK Peak

Unread postby PeakOiler » Thu 12 Jun 2014, 19:57:16

Whatever they're counting, it's still getting a lot lower:

Image

The ending stocks as of 6-June was 21,172 thousand barrels of whatever, the lowest it has been since about November, 2008.
There’s a strange irony related to this subject [oil and gas extraction] that the better you do the job at exploiting this oil and gas, the sooner it is gone.

--Colin Campbell
User avatar
PeakOiler
Intermediate Crude
Intermediate Crude
 
Posts: 3664
Joined: Thu 18 Nov 2004, 04:00:00
Location: Central Texas

Re: Cushing, OK Peak

Unread postby vtsnowedin » Thu 12 Jun 2014, 20:34:00

I'm not a chart guru so I have some questions. As Cushing is a storage and transport hub and not a production point should they not plot the amount that passes through each day not the ending stocks? I can see having X amount in the tanks in the morning and having any number of Q,Y or Z barrels move through in a period and still have X in the tanks at the end of the period. And does all the oil in the central USA pass through Cushing and get counted or do some trains and pipelines go right on by from well to refinery without ever getting tallied at Cushing? So the question is what value do the ending stock volumes give beyond the level of reserves close at hand?
User avatar
vtsnowedin
Fusion
Fusion
 
Posts: 14897
Joined: Fri 11 Jul 2008, 03:00:00

Re: Cushing, OK Peak

Unread postby PeakOiler » Thu 12 Jun 2014, 20:46:20

You bring up some interesting points which I can't answer to, vtsnowedin. I don't know of any source that could tell us.
There’s a strange irony related to this subject [oil and gas extraction] that the better you do the job at exploiting this oil and gas, the sooner it is gone.

--Colin Campbell
User avatar
PeakOiler
Intermediate Crude
Intermediate Crude
 
Posts: 3664
Joined: Thu 18 Nov 2004, 04:00:00
Location: Central Texas

Re: Cushing, OK Peak

Unread postby ROCKMAN » Fri 13 Jun 2014, 12:04:07

PO - Been looking but haven't found anything. But perhaps for good reason: there is no typical throughput number per se. It's not like one pipeline going in and one coming out:

"Cushing is the largest crude storage hub in the US (excluding the strategic petroleum reserve) with a nameplate capacity of about 76 MMBbl owned by 14 different private companies. Cushing is also the most active oil trading hub and the delivery point for the CME NYMEX West Texas Intermediate (WTI) Futures contract. There are significant flows of crude into Cushing along pipeline routes from Canada, Chicago, the Rockies, the Anadarko basin and the Permian Basin and significant outbound flows on pipelines to refineries in Ohio, Oklahoma, Kansas and Texas as well as major trunk lines to the Gulf Coast."

Additionally there has been an increasing volume of oil coming into the area but completely bypassing the storage facility. And while the storage is owned by 14 different companies there are also multiple different owners of pipelines delivering oil into the Cushing storage and others transporting it out. A pipeline might be delivering 500,000 bopd into Cushing but that company might not have any idea of how much goes to storage and how much passes thru. Likewise a pipeline taking 300,000 bopd from Cushing wouldn't necessarily know if it's been sitting in storage there for 1 day or 1 month.
User avatar
ROCKMAN
Expert
Expert
 
Posts: 11397
Joined: Tue 27 May 2008, 03:00:00
Location: TEXAS

Re: Cushing, OK Peak

Unread postby phaster » Sun 15 Jun 2014, 15:32:23

ROCKMAN wrote:Yep. The current inventory could be emptied in less than two months. And within a month or two the parallel lines to the reversed Seaway pipeline will increase the flow from Cushing to Texas by more than 400,000 bopd. But the capacity will be needed when the other pipelines (and not the Northern leg of Keystone) underway to move production from Alberta to Cushing are completed.


have any personal ball park estimate how long production/storage "infrastructure" will keep ahead of demand?

I know there is base demand due to electrical power plant(s), but the big variable is winter weather, hopefully this winter California will have an el nino (so that water supplies buildup against the drought), and the east coast/mid west won't be as "cold"

http://www.financialsense.com/contribut ... ng-garriss
truth is,...

www.ThereIsNoPlanet-B.org
User avatar
phaster
Tar Sands
Tar Sands
 
Posts: 511
Joined: Sun 15 Jul 2007, 03:00:00

Re: Cushing, OK Peak

Unread postby ROCKMAN » Sun 15 Jun 2014, 16:12:33

Pstarr - "...have any personal ball park estimate..." No. And the more I dig into that dynamic the more I suspect the different players like keeping it somewhat opaque. Not my area but given the huge volumes involved a lot of money can be made/lost with just a price swing of pennies per gallon. I envision the process is a lot like poker: even if you have a winning hand you might give up the pot if the other guy makes you blink first. Remember as I pointed out it isn't one company storing oil at Cushing but 14. And multiple pipelines in/out as well as multiple oil sellers on one end and refiners on the other end. And there's probably a number of brokers holding positions all the way from the well head to the refinery gate.

A different commodity (NG) but I once knew a guy that did a trade with a not very skilled seller. Bought that guy's NG on a long term contract for a good bit less than he should have paid. And then sold the contract to an end user for $0.25/mcf more then he paid. Never once took delivery of the NG for one second and never put $1 up. And for YEARS he got a MONTHLY check for $25,000 to $50,000. It's all about how well you horse trade. And that often depends on the other guy not having access to all the data.
User avatar
ROCKMAN
Expert
Expert
 
Posts: 11397
Joined: Tue 27 May 2008, 03:00:00
Location: TEXAS


Return to Peak oil studies, reports & models

Who is online

Users browsing this forum: No registered users and 6 guests