First, all countries sorted by increase '05-'13

Countries with increase over 100m bopd '05-'13. Note that some countries shown now have YoY declines (perhaps economic in response to US tight)

US tight oil Estimate vs Rest o the World


PeakOil is You
![]() by Pops » Mon 26 Aug 2013, 12:18:30
by Pops » Mon 26 Aug 2013, 12:18:30


![]() by rollin » Mon 26 Aug 2013, 14:10:49
by rollin » Mon 26 Aug 2013, 14:10:49

![]() by Pops » Mon 26 Aug 2013, 14:57:15
by Pops » Mon 26 Aug 2013, 14:57:15
![]() by Pops » Mon 26 Aug 2013, 14:58:39
by Pops » Mon 26 Aug 2013, 14:58:39
![]() by Pops » Mon 26 Aug 2013, 16:37:15
by Pops » Mon 26 Aug 2013, 16:37:15


![]() by dcoyne78 » Mon 26 Aug 2013, 18:26:09
by dcoyne78 » Mon 26 Aug 2013, 18:26:09
![]() by Pops » Mon 26 Aug 2013, 18:42:21
by Pops » Mon 26 Aug 2013, 18:42:21
![]() by ROCKMAN » Mon 26 Aug 2013, 21:29:27
by ROCKMAN » Mon 26 Aug 2013, 21:29:27
![]() by Plantagenet » Tue 27 Aug 2013, 02:25:56
by Plantagenet » Tue 27 Aug 2013, 02:25:56
ROCKMAN wrote:High oil prices don't alone explain the US boost. Expectations of a similar global response may not be met.
![]() by Pops » Tue 27 Aug 2013, 08:51:26
by Pops » Tue 27 Aug 2013, 08:51:26


![]() by ROCKMAN » Tue 27 Aug 2013, 09:52:22
by ROCKMAN » Tue 27 Aug 2013, 09:52:22
![]() by dolanbaker » Tue 27 Aug 2013, 16:07:10
by dolanbaker » Tue 27 Aug 2013, 16:07:10

![]() by ROCKMAN » Tue 27 Aug 2013, 19:29:56
by ROCKMAN » Tue 27 Aug 2013, 19:29:56
![]() by Keith_McClary » Wed 28 Aug 2013, 00:20:43
by Keith_McClary » Wed 28 Aug 2013, 00:20:43
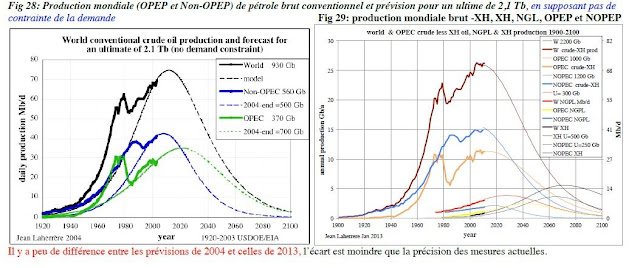
"one or 2 digits of accuracy" on URR only moves the peak by a few minutes months. An important Peak Oil Fact which you refuse to include in the top 10Pops wrote:The thing I liked about Laharrere was his point that the URR numbers are guesses and anyone who gives them more than one or 2 digits of accuracy are deluding themselves as to their own omnipotence.


![]() by ROCKMAN » Wed 28 Aug 2013, 08:10:16
by ROCKMAN » Wed 28 Aug 2013, 08:10:16
![]() by Pops » Wed 28 Aug 2013, 09:04:29
by Pops » Wed 28 Aug 2013, 09:04:29
Keith_McClary wrote:"one or 2 digits of accuracy" on URR only moves the peak by a few minutes months. An important Peak Oil Fact which you refuse to include in the top 10Pops wrote:The thing I liked about Laharrere was his point that the URR numbers are guesses and anyone who gives them more than one or 2 digits of accuracy are deluding themselves as to their own omnipotence..

![]() by dcoyne78 » Wed 28 Aug 2013, 13:17:02
by dcoyne78 » Wed 28 Aug 2013, 13:17:02
Pops wrote:Thanks DC. Wow, you put much more effort into it than I did but surprisingly my simple guess (all the increase in TX & ND since they started increasing) works out to 1,928 MMb/d in April!
According to EIA data, world oil production over the period increased by 1,976mmb/d. Pretty close.
This is why I've been saying for a while now that the world is flat except for 14 counties in the US. A strange time for some to be dancing on the grave of PO.
You wouldn't happen to have put together the tight oil data by month would you? I'll send a PM with my email if you wouldn't mind sharing...
Return to Peak oil studies, reports & models
Users browsing this forum: No registered users and 70 guests
