I suppose this is the right place to mention the model I just got published in The Oil Drum, which takes the classic World3 "Limits to growth" model to the world of climate change, peak oil and EROEI. Hope you enjoy it:
http://europe.theoildrum.com/node/5145


PeakOil is You
New World Model based on "Limits to Growth" model
New World Model based on "Limits to Growth" model
![]() by Doly » Sun 12 Apr 2009, 16:11:33
by Doly » Sun 12 Apr 2009, 16:11:33
What are you doing about peak oil?
I am doing this
(click on the www button) v
I am doing this
(click on the www button) v
-

Doly - Expert

- Posts: 4366
- Joined: Fri 03 Dec 2004, 04:00:00
Re: New World Model based on "Limits to Growth" model
![]() by thuja » Sun 12 Apr 2009, 18:39:58
by thuja » Sun 12 Apr 2009, 18:39:58
Thanks for posting this Doly. Very interesting and detailed depiction of what is coming. I think your models don't show decline fast enough for many of the people here. But It seems evident that we are entering an age where basic resources in the form of food and energy will not meet global needs and will lead to a decrease in living standards and average age of mortality.
No Soup for You!!
-

thuja - Intermediate Crude

- Posts: 2202
- Joined: Sat 15 Oct 2005, 03:00:00
- Location: Portland, Oregon
Re: New World Model based on "Limits to Growth" model
![]() by Bas » Sun 12 Apr 2009, 19:27:49
by Bas » Sun 12 Apr 2009, 19:27:49
wow Doly, you must've put some real effort in there, very interesting, especially as I'm reading one of the follow ups on "limits to growth" in which they also use world3.
- Bas
Re: New World Model based on "Limits to Growth" model
![]() by Iaato » Sun 12 Apr 2009, 20:30:14
by Iaato » Sun 12 Apr 2009, 20:30:14
Doly, this is fabulous work. From the graphs, it looks like you used Stella? It's great that you have incorporated EROI and specifying types of energy. I agree with your assumptions about EROI. The inclusion of carbon emissions and resulting graphs fit with my view of what will happen, too.
Your model actually predicts fairly optimistic outcomes, and I have several issues regarding your assumptions. I don't understand why you feel that non-renewable resources such as minerals can be deleted as not important?
What happens if you leave demand out of the model? Is demand essential to include? Doesn't demand follow supply, and won't we essentially use supply as fast as we can? Since there is no way to have more than matching supply and demand, why bother? Might the inclusion of demand create errors by artificially improving supply?
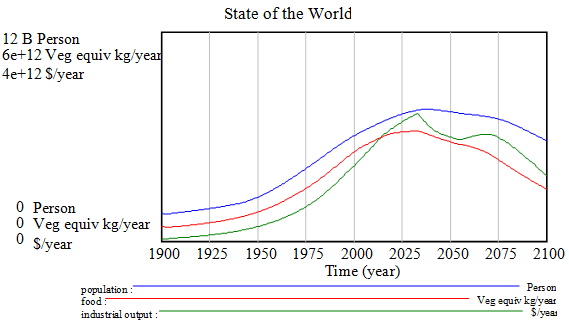
What causes the blip in descent of industrial output, and why is the decline so prolonged? I anticipate a much faster fall. I can understand the initial sharp peak; I view hyperinflation as causing a coming speeding up of world GDP in one big final blast of frenzied activity. But what causes the second lower peak in your model run?
Fabulous work, interesting results.
Your model actually predicts fairly optimistic outcomes, and I have several issues regarding your assumptions. I don't understand why you feel that non-renewable resources such as minerals can be deleted as not important?
What happens if you leave demand out of the model? Is demand essential to include? Doesn't demand follow supply, and won't we essentially use supply as fast as we can? Since there is no way to have more than matching supply and demand, why bother? Might the inclusion of demand create errors by artificially improving supply?
What causes the blip in descent of industrial output, and why is the decline so prolonged? I anticipate a much faster fall. I can understand the initial sharp peak; I view hyperinflation as causing a coming speeding up of world GDP in one big final blast of frenzied activity. But what causes the second lower peak in your model run?
Fabulous work, interesting results.
“Paper money eventually returns to its intrinsic value ---- zero.” --Voltaire
-

Iaato - Heavy Crude

- Posts: 1008
- Joined: Mon 12 Mar 2007, 03:00:00
- Location: As close as I can get to the beginning of the pipe.
Re: New World Model based on "Limits to Growth" model
![]() by shortonsense » Sun 12 Apr 2009, 22:47:32
by shortonsense » Sun 12 Apr 2009, 22:47:32
Doly wrote:I suppose this is the right place to mention the model I just got published in The Oil Drum, which takes the classic World3 "Limits to growth" model to the world of climate change, peak oil and EROEI. Hope you enjoy it:
http://europe.theoildrum.com/node/5145
May we ask questions without offense being taken? If it is meant as a stand alone, not available for comment article, I will of course respect that position.
-

shortonsense - Permanently Banned
- Posts: 3124
- Joined: Sat 30 Aug 2008, 03:00:00
Re: New World Model based on "Limits to Growth" model
![]() by Quinny » Mon 13 Apr 2009, 04:39:40
by Quinny » Mon 13 Apr 2009, 04:39:40
Excellent - thankyou
Live, Love, Learn, Leave Legacy.....oh and have a Laugh while you're doing it!
-

Quinny - Intermediate Crude
- Posts: 3337
- Joined: Thu 03 Jul 2008, 03:00:00
Re: New World Model based on "Limits to Growth" model
![]() by Doly » Sun 26 Apr 2009, 16:39:00
by Doly » Sun 26 Apr 2009, 16:39:00
Of course you may ask questions! That was the point of posting here. I'm not a regular poster as I used to be (not working in a callcentre any more with plenty of five-minute gaps to fill in the day), but I still believe in discussion forums. Sorry for not replying before, I've been crazy busy lately.
No, it's Vensim. You can download it from free here:
http://www.vensim.com/freedownload.html
The purely logical reason is that with unlimited energy, you could get minerals from anywhere, asteroids or nuclear reactions. The main limiting factor is energy, rather than materials.
There is another, more practical reason, which is I can't think of a way of amalgamating all minerals together that could make sense. And, like Ugo Bardi likes to show in his presentations, estimating the amount of available minerals is a trickier issue than for fossil fuels (look up "mineralogical barrier")
Yes, it's essential, because with no demand, there is no exploitation. You don't consume something that isn't demanded.
An economist would have a seizure reading that. ("Of course it's the other way round! Supply follows demand!") Me, not being an economist, can see your point of view. But it's actually incorrect for the past. In the past, fossil fuels weren't exploited as fast as they possibly could, they were exploited according to demand, that, true, was growing steadily, but not as fast as technology could have possibly exploited the fields.
Because I'm trying to figure out what happens with a whole lot of energy sources, that's why. If I only had to deal with one, I wouldn't have bothered. But if I'm trying to find out how people will change from one energy source to another, I don't see how it can be done without thinking about demand.
Look at my number of posts. Do you think that somebody that managed to be so obsessive about peakoil.com at one point could possibly make that mistake? No, of course not. Supply will match demand only when it's physically possible. When not, supply will be only as great as geological constraints permit.
That blip happens because at that point there is a plateau in energy production, when renewables start to seriously kick in. But then it continues declining because coal keeps declining. That also answers the second question.
Iaato wrote:From the graphs, it looks like you used Stella?
No, it's Vensim. You can download it from free here:
http://www.vensim.com/freedownload.html
I don't understand why you feel that non-renewable resources such as minerals can be deleted as not important?
The purely logical reason is that with unlimited energy, you could get minerals from anywhere, asteroids or nuclear reactions. The main limiting factor is energy, rather than materials.
There is another, more practical reason, which is I can't think of a way of amalgamating all minerals together that could make sense. And, like Ugo Bardi likes to show in his presentations, estimating the amount of available minerals is a trickier issue than for fossil fuels (look up "mineralogical barrier")
What happens if you leave demand out of the model? Is demand essential to include?
Yes, it's essential, because with no demand, there is no exploitation. You don't consume something that isn't demanded.
Doesn't demand follow supply, and won't we essentially use supply as fast as we can?
An economist would have a seizure reading that. ("Of course it's the other way round! Supply follows demand!") Me, not being an economist, can see your point of view. But it's actually incorrect for the past. In the past, fossil fuels weren't exploited as fast as they possibly could, they were exploited according to demand, that, true, was growing steadily, but not as fast as technology could have possibly exploited the fields.
Since there is no way to have more than matching supply and demand, why bother?
Because I'm trying to figure out what happens with a whole lot of energy sources, that's why. If I only had to deal with one, I wouldn't have bothered. But if I'm trying to find out how people will change from one energy source to another, I don't see how it can be done without thinking about demand.
Might the inclusion of demand create errors by artificially improving supply?
Look at my number of posts. Do you think that somebody that managed to be so obsessive about peakoil.com at one point could possibly make that mistake? No, of course not. Supply will match demand only when it's physically possible. When not, supply will be only as great as geological constraints permit.
What causes the blip in descent of industrial output, and why is the decline so prolonged?
That blip happens because at that point there is a plateau in energy production, when renewables start to seriously kick in. But then it continues declining because coal keeps declining. That also answers the second question.
What are you doing about peak oil?
I am doing this
(click on the www button) v
I am doing this
(click on the www button) v
-
Doly - Expert
- Posts: 4366
- Joined: Fri 03 Dec 2004, 04:00:00
Re: New World Model based on "Limits to Growth" model
![]() by shortonsense » Sun 26 Apr 2009, 20:45:44
by shortonsense » Sun 26 Apr 2009, 20:45:44
Doly wrote:Of course you may ask questions! That was the point of posting here. I'm not a regular poster as I used to be (not working in a callcentre any more with plenty of five-minute gaps to fill in the day), but I still believe in discussion forums.
Excellent. Then I shall start with a basic one which you have stated early in your article, but did not elaborate on.
Section 2.1 quoted as:
"One of the criticisms levelled at World3, that has been often repeated with other global models, is that there is so much uncertainty in so many of the relevant variables, that there isn’t any point in the exercise of modelling at all. While it’s true that there is a lot of uncertainty, it’s worth remembering that this won’t stop people making models of the world."
The statement on the surface is completely reasonable. The question about this statement is as follows:
What efforts were made to test the sensitivity of your final answer on ANY of the uncertainties involved in your core assumptions?
If, for example, a single percentage point deviation from actual on a single core assumption ( say, the equation which you use to schedule the volume of a particular resources supply volume based on its ultimate size ) allowing the model to return answers in short time periods of either 0 or infinity would in fact make the model completely useless, as you are already aware.
Without the sensitivity testing you would never know that this equation could introduce such a lethal uncertainty into the entire model. This uncertainty has nothing to do with the expert quality of the data which went into it, or the amount of effort, it is just an artifact of how the model was assembled around this particular equation.
I would also ask about Graph 3.1.2.1 representing the flow diagram to model energy demand. I did not see an explanation on correlation between the various components or how they were handled?
For that matter I didn't see correlations handled anywhere. For example, the correlation between the reserve numbers you used and the political stability necessary to utilize those reserves? The correlation between climate change which is implicit in the model and used to negatively effect agriculture, and the heating demand figure you assumed at 400 kg/capita? I would think that there would be a negative correlation there of some size ( less agriculture because of CO2, more heat, less heating demand, correlation of -0.25 or some such? ).
I have others of course, but those are good for starters.
-
shortonsense - Permanently Banned
- Posts: 3124
- Joined: Sat 30 Aug 2008, 03:00:00
Re: New World Model based on "Limits to Growth" model
![]() by Doly » Sun 03 May 2009, 14:09:55
by Doly » Sun 03 May 2009, 14:09:55
shortonsense wrote:What efforts were made to test the sensitivity of your final answer on ANY of the uncertainties involved in your core assumptions?
Congratulations! You've asked the best question anybody has asked so far, and certainly there are some good brains reading The Oil Drum, but this one is just the kind of thinking that needs to be done.
I'm very aware that as soon as there are uncertainties in parameters, the whole model can go into question. There are even uncertainties on whether the equations used are correct. I have tested the most uncertain ones by trying a range of values on them, and got an idea of the variability on the results. The whole concept of considering different scenarios is exactly to test what happens under different assumptions and see if there are common themes emerging.
A few things that I have tested for:
1) Different ultimate reserves for nonrenewable energy sources. As you would expect, that delays the decline, but not for long, and the final result is similar.
2) Different assumptions about EROEI decline in nonrenewable energy sources. The results don't change a lot, unless you put an assumption where EROEI declines rather sharply. In that case, industrial output can collapse as the result of peak oil alone, because the world can't switch to other energy sources on time.
3) Higher EROEI for renewables. If this is done, renewables to start being used in significant amounts earlier, the decline is slower, but the general pattern is similar.
4) A policy to increase the use of renewables early, regardless of EROEI. This results in renewables increasing early on, and the final decline being more moderate.
I'm interested in any other ideas of assumptions that are worth testing.
shortonsense wrote:I would also ask about Graph 3.1.2.1 representing the flow diagram to model energy demand. I did not see an explanation on correlation between the various components or how they were handled?
I didn't explain this because a lot of it was taken from the original World3 model. I took the part of the model for nonrenewable resources and how a policy to use them more efficiently could affect the results to represent how a policy of more efficient use of electricity could affect the results.
The bottom of the flow diagram just shows that demand for electricity, heat and liquid fuels is added up to calculate the total energy demand.
shortonsense wrote:For example, the correlation between the reserve numbers you used and the political stability necessary to utilize those reserves?
There isn't anything in my model to represent "political stability", and it's one of the things that have been mentioned before (no wars on the model!) But I don't see any way such a complicated concept could be represented in equations.
shortonsense wrote:The correlation between climate change which is implicit in the model and used to negatively effect agriculture, and the heating demand figure you assumed at 400 kg/capita? I would think that there would be a negative correlation there of some size ( less agriculture because of CO2, more heat, less heating demand, correlation of -0.25 or some such? )
That's a good point, and it depends a lot on what the expected temperatures are. My model doesn't calculate the average increase in temperature, but it may prove necessary to include it. At the levels of CO2 that my model is predicting, the average increase in temperature wouldn't be more than 3C, from what I have read. I'm not sure if this would affect significantly enough the demand for heating.
What are you doing about peak oil?
I am doing this
(click on the www button) v
I am doing this
(click on the www button) v
-
Doly - Expert
- Posts: 4366
- Joined: Fri 03 Dec 2004, 04:00:00
Re: New World Model based on "Limits to Growth" model
![]() by shortonsense » Sun 03 May 2009, 15:42:33
by shortonsense » Sun 03 May 2009, 15:42:33
Doly wrote:
I'm very aware that as soon as there are uncertainties in parameters, the whole model can go into question. There are even uncertainties on whether the equations used are correct. I have tested the most uncertain ones by trying a range of values on them, and got an idea of the variability on the results. The whole concept of considering different scenarios is exactly to test what happens under different assumptions and see if there are common themes emerging.
A few things that I have tested for:
1) Different ultimate reserves for nonrenewable energy sources. As you would expect, that delays the decline, but not for long, and the final result is similar.
I would venture that your equation for how fast the supply of a resource is coming on line is flawed, and this flaw is correlated with and only specific to a small subset of the actual resource base available for development in the future. It is similar to the "field growth" problem in that if you make the assumption that only what you see is available for development, you massively UNDERestimate how much resource will be converted into reserves and available for use in the future. Laherrere's estimates are very much a reserve estimate rather than a resource estimate, and would lead any model directly into this particular trap. The original modelers in Limits to Growth stumbled into this issue as well, if I recall correctly.
Others have tackled a problem very similar to yours. I would recommend you review the work of Kawata and Fujita, SPE Paper 68755, "Some Predictions of Possible Unconventional Hydrocarbons Availability until 2100".
Doly wrote:2) Different assumptions about EROEI decline in nonrenewable energy sources. The results don't change a lot, unless you put an assumption where EROEI declines rather sharply. In that case, industrial output can collapse as the result of peak oil alone, because the world can't switch to other energy sources on time.
In this case, it would then be reasonable to make the EROEI decline rate a range in a Monte Carlo simulation and quantify "sharply" from whatever else you are normally using.
Doly wrote:3) Higher EROEI for renewables. If this is done, renewables to start being used in significant amounts earlier, the decline is slower, but the general pattern is similar.
Interesting. Can you tell from running these scenario's what level of EROEI is necessary to completely NEGATE the use of non renewables?
Doly wrote:4) A policy to increase the use of renewables early, regardless of EROEI. This results in renewables increasing early on, and the final decline being more moderate.
With different and more reasonable non renewable resource estimates in the model, would you be willing to bet that "final decline being more moderate" could easily turn into "no decline for the foreseeable future"?
Doly wrote:I'm interested in any other ideas of assumptions that are worth testing.
My general interests run towards statistics and uncertainty nowadays. I can understand completely your original comment about uncertainty being great enough to completely negate the value of models such as these. But they are still fun to play with.
My only comment would be that without incorporating uncertainty and determining exactly where dependencies lie in a detailed sensitivity analysis, its difficult to even answer the question as to a deterministic models value.
Doly wrote:shortonsense wrote:For example, the correlation between the reserve numbers you used and the political stability necessary to utilize those reserves?
There isn't anything in my model to represent "political stability", and it's one of the things that have been mentioned before (no wars on the model!) But I don't see any way such a complicated concept could be represented in equations.
Oh, there are lots of ways. Imagine a "Sim City" scenario, make some assumptions about per capita GDP, put a randomizer into the model which triggers a random event of random size, base its frequency on that per capita GDP, allow it to remain stable MOST of the time, but allow in the occasional meltdown through war, and some of those would be in resource rich areas and would suddenly drive the economics in such a way as to boost the need for non renewable development in a short time frame.
I'm not sure that is an equation explanation as much as it is a probabilistic one, so without the probabilistic modeling capabilities it would be much more difficult.
Doly wrote:shortonsense wrote:The correlation between climate change which is implicit in the model and used to negatively effect agriculture, and the heating demand figure you assumed at 400 kg/capita? I would think that there would be a negative correlation there of some size ( less agriculture because of CO2, more heat, less heating demand, correlation of -0.25 or some such? )
That's a good point, and it depends a lot on what the expected temperatures are. My model doesn't calculate the average increase in temperature, but it may prove necessary to include it. At the levels of CO2 that my model is predicting, the average increase in temperature wouldn't be more than 3C, from what I have read. I'm not sure if this would affect significantly enough the demand for heating.
Depends on where that +3C shows up. Also, once you open up the non renewable resource base a little bit, you'll allow more CO2 output which might provide another 2 or 3C temperature increase, +6C has got to cause less heating needs somewhere.
-
shortonsense - Permanently Banned
- Posts: 3124
- Joined: Sat 30 Aug 2008, 03:00:00
Re: New World Model based on "Limits to Growth" model
![]() by yesplease » Mon 04 May 2009, 23:50:36
by yesplease » Mon 04 May 2009, 23:50:36
What range of EROEI values did ya use for oil Doly?
Professor Membrane wrote: Not now son, I'm making ... TOAST!
-

yesplease - Intermediate Crude
- Posts: 3765
- Joined: Tue 03 Oct 2006, 03:00:00
Re: New World Model based on "Limits to Growth" model
![]() by shortonsense » Tue 05 May 2009, 00:05:39
by shortonsense » Tue 05 May 2009, 00:05:39
yesplease wrote:What range of EROEI values did ya use for oil Doly?
I think she mentions it in her writeup at TOD. She provided the link...I'm pretty sure I saw them in there.
-
shortonsense - Permanently Banned
- Posts: 3124
- Joined: Sat 30 Aug 2008, 03:00:00
Re: New World Model based on "Limits to Growth" model
![]() by yesplease » Tue 05 May 2009, 02:20:28
by yesplease » Tue 05 May 2009, 02:20:28
I asked there too, but I didn't receive a reply and the comments are closed. Based on what I did see, the OP assumed oil's EROEI was at ~100:1 in the 1930s, and fell from there on, using the work of Cleveland. However, unlike Cleveland, the OP didn't preface this with the qualifier that the 100:1 figure was for discovery only, not including production costs over the life of the well, refining costs, and transportation costs. The other figures only include production costs, and also do not include refining or transportation costs. The reason this is important is that refining puts a cap on oil's EROEI of ~5:1, so at best this is what we could have been at during oil's heydays. Assuming we had tremendous FF based EROEIs and are transitioning to much lower renewable EROEIs would probably induce a relatively inaccurate model compared to using oil at an EROEI of ~5:1 or lower, and then transitioning to renewables with EROEIs in the ~10-30:1 range.
Professor Membrane wrote: Not now son, I'm making ... TOAST!
-
yesplease - Intermediate Crude
- Posts: 3765
- Joined: Tue 03 Oct 2006, 03:00:00
Re: New World Model based on "Limits to Growth" model
![]() by shortonsense » Tue 05 May 2009, 23:24:04
by shortonsense » Tue 05 May 2009, 23:24:04
yesplease wrote:I asked there too, but I didn't receive a reply and the comments are closed. Based on what I did see, the OP assumed oil's EROEI was at ~100:1 in the 1930s, and fell from there on, using the work of Cleveland. However, unlike Cleveland, the OP didn't preface this with the qualifier that the 100:1 figure was for discovery only, not including production costs over the life of the well, refining costs, and transportation costs. The other figures only include production costs, and also do not include refining or transportation costs. The reason this is important is that refining puts a cap on oil's EROEI of ~5:1, so at best this is what we could have been at during oil's heydays. Assuming we had tremendous FF based EROEIs and are transitioning to much lower renewable EROEIs would probably induce a relatively inaccurate model compared to using oil at an EROEI of ~5:1 or lower, and then transitioning to renewables with EROEIs in the ~10-30:1 range.
I have to seriously question the entire EROEI approach as a basis for how the model transitions between FF's and renewables or anything else for that matter. After reading the Dollys entire article I wasn't clear on how well value, as in her GDP measures and calculations, mixes with an EROEI basis for transitioning around energy supplies which of course impact GDP. I understand wanting to use EROEI of course, it looks much cleaner ( I don't know that it is because no one uses it as a measure of value in the energy business, as demonstrated by the most recent TOD article of an energy conference of some sort in Europe ) and keeps the modeler away from basic supply/demand calculations and the attendant problems with the "usefulness" of a FF which places a VALUE premium on the same amount of energy....
-
shortonsense - Permanently Banned
- Posts: 3124
- Joined: Sat 30 Aug 2008, 03:00:00
Re: New World Model based on "Limits to Growth" model
![]() by yesplease » Wed 06 May 2009, 02:06:02
by yesplease » Wed 06 May 2009, 02:06:02
That's definitely a concern. For instance 5kW of solar panels plus some solar hot water would allow for all the usual stuff like AC and heating, consumer appliances, a couple efficient EVs at ~20k+ miles/year. So, on one hand, I can plunk down about $10-20k once in order to have enough energy produced for just about everything most people do for the next few decades at least, just in a more efficient way, or I can pay ~$75k ($2.5k/year for thirty years) for the same clunky inefficient FF powered stuff. In terms of value, that's a slam dunk. Granted, most consumers don't really care much about saving money, for instance many people pay off a 30 year loan over the full term, paying twice what they would have if they had simply saved aggressively and bought something, but there's plenty of value there for someone who is interested in that sort of thing.
That value represents the difference in both availability, since I can't drop an oil drill in my back yard, and EROEI, since I get more energy doing useful work via electricity from renewables than via chemical energy from FFs. For example a conventional vehicle at 25-50mpg uses about 1-2 kWh/mile of WTW FF based energy. An EV uses~150-300Wh/mile, depending on model, so we're talking about having ~6-7 times more useful energy, stuff that's doing work, be it moving a car, powering a game console, or spinning an AC compressor. Ironically, the difference in levelized cost almost mirrors the difference in useful energy, give or take.
Anyway, like I said before, a model that selectively uses extremely high EROEI figures that are only for discovery and/or extraction, and compares them to EROEI numbers for renewables over their entire life probably isn't going to be accurate. Not to mention that it ignores the difference in exergy, the amount of energy available for useful work, which is another reason why renewables are more cost effective. From 1kWh of electricity I can get ~.7kWh of useful work done in an EV, but in a conventional car 1kWh of oil will only get me ~.1-.2kWh of useful work.
Professor Membrane wrote: Not now son, I'm making ... TOAST!
-
yesplease - Intermediate Crude
- Posts: 3765
- Joined: Tue 03 Oct 2006, 03:00:00
Re: New World Model based on "Limits to Growth" model
![]() by shortonsense » Thu 07 May 2009, 00:20:54
by shortonsense » Thu 07 May 2009, 00:20:54
yesplease wrote:
Anyway, like I said before, a model that selectively uses extremely high EROEI figures that are only for discovery and/or extraction, and compares them to EROEI numbers for renewables over their entire life probably isn't going to be accurate. Not to mention that it ignores the difference in exergy, the amount of energy available for useful work, which is another reason why renewables are more cost effective. From 1kWh of electricity I can get ~.7kWh of useful work done in an EV, but in a conventional car 1kWh of oil will only get me ~.1-.2kWh of useful work.
Dolly seems like a smart cookie, her comments on knowing what uncertainty will do to her model means she understands at least the path that will lead her down exactly because of reasons like this. The entire EROEI/$$ transition ( let alone using some great huge average EROEI based on nothing but some age equivalent which isn't true, otherwise Prudhoe Bay EROEI = Bakken EROEI ) just adds a level of complexity ( and more uncertainty because it CAN'T be right in its current form ) which is neither necessary nor realistic.
-
shortonsense - Permanently Banned
- Posts: 3124
- Joined: Sat 30 Aug 2008, 03:00:00
Re: New World Model based on "Limits to Growth" model
![]() by yesplease » Thu 07 May 2009, 00:40:53
by yesplease » Thu 07 May 2009, 00:40:53
Based on what I've read she hasn't tested for low EROEI in terms of oil and possibly other FFs, just changed the rate of decline from the erroneous 100:1 figure and bumped up renewables a bit in order to see how those outcomes change. Assuming oil and other FFs have spectacular EROEIs when they're worse than most renewables and provide less useful energy to boot hasn't been tested so far, unless of course I've missed something.
Professor Membrane wrote: Not now son, I'm making ... TOAST!
-
yesplease - Intermediate Crude
- Posts: 3765
- Joined: Tue 03 Oct 2006, 03:00:00
Re: New World Model based on "Limits to Growth" model
![]() by shortonsense » Thu 07 May 2009, 01:02:35
by shortonsense » Thu 07 May 2009, 01:02:35
yesplease wrote:Based on what I've read she hasn't tested for low EROEI in terms of oil and possibly other FFs, just changed the rate of decline from the erroneous 100:1 figure and bumped up renewables a bit in order to see how those outcomes change. Assuming oil and other FFs have spectacular EROEIs when they're worse than most renewables and provide less useful energy to boot hasn't been tested so far, unless of course I've missed something.
I think we've both missed something, she's using a core model ( see those flow diagrams? ) which she doesn't sound entirely knowledgeable on. While its a situation modelers are undoubtedly are forced into working in collaborative efforts, its pretty scary to invest bunches of time and effort, and then when someone asks you the question..."and so what happens then?" and you are forced to punt..."well, someone else built that part, its the XYZ model" and unless the asker knows what the XYZ model is, and does, its just turned into some magical black box answer which you can't even be certain is just randomly multiplying numbers together and pretending its meaningful.
-
shortonsense - Permanently Banned
- Posts: 3124
- Joined: Sat 30 Aug 2008, 03:00:00
Re: New World Model based on "Limits to Growth" model
![]() by shortonsense » Sat 09 May 2009, 21:50:02
by shortonsense » Sat 09 May 2009, 21:50:02
Shannymara wrote:She said it's based on the World3 model, which IIRC are open source and readily available. So it's not a black box, generally speaking.
But depending on its complexity, it could require quite a bit of work to understand at even a basic, conversational level. As demonstrated by the question I asked which she couldn't answer, she could only refer me to the model itself. Which implies, and Dolly can correct me if I'm wrong, that she is using something which she herself isn't quite sure how it works at the detail level. She might know how its been explained to her, but to know the particulars tends to require knowing the detail. Correlations among particulars in flow diagrams is one of those particulars.
I have to admit, as a occasional model builder myself, even when I've built one of these things, give me a year and I won't recall the detailed particulars of my own work without some review.
-
shortonsense - Permanently Banned
- Posts: 3124
- Joined: Sat 30 Aug 2008, 03:00:00
Re: New World Model based on "Limits to Growth" model
![]() by Doly » Sun 10 May 2009, 06:42:19
by Doly » Sun 10 May 2009, 06:42:19
I'll reply to the comments in an aggregated form again:
Actually, that isn't an issue in my model or in the Limits to Growth model. One thing that is easy to test is what happens assuming that there are more fossil fuels available. I said before that I tested for this and you get something similar happening, only a bit later. In the original Limits to Growth model the same kind of test was done by duplicating the amount of nonrenewable resources, and exactly the same thing happens.
Yes, that's something I could look into, somebody else has also suggested it. No need for Monte Carlo on this one, though. Just testing on different slopes.
Simple. If the EROEI of renewables is higher than nonrenewables, they will get used.
Actually, I'd be happy to bet the opposite. Increasing the estimate of nonrenewable energy sources is not actually improving things in the long term, it tends to make things worse because it increases climate change and makes the transition to renewables harder.
That kind of scenario operates for short time frames, my model operates at much larger time frames. It isn't meant to find out every fluctuation of GDP, it gives you a rough idea of what GDP might do over the long term. If you have any idea to estimate how often meltdowns of political stability happen given a certain set of circumstances, over a long period of time, that would be useful. Otherwise, it isn't something I could include in the model.
According to the book "Six degrees", if we reach that point, the lowering of our heating needs won't be the most pressing of our concerns.
All the studies I've seen comparing EROEIs of different sources agree that fossil fuels generally have higher EROEI than renewables, or at least used to have. Certainly we wouldn't have started producing electricity from coal, rather than wind, if coal wasn't easier. My model assumes that the transition to renewables happens when the EROEI of renewables is comparable to the EROEI of fossil fuels.
GDP isn't used at all to estimate the transition between energy supplies. It's all based on EROEI, and the assumption is that energy sources with high EROEI will also be the most profitable. You can challenge this assumption, but it seems to fit well with available data.
I didn't say I didn't know what that part is. I said it was part of the original World3 model, meaning that if you want to take issue with that part, it's not something I did myself. Actually, in this particular case you couldn't possibly have much of a problem with that part, because it's about an optional technology for higher efficiency in electricity that isn't used for the "business as usual" scenario.
I accept that there are parts of the World3 model I don't understand in detail, and in fact, after exchanging emails with Dennis Meadows and Jorgen Randers, I'm pretty sure that there isn't anybody around today that understands the whole model in detail, if there ever was such a person. Which isn't to say that the model isn't usable. I'm familiar enough with it that I could easily figure out what any part of it does, if I had reason to. It's just that I have chosen to concentrate on the energy and economic issues and not study too deeply other parts of it.
One of the reasons I used World3 was because it's well known, so I hope that there will be many more people that are familiar with at least parts of the model and can detect any major flaws.
I would venture that your equation for how fast the supply of a resource is coming on line is flawed, and this flaw is correlated with and only specific to a small subset of the actual resource base available for development in the future. It is similar to the "field growth" problem in that if you make the assumption that only what you see is available for development, you massively UNDERestimate how much resource will be converted into reserves and available for use in the future. Laherrere's estimates are very much a reserve estimate rather than a resource estimate, and would lead any model directly into this particular trap. The original modelers in Limits to Growth stumbled into this issue as well, if I recall correctly.
Actually, that isn't an issue in my model or in the Limits to Growth model. One thing that is easy to test is what happens assuming that there are more fossil fuels available. I said before that I tested for this and you get something similar happening, only a bit later. In the original Limits to Growth model the same kind of test was done by duplicating the amount of nonrenewable resources, and exactly the same thing happens.
In this case, it would then be reasonable to make the EROEI decline rate a range in a Monte Carlo simulation and quantify "sharply" from whatever else you are normally using.
Yes, that's something I could look into, somebody else has also suggested it. No need for Monte Carlo on this one, though. Just testing on different slopes.
Interesting. Can you tell from running these scenario's what level of EROEI is necessary to completely NEGATE the use of non renewables?
Simple. If the EROEI of renewables is higher than nonrenewables, they will get used.
With different and more reasonable non renewable resource estimates in the model, would you be willing to bet that "final decline being more moderate" could easily turn into "no decline for the foreseeable future"?
Actually, I'd be happy to bet the opposite. Increasing the estimate of nonrenewable energy sources is not actually improving things in the long term, it tends to make things worse because it increases climate change and makes the transition to renewables harder.
Imagine a "Sim City" scenario, make some assumptions about per capita GDP, put a randomizer into the model which triggers a random event of random size, base its frequency on that per capita GDP, allow it to remain stable MOST of the time, but allow in the occasional meltdown through war, and some of those would be in resource rich areas and would suddenly drive the economics in such a way as to boost the need for non renewable development in a short time frame.
That kind of scenario operates for short time frames, my model operates at much larger time frames. It isn't meant to find out every fluctuation of GDP, it gives you a rough idea of what GDP might do over the long term. If you have any idea to estimate how often meltdowns of political stability happen given a certain set of circumstances, over a long period of time, that would be useful. Otherwise, it isn't something I could include in the model.
Also, once you open up the non renewable resource base a little bit, you'll allow more CO2 output which might provide another 2 or 3C temperature increase, +6C has got to cause less heating needs somewhere.
According to the book "Six degrees", if we reach that point, the lowering of our heating needs won't be the most pressing of our concerns.
Assuming we had tremendous FF based EROEIs and are transitioning to much lower renewable EROEIs would probably induce a relatively inaccurate model compared to using oil at an EROEI of ~5:1 or lower, and then transitioning to renewables with EROEIs in the ~10-30:1 range.
All the studies I've seen comparing EROEIs of different sources agree that fossil fuels generally have higher EROEI than renewables, or at least used to have. Certainly we wouldn't have started producing electricity from coal, rather than wind, if coal wasn't easier. My model assumes that the transition to renewables happens when the EROEI of renewables is comparable to the EROEI of fossil fuels.
After reading the Dollys entire article I wasn't clear on how well value, as in her GDP measures and calculations, mixes with an EROEI basis for transitioning around energy supplies which of course impact GDP.
GDP isn't used at all to estimate the transition between energy supplies. It's all based on EROEI, and the assumption is that energy sources with high EROEI will also be the most profitable. You can challenge this assumption, but it seems to fit well with available data.
While its a situation modelers are undoubtedly are forced into working in collaborative efforts, its pretty scary to invest bunches of time and effort, and then when someone asks you the question..."and so what happens then?" and you are forced to punt..."well, someone else built that part, its the XYZ model" and unless the asker knows what the XYZ model is, and does, its just turned into some magical black box answer which you can't even be certain is just randomly multiplying numbers together and pretending its meaningful.
I didn't say I didn't know what that part is. I said it was part of the original World3 model, meaning that if you want to take issue with that part, it's not something I did myself. Actually, in this particular case you couldn't possibly have much of a problem with that part, because it's about an optional technology for higher efficiency in electricity that isn't used for the "business as usual" scenario.
I accept that there are parts of the World3 model I don't understand in detail, and in fact, after exchanging emails with Dennis Meadows and Jorgen Randers, I'm pretty sure that there isn't anybody around today that understands the whole model in detail, if there ever was such a person. Which isn't to say that the model isn't usable. I'm familiar enough with it that I could easily figure out what any part of it does, if I had reason to. It's just that I have chosen to concentrate on the energy and economic issues and not study too deeply other parts of it.
One of the reasons I used World3 was because it's well known, so I hope that there will be many more people that are familiar with at least parts of the model and can detect any major flaws.
What are you doing about peak oil?
I am doing this
(click on the www button) v
I am doing this
(click on the www button) v
-
Doly - Expert
- Posts: 4366
- Joined: Fri 03 Dec 2004, 04:00:00
57 posts
• Page 1 of 3 • 1, 2, 3
Return to Peak oil studies, reports & models
Who is online
Users browsing this forum: No registered users and 61 guests