Following are links to my first and most recent articles on net oil exports. The ECI (Export Capacity Index) ratio article is not yet updated with 2012 data (working on it right now). In the January, 2006 Oil Drum article, I introduced the Export Land Model (ELM), which of course is just a simple mathematical model, and in the February, 2013 article, I introduced the ECI concept.
Hubbert Linearization Analysis of the Top Three Net Oil ExportersJanuary, 2006
http://www.theoildrum.com/story/2006/1/27/14471/5832 The Export Capacity Index (ECI)February, 2013
http://peak-oil.org/2013/02/commentary- ... ity-index/Here are the net export numbers for the (2005) Top Three net exporters (EIA) for 2002 to 2005 (Saudi Arabia, Russia, Norway, EIA total petroleum liquids + other liquids):
2002: 15.3 mbpd
2003: 17.2
2004: 18.1
2005: 18.6
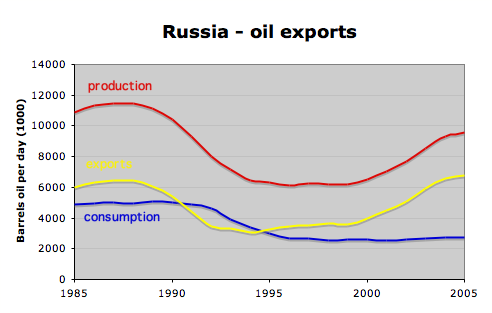
In 2005, these three net exporters accounted for 41% of Global Net Exports of oil (GNE, Top 33 net exporters in 2005, EIA). In early 2006, I wrote my little essay that introduced the ELM concept, focusing on net exports from Saudi Arabia, Russia and Norway. This was my first, and fairly crude, effort at trying to use the logistic (HL) approach to try to model future net exports, and I was too pessimistic regarding short term Russian production (and I was too pessimistic to a lesser degree regarding short term Saudi production), but Russian net exports stopped growing in 2007, and Saudi net exports have remained below their 2005 rate for seven (and probably eight) straight years.
At the time I wrote this 1/06 essay, Top Three net exports were increasing at 6.5%/year, as global annual (Brent) crude oil prices doubled from $25 in 2002 to $55 in 2005. At a 6.5%/year rate of increase in net exports, combined net exports from the top three would approach 30 mbpd in 2012.
Here is an excerpt from the 1/06 article:
As predicted by Hubbert Linearization, two of the three top net oil exporters are producing below their peak production level. The third country, Saudi Arabia, is probably on the verge of a permanent and irreversible decline. Both Russia and Saudi Arabia are probably going to show significant increases in consumption going forward. It would seem from this case that these factors could interact this year produce to an unprecedented--and probably permanent--net oil export crisis.
In the following seven years from 2005 to 2012, annual crude oil prices doubled again, from $55 in 2005 to $112 in 2012, with one year over year decline in 2009. In response, here are the combined net exports from Saudi Arabia, Russia and Norway (EIA):
2006: 18.0 mbpd
2007: 17.6
2008: 17.9
2009: 16.6
2010: 17.2
2011: 17.4
2012: 17.3
When we plug in some CNE (Cumulative Net Export) estimates, I estimate that Saudi Arabia, Russia and Norway may have collectively already shipped about 30% of their combined post-2005 CNE, through 2012.
Incidentally, (2005) top three production increased at a pretty rapid clip from 2002 to 2005 (5.9%/year). Even if we assume about 3%/year, which is consistent with what Yergin was predicting for the increase in global production in this time frame, top three net exports would have been close to 23 mbpd in 2012, assuming the same (2005 to 2012) rate of increase in consumption (3.7%/year). The actual rate of increase in production was basically zero, as top three production went from 23.6 mbpd in 2005 to 23.8 mbpd in 2012. Note that the above CNE estimate assumes perpetually flat production, which does not seem to be a likely outcome. When we plug in a more realistic production decline number, the post-2005 CNE estimate will fall significantly.