IOW the high initial rates of the shales gave many folks an incorrect impression of the ultimate recover
I don't think that is the case. All of the shale type curves irrespective of what formation or basin they are representative have the same projection of an intial hyperbolic decline (the very high 60 - 80% decline in the first 24 months) followed by an exponential decline where decline rates are recognized as being as low as 1-2%/annum. This type of decline was predicted quite early on by theory (Terry Engelder is best known for his work in this area) and has been proven successfully in the Bakken and longer producing shale gas wells in the US. There are of course different type curves based on average rock lithology and mechanical properties which is why we see a range of EUR across basins such as the Eagleford. There is a wide range of IP versus EUR with some quite large IPs and significant EUR (Permian basin some wells doing 1000 bopd with EUR of 400 - 500 Mbo) some smaller IPs and smaller EUR (areas in Eagleford with IP's in the 150 bopd and EUR below 150 Mbo) and a wide range between. At issue is the amount of anastomosing fractures created during the frack job, how connected they are and whether there are any issues that could cause either plugged perforations (mobile clays), collapsed fractures (compressed sand) or in the unusual event of collapsed casing, all of which can affect the exponential decline portion of the curve and hence EUR. The business is a bit statistical in nature. Operators realize that wells will behave similar to the type curve but will have some spread around it, hence if you drill enough wells the EUR predicted by the type curve should be reasonably accurate for the total well count whereas each individual well my actually perform better or worse than the type curve. It is certainly more difficult to predict EUR given material balance calculations are not an option.
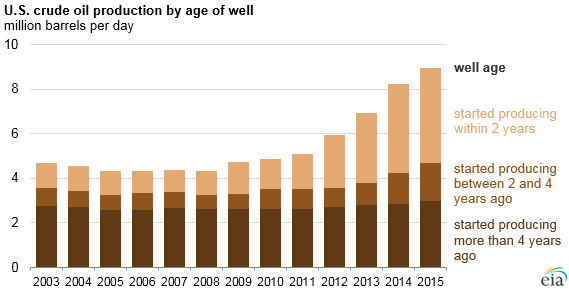
Bottom line:the production profile of future heritage shale wells won't look anything like that of the conventional heritage wells. Once the flush production from the Bakken and EFS has passed the U.S. will return to the down sloping curve we diverted from prior to the shale boom. That stat was anticipated by the oil patch when the shale play began. It was the ever increasing number of new shale wells being drilled that hid the trend we're seeing now.
Once the flush production is gone the shale wells for all intents and purposes should look very similar to stripper wells (low decline for long periods). If all of the shale wells in the US were in their exponential decline portion they would be producing anywhere from 10 - 50 bopd (on average). One way of looking at this would be if we were to assume the majority of the shale wells currently producing were in the hyperbolic decline phase then the 9 MMBO/d rate would sink to somewhere near 2 MMBO/d when they all reached the exponential decline phase ( a gross simplification given the wide range in behavior and the fact that some of the wells producing are already in the exponential phase). My guess is the number would be higher but it is still an interesting point that dropping that far would be the US production back to where it was in the 50's.
Mind you as the US production drops oil price will rise (it is US production that has been mostly responsible for world increase in supply) which will allow for the frack log to be brought on (some estimate 500 Kbopd capacity) followed by new drilling. This could cause issues for sometime until all of the shale basins have become quite mature in both intial drilling as well as any potential downspacing or re-fracking. As a consequence the prediction for future production is difficult to my mind.