Kathy Neset is a long established figure in the development of the Bakken with her geological consulting company.
In a March, 2015 article "Myths of the Bakken", she briefly describes the history of well layout in the early days.
At the time of the article - 2015 - recovery rate was about 7%.
Since then, at least 3 things have been implemented to boost recovery.
First is the use of 200/400 mesh ceramics, originally used in industrial coatings, to scour and help prop the ultra tiny fissures that form when hydraulic pressure is introduced.
The 100 mesh can then enter fractures and keep them open.
This is where all the additional sand is going.
Secondly, materials that temporarily plug fractures - both large fissures near the wellbore and smaller ones 300/500 feet out, laterally - divert frac fluid to unfractured rock and increase the stimulated reservoir volume (SRV) dramatically.
Third item somewhat recently introduced is choking back of newly turned online wells.
The retained frac fluid is produced along with higher volumes of hydrocarbons.
It appears that the artificially high formation pressure is adding to production.
All these techniques are being done in all the shale plays.
The longer history of the Bakken, as well as the common 10,000 +/- foot lateral length makes analysis somewhat easier.
Rather than claiming sweet spots are being drilled up (no question it is a finite area being heavily targeted at present), the economically viable acreage is actually increasing due to better techniques, recovery being only one of them.

PeakOil is You
THE Bakken Thread pt 3 (merged)
Re: The Bakken Strikes Back
![]() by coffeeguyzz » Mon 25 Dec 2017, 10:14:56
by coffeeguyzz » Mon 25 Dec 2017, 10:14:56
- coffeeguyzz
- Lignite

- Posts: 326
- Joined: Mon 27 Oct 2014, 16:09:47
Re: THE Bakken Thread pt 3 (merged)
![]() by Tanada » Sat 27 Jan 2018, 04:33:01
by Tanada » Sat 27 Jan 2018, 04:33:01
Reminiscent of 2014 when the rule was, if you can lease it, you should drill it ASAP.
LINKY
Washington (Platts)--24 Jan 2018 1007 pm EST/307 GMT
For years, large public companies have produced crude oil in North Dakota largely in an area known as "the core of the core" of the Bakken shale play. Faced with low, stagnant oil prices, the big producers have focused largely on drilling in McKenzie and Dunn counties, Fort Berthold Indian Reservation and other acreage within the southern portion of the Nesson Anticline.
But rising prices, along with the start of the Dakota Access Pipeline and well productivity improvements, have pushed new companies, mainly smaller operators backed by private equity firms, into acreage long ignored by the state's prominent producers.
While NYMEX WTI prices have nearly doubled over the past two years to around $65/b Wednesday, Bakken differentials have also been on the rise, especially over the past year. Bakken at the wellhead has averaged WTI minus $1.43/b so far in January, compared with discounts of close to $5/b back in January 2016, S&P Global Platts data shows.
Better prices have given drillers the opportunity to expand.
"What we would've considered a fringe area a year ago are now considered economic territory in the state of North Dakota," Justin Kringstad, director of the North Dakota Pipeline Authority, said last week during a conference call.
Relatively smaller operators, either unable or unwilling to acquire so-called Tier 1 acreage in the core of the core, are looking at less costly Tier 2 and even Tier 3 areas and considering adding rigs on the outskirts of the Bakken's most prolific plays.
"Their business model is to prove up acreage, drill some great wells, show that the acreage works on a consistent basis and then have some company buy them out," said Jonathan Garrett, director of US upstream research with Wood Mackenzie. "The nature of the beast is not to really ramp up it's just to show that the acreage works consistently."
The move by smaller operators could shift the Bakken away from its recent trend favoring high grading amid relatively low prices, but may lower the state's overall production rate per well, as less prolific wells get drilled.
State officials expect operators to add as many as 10 new rigs in 2018 and the amount of new acreage being considered is growing, according to a new analysis by Kringstad's agency.
"We should expect to see those rigs start to move outward," said Kringstad.
Producers are eyeing roughly 44% more Bakken acreage than they were a year ago, but output in the play will be less prolific than recently seen as operators shift to lower output wells outside of the core drilling area, according to Kringstad's analysis.
Climbing prices are expected to increase both the Bakken's rig and well count as tracts ignored by operators when prices were lower, but the new wells will have an initial production rate roughly 200 b/d below the wells with minimal initial output sought by producers amid lower prices.
Essentially, operators will likely produce from more wells, but the rate of growth could actually slow.
"As prices have risen they're able to move to portions of the play that aren't capable of these high-producing wells, but they can still produce good wells at the right price point and become economic," Kringstad said.
Kringstad estimates that more than 11,800 square miles within the Bakken offer wells with breakeven prices at current levels, compared with about 8,200 square miles a year ago and less than 5,500 square miles in 2016. While North Dakota is now competing with the Permian in Texas and New Mexico for operator interest, counties within North Dakota are also competing with each other for capital. While Kringstad stressed that higher prices do not guarantee expanded drilling, producers are already moving into new areas, according to Graham Walker, a research data analyst at Petrologica.
"There have been a few recent wells in relatively marginal counties like Golden Valley, so we might expect forays further afield in 2018 rather than the kind of activity levels from before the price collapse," Walker said. But increased prices may not translate into a significant producer migration to frontier areas of the Bakken. "As I understand it, there are still enough locations in core areas that moving out is additive, rather than imperative," Walker said.
IP RATES SEEN DROPPING
And while operators are moving to new areas, the wells they are likely to drill are expected to have a lower initial production rate, according to the North Dakota authority's study. For example, in 2016, operators would not produce wells which average below 900 b/d for peak 30-day production. Operators in 2018 are expected to operate wells with initial production rates as low as 500 b/d, according to the analysis.
Smaller companies looking to drill these less prolific wells outside the Bakken's core may initially get initial production rates which mirror those in Tier 1 acreage, according to Pablo Prudencio, an upstream analyst at Wood Mackenzie.
These smaller, private equity-backed firms are likely to use the same enhanced completions with more water and more proppant than larger, publicly-traded companies operating in the core use as well.
"They've been following the trends," he said.
Taylor Cavey, an energy analyst with Platts Analytics, said growth outside the core could be complicated by new drilling techniques and technologies.
"It's hard to know how a well will perform in areas that haven't been produced using high frac volumes and longer laterals," Cavey said. "Assuming that those techniques lead to higher output, it could mitigate the cost to explore in unknown territory. If you are drilling an area that you are unfamiliar with you will likely spend more on geological and seismic surveying to be sure you know what you're getting into before you drill."
Still, Cavey said there was an increasingly likelihood of more development in the Bakken as operators consider existing acreage amid better economics and higher upside.
"They are running out of proven acreage in the Bakken," Cavey said. "Which isn't to say they won't make further discoveries, but it could take some time."
In a note last month, analysts with Morningstar wrote that fears over that it could take decades for drilling opportunities in the Bakken and other shale plays to be exhausted.
The Bakken is smaller than the Permian and "relatively mature" after years of development, the analysts wrote.
"Even so, we don't expect meaningful productivity declines in the next 10 years," they wrote.
And, the core acreage will ultimately remain the most prolific, according to Wood Mackenzie's Prudencio.
"The geologic difference between Tier 1 and Tier 2 is going to remain," Prudencio said. "Even if we're now seeing these new enhanced completions in Tier 2, Tier 1 will remain better because of the geology."
LINKY
Alfred Tennyson wrote:We are not now that strength which in old days
Moved earth and heaven, that which we are, we are;
One equal temper of heroic hearts,
Made weak by time and fate, but strong in will
To strive, to seek, to find, and not to yield.
-

Tanada - Site Admin

- Posts: 17063
- Joined: Thu 28 Apr 2005, 03:00:00
- Location: South West shore Lake Erie, OH, USA
Re: THE Bakken Thread pt 3 (merged)
![]() by Tanada » Tue 30 Jan 2018, 13:15:46
by Tanada » Tue 30 Jan 2018, 13:15:46
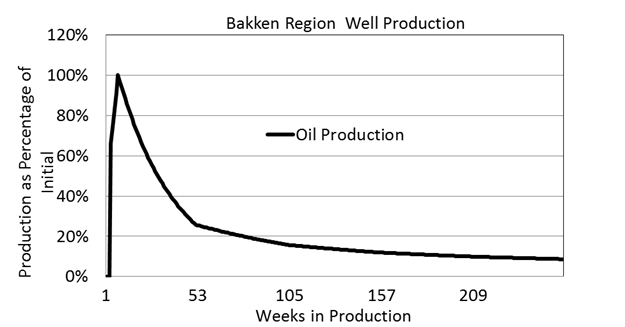
This graph goes out just five years and shows a very slow decline rate the fifth year. Now that Bakken drilling has been ongoing for eight years does anyone have a longer graph showing actual decline rates for years 6,7,8? A lot of folks are banking on the idea that the 10% production rate will more or less continue for a decade or longer, but given how long the current technology has been in use we do not have empirical data to back that up. Data for 6,7,8th year for the earliest wells however should provide a glimmer as to how realistic those hopes may be.
I ask because a recent interview I heard was firmly along the lines that while the 10% total fluids metric was more or less accurate the water cut starting in year 5 started making up a substantial fraction of that total. The implication being that by year 15 the water cut would be the majority of the flow and only stripper operators with cheap disposal wells for the water would still keep those wells flowing.
There has been little real talk about the Bakken and other shale formations for the last two years, I really think with prices back up we need to start paying closer attention again. The technically recoverable Bakken estimates are a broad range of values from as little as 3 Gbbl to 25 Gbbl. EIA stats show the formation has averaged 1 MM/bbl/d or more since January 2014 on an annualized basis. That gives a production in the last four years of 1.5+ Gbbl. If the low estimate is correct and ultimate commercial recover is 3 Gbbl then Bakken is halfway done now.
The only way to project is to have as much info as possible, which is why I am seeking information on just how long the productive tail on these wells actually is. Anyone can claim anything in a press release, and you can get away with using the rosiest plausible numbers in a stockholder meeting up to a point, but actual data should be able to confirm or disprove those projections to a large extent.
The Media has a tendency to accept a press release without question even when that info is for the very best wells a company owns and not the average across all their producing wells. If companies can find or create stripper companies to take the older wells off their hands that can also make their production look better by raising the average.
What I mean is, say company U drills, completes and produces a lot of wells in the Bakken. Then they create a subsidiary company W. When a well comes in with its high production they get pay back for the investment we are told in the first two years of production (at least that is what I have heard) then from years 3,4,5 they get profit taking because the well is paid off even though the production is 15% of initial and falling. In year 6 they 'sell' the well to their subsidiary/stripper division and that unit keeps producing for as long as possible. Company U gets the low production rate well off of their books making their portfolio of wells look more productive on average and letting them draw in investors, sell stocks, or both. How long company W actually keeps the legacy well producing will depend on total flow and water cut and the expenses involved in disposal, price of crude and so on, and so on.
Alfred Tennyson wrote:We are not now that strength which in old days
Moved earth and heaven, that which we are, we are;
One equal temper of heroic hearts,
Made weak by time and fate, but strong in will
To strive, to seek, to find, and not to yield.
-
Tanada - Site Admin
- Posts: 17063
- Joined: Thu 28 Apr 2005, 03:00:00
- Location: South West shore Lake Erie, OH, USA
Re: THE Bakken Thread pt 3 (merged)
![]() by Tanada » Tue 30 Jan 2018, 14:04:06
by Tanada » Tue 30 Jan 2018, 14:04:06
Take a look at this link, scroll down to the columns of data. EIA Bakken Data
Note that after the 1980's boom times the production fell off about 20% and settled in a band averaging 90,000/bbl/d from 1992 through 2004.
As prices climbed in 2005 conventional drilling picked back up to levels seen in the early 1980's and so did production, doubling from January 2005 at 90,000 bbl to January 2009 at 187,000/bbl well over the 1984 boom level of 148,000 bbl. In 2009 horizontal wells with multi stage fracking were the "new thing" in the Bakken and by June 2011 production had doubled again to 384,000/bbl/d. From there the next doubling was February 2013 with 778,000/bbl/d.
Here is where it gets interesting, Bakken production went up massively from January 2009 to February 2013 increasing 525% in those four years. In that last doubling already discussed production climbed 394,000/bbl/d in 19 months, an average increase over the period of 20,000 a month. From February 2013 production continued to rise supported by the persistent high oil prices and peaked 22 months later in December 2014 at 1,221,000/bbl/d. This is an astounding increase of another 443,000 bbl in those 22 months, continuing the growth rate of 20,000/bbl/d right up until the KSA announcement that they were going to defend market share instead of prices. Drilling slowed down massively in the second half of 2015, however after a small initial drop of about 5% the Bakken formation held relatively steady through 2015 before dropping another 15% in 2016. This lead to the lowest production in two years with December 2016 "only" producing 940,000/bbl/d from the Bakken. As prices worked their way up over the course of 2017 however production started picking back up and as of October 2017 (the latest official numbers) Bakken was at 1,164,000/bbl/d where production was in late 2014 right before the past peak. In all likelihood Bakken in January 2018 has beaten that 2014 peak with a new record. Now the question is, just how much higher can the Bakken go before geological peak (instead of price peak) stalls out its increases? Growth from January to February 2017 was quite remarkable at 45,000/bbl/d but after that the numbers stayed relatively flat from February through July 2017. Substantial growth in that baseline took place in August-October of 130,000 in three months or 32,500 a month, but part of this was from completions of back logged wells because oil prices were relatively high and appeared to be on an upward trend. At that rate the backlog of DUC wells will get used up soon enough, the same way storage levels of crude have been falling with the price rise.
Pops used to post the DUC stats but I can't seem to find it, does anyone have a handy link to the current levels?
Alfred Tennyson wrote:We are not now that strength which in old days
Moved earth and heaven, that which we are, we are;
One equal temper of heroic hearts,
Made weak by time and fate, but strong in will
To strive, to seek, to find, and not to yield.
-
Tanada - Site Admin
- Posts: 17063
- Joined: Thu 28 Apr 2005, 03:00:00
- Location: South West shore Lake Erie, OH, USA
Re: THE Bakken Thread pt 3 (merged)
![]() by AdamB » Tue 30 Jan 2018, 17:03:18
by AdamB » Tue 30 Jan 2018, 17:03:18
Tanada wrote:
This graph goes out just five years and shows a very slow decline rate the fifth year. Now that Bakken drilling has been ongoing for eight years does anyone have a longer graph showing actual decline rates for years 6,7,8?
The USGS put out their graphs on sub-units within the Bakken across 10 years. Figures 5-6-7-8.
They didn't do it as percentages, and the resolution looks monthly. The one you show from seekingalpha looks terribly linear across months, when production decline usually isn't.
Tanada wrote: A lot of folks are banking on the idea that the 10% production rate will more or less continue for a decade or longer, but given how long the current technology has been in use we do not have empirical data to back that up. Data for 6,7,8th year for the earliest wells however should provide a glimmer as to how realistic those hopes may be.
Decline rates tend to stabilize in the tails, and I've only seen one analysis of this before, at a PTTC conference in Morgantown, back in 2011. Someone had compared tail stabilization rates across plays, turns out quite a few kicked over into an exponential decline of between 5-12% at some point in time, and they had plotted it so you could see when. Initially, month over month rates can be quite high, which tends to be where the doomer focus goes.
Tanada wrote:I ask because a recent interview I heard was firmly along the lines that while the 10% total fluids metric was more or less accurate the water cut starting in year 5 started making up a substantial fraction of that total. The implication being that by year 15 the water cut would be the majority of the flow and only stripper operators with cheap disposal wells for the water would still keep those wells flowing.
Water cut doesn't tend to change in wells in resource plays. It is higher earlier because of frack flowback water, but you can see that effect dropping out after about 2 years. Then you are talking about produced formation waters.
Tanada wrote:What I mean is, say company U drills, completes and produces a lot of wells in the Bakken. Then they create a subsidiary company W. When a well comes in with its high production they get pay back for the investment we are told in the first two years of production (at least that is what I have heard) then from years 3,4,5 they get profit taking because the well is paid off even though the production is 15% of initial and falling. In year 6 they 'sell' the well to their subsidiary/stripper division and that unit keeps producing for as long as possible. Company U gets the low production rate well off of their books making their portfolio of wells look more productive on average and letting them draw in investors, sell stocks, or both. How long company W actually keeps the legacy well producing will depend on total flow and water cut and the expenses involved in disposal, price of crude and so on, and so on.
I am familiar with the process you describe, and have been part of it on multiple occasions. And it isn't just about a company forming a subsidiary...bankruptcies work in a similar fashion. Wash away the debt load of the original CapX expenditure from Company A, Company B acquires it for pennies on the dollar in a downturn, makes a mint during the next commodity cycle. As part of a growing company post-86, this was exactly the means of growth. Purchases from companies that were about to go under, and those that had, in which case we acquired them through bankruptcy. Didn't drill a single well on the acreage either, just wanted the existing production.
Plant Thu 27 Jul 2023 "Personally I think the IEA is exactly right when they predict peak oil in the 2020s, especially because it matches my own predictions."
Plant Wed 11 Apr 2007 "I think Deffeyes might have nailed it, and we are just past the overall peak in oil production. (Thanksgiving 2005)"
Plant Wed 11 Apr 2007 "I think Deffeyes might have nailed it, and we are just past the overall peak in oil production. (Thanksgiving 2005)"
-

AdamB - Volunteer

- Posts: 9292
- Joined: Mon 28 Dec 2015, 17:10:26
Re: THE Bakken Thread pt 3 (merged)
![]() by Plantagenet » Tue 30 Jan 2018, 19:24:12
by Plantagenet » Tue 30 Jan 2018, 19:24:12
Bakken Oil production climbed back up to 1.185 million bbls/day for Oct. 2017.
bakken-oil-production-rising-in-north-dakota]
Thats very close to the prior peak of 1.26 million bbls/day hit in Dec. 2014.
It will be interesting to see how much higher it can go in response to this current run-up in oil prices....
Cheers!
bakken-oil-production-rising-in-north-dakota]
Thats very close to the prior peak of 1.26 million bbls/day hit in Dec. 2014.
It will be interesting to see how much higher it can go in response to this current run-up in oil prices....
Cheers!
Never underestimate the ability of Joe Biden to f#@% things up---Barack Obama
-----------------------------------------------------------
Keep running between the raindrops.
-----------------------------------------------------------
Keep running between the raindrops.
-

Plantagenet - Expert

- Posts: 26651
- Joined: Mon 09 Apr 2007, 03:00:00
- Location: Alaska (its much bigger than Texas).
Re: THE Bakken Thread pt 3 (merged)
![]() by Subjectivist » Wed 31 Jan 2018, 02:45:14
by Subjectivist » Wed 31 Jan 2018, 02:45:14
II Chronicles 7:14 if my people, who are called by my name, will humble themselves and pray and seek my face and turn from their wicked ways, then I will hear from heaven, and I will forgive their sin and will heal their land.
- Subjectivist
- Volunteer
- Posts: 4704
- Joined: Sat 28 Aug 2010, 07:38:26
- Location: Northwest Ohio
Re: THE Bakken Thread pt 3 (merged)
![]() by Tanada » Sun 03 Feb 2019, 18:50:27
by Tanada » Sun 03 Feb 2019, 18:50:27
Scott Skokos, executive director of the Dakota Resource Council, testified Friday in support of a bill that seeks to reduce natural gas flaring by charging taxes and royalties on flared gas.
TOM STROMME, TRIBUNE
Study reveals benefits, impacts of Bakken oil, gas taxes to ND
The North Dakota Petroleum Council (NDPC) and the Western Dakota Energy Association (WDEA) have released the results of a North Dakota oil and gas tax revenue study jointly sponsored by the energy-based organizations. The purpose of the study was to review the oil and gas extraction and gross production tax collections by the state of North Dakota, from 2008 to 2018, and to detail where and how that funding has been used. The study breaks down the revenue distribution by the programs and political subdivisions receiving the funds and tracks how the revenues have been used through different state funds and distributions authorized by the legislature.
From 2008 to 2018, oil and gas extraction and production taxes have raised almost $18 billion for the state, which accounts for almost 44 percent of total tax revenues collected by the state during that period. Over the last five years alone, oil and gas extraction and production taxes accounted for more than 50 percent of all tax revenues collected by the state. “We thought it was important to compile this data and push this information out to the public,” said Ron Ness, president of NDPC. “We hope it is useful to our state legislators currently considering the state budget and spending levels for the next biennium.”
“The oil industry benefits the entire state, not just the west,” said Geoff Simon, executive director of WDEA. “We are excited to share this information, so people have a clear picture of how their government services are being funded.”
“We appreciate the efforts of the NDPC and WDEA in compiling this information,” said Rich Wardner, North Dakota’s senate majority leader. “During the legislative session, as we debate tax and spending bills, this information will be critical in ensuring lawmakers have a full understanding of where tax revenues are coming from and where they are being spent.”
This report is a compilation of publicly available tax collection data conducted by Brent Bogar of Jadestone Consulting. Copies of this report have been delivered to all state legislators and it will be made available on the WDEA website at taxstudy.ndenergy.org.
Link
Alfred Tennyson wrote:We are not now that strength which in old days
Moved earth and heaven, that which we are, we are;
One equal temper of heroic hearts,
Made weak by time and fate, but strong in will
To strive, to seek, to find, and not to yield.
-
Tanada - Site Admin
- Posts: 17063
- Joined: Thu 28 Apr 2005, 03:00:00
- Location: South West shore Lake Erie, OH, USA
Re: THE Bakken Thread pt 3 (merged)
![]() by AdamB » Sun 03 Feb 2019, 21:18:39
by AdamB » Sun 03 Feb 2019, 21:18:39
Subjectivist wrote:Not so fast, how much is real and how much is a shell game?
https://youtu.be/gWC5SJjBdqc
An hour long video of Art Berman..doing the same thing Art Berman always does. Do you have any SPECIFIC claims from him pontificating for an hour that are worthy of discussion? Because when you just present an hour long "Art being Art" video he'll have his usual claims in there, and it really isn't worth taking each one apart individually. So..any in particular you like?
Plant Thu 27 Jul 2023 "Personally I think the IEA is exactly right when they predict peak oil in the 2020s, especially because it matches my own predictions."
Plant Wed 11 Apr 2007 "I think Deffeyes might have nailed it, and we are just past the overall peak in oil production. (Thanksgiving 2005)"
Plant Wed 11 Apr 2007 "I think Deffeyes might have nailed it, and we are just past the overall peak in oil production. (Thanksgiving 2005)"
-
AdamB - Volunteer
- Posts: 9292
- Joined: Mon 28 Dec 2015, 17:10:26
Re: THE Bakken Thread pt 3 (merged)
![]() by Tanada » Tue 11 Aug 2020, 21:48:38
by Tanada » Tue 11 Aug 2020, 21:48:38
Pipeline doubts put Bakken shale reboot on hold
July 29 (Reuters) - North Dakota oil producers face new pressures to delay bringing back more of their recently curbed output after a U.S. court ruling this month put in jeopardy the pipeline that transports most of the region's oil, executives and analysts said.
Oil producers in the Bakken, the second largest U.S. shale field, cut May output by about 500,000 barrels per day (bpd) after U.S. prices tumbled in March on the heels of global coronavirus shutdowns.
They were slowly restarting some wells when the court ruled the region's main pipeline must face a new environmental review that could halt its operation for a year.
An appeals court has allowed Energy Transfer LP's Dakota Access Pipeline (DAPL) to continue operating for now, but the threat of closure makes reversing cutbacks and drilling new wells too risky, executives and analysts say.
DAPL links Bakken producers to Midwest and Gulf of Mexico customers, accounting for about 40% of volumes transported. Rail transport, which is $3 to $6 a barrel more expensive, is expected to expand if the pipeline closes.
Hess Corp, which has about 55,000 bpd of transportation on DAPL, said on Wednesday it can move all its Bakken output if the pipeline was shut, but that it would cost a few more dollars per barrel.
Continental Resources Inc, a top Bakken producer, did not respond to a request for comment, while rival Marathon Oil Corp declined to comment.
Producers will not be willing to commit to restarting closed wells or drilling news ones "unless they know more" on the pipeline's future, said Nicholas O'Grady, chief executive officer at Northern Oil and Gas Inc, which has invested in about 7,000 wells in North Dakota's Williston Basin.
NOG is factoring the impact of a DAPL shutdown into its spending plans for new wells and acquisitions, he said.
Nationally, U.S. shale producers have revived as much as half of the production they cut in May. In the Bakken, only a fifth of 510,000 barrels per day cut were back on line last month, according to North Dakota state figures.
The current per barrel price <BAK-> of $40.14 is below the $46.54 that Deutsche Bank analysts estimate Bakken producers need to break even on new wells even before additional rail costs are factored in.
Publicly traded oil companies plan to spend about $3.1 billion in Bakken this year, down from $7.5 billion in 2019, according to analytics firm Rystad Energy.
"Right now, we just don't have all the information. We are in a holding pattern," said J.R. Reger, whose company Iron Oil suspended drilling and completing new Bakken wells in March.
ONEOK Inc, which owns natural gas pipelines in the Williston basin, said on Tuesday it expects 2020 earnings at the lower end of its previous guidance. A possible shutdown of DAPL is expected to hurt gas takeaway and output as it is mainly a byproduct of oil production.
(Reporting by Taru Jain and Arathy S Nair in Bengaluru; Additional reporting by Subrat Patnaik; Editing by Gary McWilliams, Patrick Graham and Maju Samuel)
LINKY
Alfred Tennyson wrote:We are not now that strength which in old days
Moved earth and heaven, that which we are, we are;
One equal temper of heroic hearts,
Made weak by time and fate, but strong in will
To strive, to seek, to find, and not to yield.
-
Tanada - Site Admin
- Posts: 17063
- Joined: Thu 28 Apr 2005, 03:00:00
- Location: South West shore Lake Erie, OH, USA
Re: THE Bakken Thread pt 3 (merged)
![]() by Tanada » Tue 30 Nov 2021, 23:26:57
by Tanada » Tue 30 Nov 2021, 23:26:57
Bakken Shale natural gas flaring reaches historical low as production climbs
Natural gas flaring in North Dakota’s Bakken Shale has reached a new record low, according to state data, and new infrastructure slated to enter service soon could push gas production in the play above pre-pandemic volumes.
Flaring of associated natural gas produced in North Dakota’s Bakken has fallen to 6%, according to the latest data released by the North Dakota Industrial Commission. Gross gas production in the state has now crossed 3 Bcf/d, only about 100 MMcf/d of the all-time high reached in November 2019. The state’s oil production, however, is at 1.1 million b/d, which is 400,000 b/d below the all-time high, also reached in November 2019.
The impending completion of WBI Energy Transmission’s North Bakken Expansion natural gas pipeline project is likely to increase the Bakken’s ability push more gas to Northern Border Pipeline for ultimate delivery downstream in the Midwest.
While the project will increase access to prolific Williston Basin production, it could also reduce flaring. Once the expansion is completed, a milestone the company anticipates in December, the added takeaway could be put to the test as production spikes in the region.
Construction is already well underway on the 92.5-mile, 250 MMcf/d project in the northwest corner of North Dakota after the Federal Energy Regulatory Commission approved the project June 1. According to WBI Energy Transmission’s company website, facilities are expected to go into service sometime in December. The proposed route runs through McKenzie County, which produced over 1.44 Bcf/d in summer 2021, up from 1.18 Bcf/d the summer prior, according to S&P Global Platts Analytics.
The WBI system plays a vital role for the Williston Basin in bringing much of the play’s gas to market in the Midwest. This past summer, WBI carried 1.07 Bcf/d in total to other interconnecting pipelines, of which nearly 1 Bcf/d was put on Northern Border. Northern Border generally runs at or near capacity and is essentially the only outlet for Bakken gas. Bakken volumes typically price off AECO and compete for line space with Western Canadian supply heading east along Northern Border.
At 1 Bcf/d this summer, WBI deliveries to Northern Border were up more than 140 MMcf/d from summer 2020 at an all-time high. WBI deliveries accounted for 56% of the Bakken supply pumped on Northern Border, according to Platts Analytics.
This increase supported Bakken gas in gaining even more Northern Border space. Bakken averaged a summer record 74% share of the space on Northern Border, up two points from summer 2020.
Considering WBI’s expansion and its route, it is possible Bakken’s share of Northern Border will increase by as much as the added 250 MMcf/d by summer 2022, as production returning from the coronavirus pandemic has been met with an inability to get to a processing plant.
Midsummer flaring in the Bakken was strong, surging to over 8% for the first time since summer 2020 and exceeding the NDIC flaring cap goal of 9% in July, when 10.4% of the production was flared, according to data from the commission. Since then, rig counts in the Bakken have jumped by at least five and are nearing 30 for the first time since April 2020, according to Enverus. WBI’s impending expansion may be driving the recent build in rigs.
Looking to Platts Analytics’ production forecast, Bakken dry gas production is expected to grow to 2.21 Bcf/d in summer 2022 from 2.06 Bcf/d in summer 2021. WBI’s capacity addition will likely play a big role in the takeaway of that production increase.
Source: Platts
LINK
Alfred Tennyson wrote:We are not now that strength which in old days
Moved earth and heaven, that which we are, we are;
One equal temper of heroic hearts,
Made weak by time and fate, but strong in will
To strive, to seek, to find, and not to yield.
-
Tanada - Site Admin
- Posts: 17063
- Joined: Thu 28 Apr 2005, 03:00:00
- Location: South West shore Lake Erie, OH, USA
Re: THE Bakken Thread pt 3 (merged)
![]() by vtsnowedin » Wed 01 Dec 2021, 13:00:57
by vtsnowedin » Wed 01 Dec 2021, 13:00:57
The wasteful flaring of natural gas is something that sets my frugal Vermonter teeth on edge.
Yes I know there are economic reasons the well developers choose to just flair off that gas but we will come to a time when we regret that waste. Then they will leave wells capped until the pipelines needed to collect that gas and move it to processing plants and the market are complete and ready.
It is one thing to discharge CO2 into the air, quite another to do so without doing any useful work in the process.
-

vtsnowedin - Fusion

- Posts: 14897
- Joined: Fri 11 Jul 2008, 03:00:00
Re: THE Bakken Thread pt 3 (merged)
![]() by Tanada » Wed 01 Dec 2021, 13:35:52
by Tanada » Wed 01 Dec 2021, 13:35:52
vtsnowedin wrote:The wasteful flaring of natural gas is something that sets my frugal Vermonter teeth on edge.
Yes I know there are economic reasons the well developers choose to just flair off that gas but we will come to a time when we regret that waste. Then they will leave wells capped until the pipelines needed to collect that gas and move it to processing plants and the market are complete and ready.
It is one thing to discharge CO2 into the air, quite another to do so without doing any useful work in the process.
From what I have read on the North Slope in Alaska they have spent decades reinjecting the excess Natural Gas back into the formation to both conserve the gas and help maintain formation pressure as gas drive for the oil. However in the Bakkan because it is a tight fractured formation I guess they can't simply reinject the gas unless it is into an already depleted well. Because things ramped up so quickly even the 2008 wells are mostly still producing even if at the stripper rate of less than 10 bbl/d.
I grew up lower middle class and seeing huge volumes of energy thrown away as flaring has always bugged the daylights out of me. Criminy, put in a small gas turbine generator rig and provide power to the grid or something, it can't be that hard to figure out a less wasteful solution.
Alfred Tennyson wrote:We are not now that strength which in old days
Moved earth and heaven, that which we are, we are;
One equal temper of heroic hearts,
Made weak by time and fate, but strong in will
To strive, to seek, to find, and not to yield.
-
Tanada - Site Admin
- Posts: 17063
- Joined: Thu 28 Apr 2005, 03:00:00
- Location: South West shore Lake Erie, OH, USA
Re: THE Bakken Thread pt 3 (merged)
![]() by AdamB » Thu 02 Dec 2021, 00:03:58
by AdamB » Thu 02 Dec 2021, 00:03:58
Tanada wrote:I grew up lower middle class and seeing huge volumes of energy thrown away as flaring has always bugged the daylights out of me. Criminy, put in a small gas turbine generator rig and provide power to the grid or something, it can't be that hard to figure out a less wasteful solution.
The rules have recently changed, and they are now collecting most of the gas. Historic lows. New infrastructure has helped as well.
Plant Thu 27 Jul 2023 "Personally I think the IEA is exactly right when they predict peak oil in the 2020s, especially because it matches my own predictions."
Plant Wed 11 Apr 2007 "I think Deffeyes might have nailed it, and we are just past the overall peak in oil production. (Thanksgiving 2005)"
Plant Wed 11 Apr 2007 "I think Deffeyes might have nailed it, and we are just past the overall peak in oil production. (Thanksgiving 2005)"
-
AdamB - Volunteer
- Posts: 9292
- Joined: Mon 28 Dec 2015, 17:10:26
Re: THE Bakken Thread pt 3 (merged)
![]() by ROCKMAN » Sun 05 Dec 2021, 13:48:12
by ROCKMAN » Sun 05 Dec 2021, 13:48:12
A complex discussion if one does not understand the basics. The stats on NG need to note what would have been "associated gas" and "dry gas" production. The associated gas is that low volume/low pressure gas produced with the oil. Dry gas typically refers to higher volume/higher pressure production that may have a small amount to no oil in the production stream. Of course flared gas decreased: oil production decreased. And gas production increased because more NG wells with little or no associated oil were completed. Best not to think of "pipelines" but "gathering systems". And the pipelines in a GS run at a specific pressure. Flared gas at 100 psi can't flow into a GS running at 900 psi. Of course. one can compress the 100 psi gas to 900 psi. But that takes expensive equipment. Even worse you would burn much of the 100 psi gas to run the compressor. Thus uneconomic.
As far as ideas thrown out by armchair engineers feel free to but an investment group together (including your money) and get after it. The companies faring gas will gladly give it to you for free: takes the stink off their backs. LOL. Trust me: if there is a profitable way to sell the gas they would do. I've put equipment on top of oil tanks that gathered a few tens of mcf/day because I had a low pressure gathering system available. So why not put a low pressure GS to take all that flared gas? Same economics: need a lot of pipelines running to each well spaning a large area. And then eventually all that gas gathered still has to be compressed to get it into regional transport pipelines.
BTW: much the same answer for making electricity: burn much of the gas to run the generators and a lot of gathering lines to connect each well to the grid. Again the gas is there free to anyone that wants to make the investment. Including the state and the feds.
-
ROCKMAN - Expert
- Posts: 11397
- Joined: Tue 27 May 2008, 03:00:00
- Location: TEXAS
Re: THE Bakken Thread pt 3 (merged)
![]() by Sicario » Thu 10 Nov 2022, 16:09:31
by Sicario » Thu 10 Nov 2022, 16:09:31
Hello folks.
Would anyone care to provide any updates with respect to the Bakken?
Would anyone care to provide any updates with respect to the Bakken?
- Sicario
- Wood
- Posts: 6
- Joined: Thu 03 Nov 2022, 22:51:54
Return to North America Discussion
Who is online
Users browsing this forum: No registered users and 11 guests