I thought it might be useful to review some of the issues surrounding future reserve assessment, especially given the fact that so many here have obviously read Campbell and Laherre’s various discussions. This is a very important issue to my mind, as what view you take might make the difference in the real peak by several decades. If you’ve seen this before just hit the BACK button.
There is a USGS Open File report (03-137) by Ronald Charpentier that talks a bit about the different methodologies and some of the problems associated with each. I believe that M. Lynch has talked in general terms about this issue in one of his presentations. Given space constraints I’ll focus on the potential issues around projections from current distributions.
The common method by which the so-called “curve fitters” come up with URR for a basin is by plotting creaming curves. This is simply a plot of cumulative oil discovered (ordinate) versus year (abscissa). The recognition is that in mature basins one sees a relatively steep rise in the curve at some point in time, which is followed by a shallowing and an eventual asymptotic relationship with the year axis. Campbell and Laherre have both used this relationship to forecast potential URR in basins at a given point in time. The belief that this is a valid method requires the assumption that in all basins the largest oil fields are always discovered first even with random drilling (documented in the literature by Arps and Roberts (1958), AAPG Bulletin, V42, 11, p. 2549-2566). In reality, however, there are a number of factors that often lead to discovery of large fields late in the exploration history of single basins (eg. access, data quality, politics, economics). Charpentier uses the Ghadames/Berkine basin as a good example where there was an early exploration history in the seventies and eighties that discovered relatively small fields, followed by improvements in seismic technology in the nineties and subsequent discovery of several giant fields. Plotting the data indicates a creaming curve approach conducted in 1990 would have missed the potential for the addition of some 5 billion barrels of oil in the mid-nineties.
A very good example of this is seen in creaming curves constructed for the Niger Basin in Nigeria. This is a single geologic basin, albeit with several petroleum systems and playtypes present. The following is a creaming curve created including all data to present (source is the most recent IHS database and thanks to Pete Rose for the plotting routine).
Chart
What is interesting to note is there are several inflection points in the curve. If one were to have attempted creaming curve analysis in the early sixties and seventies, the late eighties or mid-nineties the result would have been a much more pessimistic assessment of URR than was actually achieved. In reality the various steepened portions of the curve represent improvements in technology such that deeper and deeper water depths could be explored efficiently and cost-effectively. The question you now are left with is will the curve remain flat or take another jump? There are a number of other examples of this, including the Michigan basin, Gulf of Mexico etc.
The proper analysis at any given point in time needs to take into account first what the remaining geologic potential is in any given basin, and then what should be reasonably recovered ultimately given the notion that economics and politics will become more favorable with a dwindling resource base. It is for this reason I believe the USGS methodology is a superior way of predicting URR. The issue of course is that the USGS can afford to acquire the large priority databases and spend hundreds of man-hours of exhaustive analysis whereas consultants and small contractors can't.
I’ll follow this up with a related discussion on probabilistic distribution of field size as a predictive tool and the associated pitfalls.

PeakOil is You
Issues with Calculating undiscovered reserves
First unread post • 11 posts
• Page 1 of 1
Issues with Calculating undiscovered reserves
![]() by rockdoc123 » Wed 04 Jan 2006, 18:22:13
by rockdoc123 » Wed 04 Jan 2006, 18:22:13
-

rockdoc123 - Expert

- Posts: 7685
- Joined: Mon 16 May 2005, 03:00:00
Re: Remaining yet to find reserves - issues with calculating
![]() by ReserveGrowthRulz » Wed 04 Jan 2006, 18:38:30
by ReserveGrowthRulz » Wed 04 Jan 2006, 18:38:30
I like your example. I also could be led to believe that it reveals a fundamental flaw in the logic used by the Doomers in discounting any and all other ways which tend to increase ultimate reserves through time. The Campbell argument tends to be that there is no such thing as reserve growth, only bad initial estimates....yet he himself has altered his own ultimate numbers upwards through time, something pointed out by Lynch if I recall correctly.
The interesting paraphrase being "for someone who doesn't believe in reserve growth its interesting to see it in your ( Campbells ) tables for countrywide ultimate estimates".
The interesting paraphrase being "for someone who doesn't believe in reserve growth its interesting to see it in your ( Campbells ) tables for countrywide ultimate estimates".
-

ReserveGrowthRulz - Permanently Banned
- Posts: 813
- Joined: Fri 30 Dec 2005, 04:00:00
Re: Remaining yet to find reserves - issues with calculating
![]() by lardlad » Wed 04 Jan 2006, 21:23:03
by lardlad » Wed 04 Jan 2006, 21:23:03
They're in ultra deep water already on that chart, so where else can they go to get the chart rising in perpetuity? It has to flatten sometime. How much more can they get from improved techniques and deeper drilling? Unanswerable. But that chart was very useful in showing how many fields have hidden reserves that only become apparent over time. It also suggests that ultradoomers are wrong about the imminence of PO.
- lardlad
- Lignite

- Posts: 303
- Joined: Fri 30 Dec 2005, 04:00:00
- Location: USA, Australia and Africa
Re: Issues with Calculating undiscovered reserves
![]() by khebab » Wed 04 Jan 2006, 22:18:46
by khebab » Wed 04 Jan 2006, 22:18:46
Interesting analysis! I was wondering also what was the reliability of the Hubbert linearization method as a way to estimate the URR. In particular, what is the sensitivity of the URR estimate in relation to the discovery pattern. The Hubbert linearization for Nigeria gives the following:
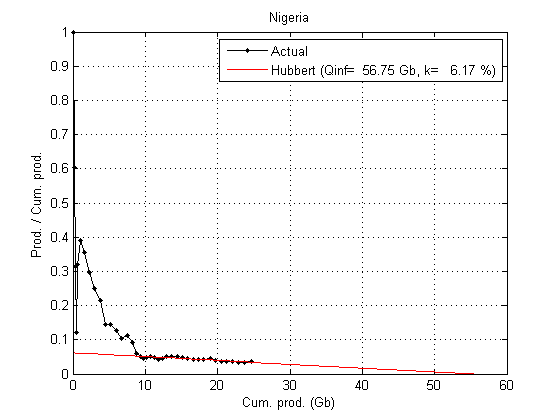
There is a linear trend but it is very flat which implies that the intercept location with the Cumulative production axis may change widely with new points.
There is a linear trend but it is very flat which implies that the intercept location with the Cumulative production axis may change widely with new points.
______________________________________
http://GraphOilogy.blogspot.com
http://GraphOilogy.blogspot.com
- khebab
- Tar Sands

- Posts: 899
- Joined: Mon 27 Sep 2004, 03:00:00
- Location: Canada
Re: Issues with Calculating undiscovered reserves
![]() by ReserveGrowthRulz » Thu 05 Jan 2006, 01:55:50
by ReserveGrowthRulz » Thu 05 Jan 2006, 01:55:50
I read an interesting article testing the statistical certainty of various ways of calculating the ultimate recovery using various Doomer methods and curves, and the part that was interesting was this...for a wide range of possible ultimates, there was little or no statistical difference among the curves to get them, in other words, the statisical certainty of ANY of the outcomes happening was fundamentally the same. There was as much a chance of there being only a little left as there was a chance of being LOTS left.....
Deep water and limiting the thinking on reserves and resources to only what we know today seems WAY more than just a little short sited...particularly considering the past history of reserves ( real reserves, SPE definition, not a catchall for whatever a Doomer might want to lump in there ) which have maintained a pretty steady "inventory" if you will over the last half century or so, excluding those who might be tempted to "goose" their numbers, let alone allow anyone to check them. The example I'm thinking of is Mr. Simmons constantly after the Saudi's, or any other national company for that matter who have reasons for their reserve numbers besides what is actually in the ground.
Deep water and limiting the thinking on reserves and resources to only what we know today seems WAY more than just a little short sited...particularly considering the past history of reserves ( real reserves, SPE definition, not a catchall for whatever a Doomer might want to lump in there ) which have maintained a pretty steady "inventory" if you will over the last half century or so, excluding those who might be tempted to "goose" their numbers, let alone allow anyone to check them. The example I'm thinking of is Mr. Simmons constantly after the Saudi's, or any other national company for that matter who have reasons for their reserve numbers besides what is actually in the ground.
-
ReserveGrowthRulz - Permanently Banned
- Posts: 813
- Joined: Fri 30 Dec 2005, 04:00:00
Re: Issues with Calculating undiscovered reserves
![]() by rockdoc123 » Thu 05 Jan 2006, 11:16:00
by rockdoc123 » Thu 05 Jan 2006, 11:16:00
I thought creaming curves were wildcats vs. production?
Actually there are several types...the one you refer to is the method Laherre uses ....it works well in basins with a lot of production history and no political/economic issues that stopped a steady flow of exploration and development (eg. North Sea the analysis works well but in 1990 would have missed the second bump in production and reserves). The type I show is one method that has been around as long as I can remember...I used it simply because it is easy to plot it up using Pete Roses handy dandy software. The classic method published by some of the Shell folks years ago plots cummulative discovery versus number of new field wildcats and can be used in the same manner as the one I show.
They're in ultra deep water already on that chart, so where else can they go to get the chart rising in perpetuity?
Ah....the other issue I forgot to mention about strictly using curve analysis without making sure you understand the subsurface and other factors that are affecting the progress of exploration and appraisal is that you can be fooled unless you realize where each datapoint is coming from. As I mentioned the plot I showed includes the entirety of the Niger basin of Nigeria including the swamp, deepwater and ultradeep water. Exploration has been progressing in all areas in parallel ....as a consequence you could see big fields being discovered in the ultradeep water at the same time as very small fields are being discovered in the swamp areas. The economics are different and the two areas attract different types of companies...big players in the deepwater and little tiny local companies in the swamp areas. As a consequence the creaming curve could look like it has hit a final inflection point but is actually just illustrating that the last ultradeep water discovery was followed by a few very small discoveries in the shallow swampy areas. In actual fact the exploration in the ultradeep water in the Niger delta has stalled somewhat in the last year of so given that there are a few fields that still need to get approvals to come on stream. Nigeria is a complicated place in terms of contractual issues and companies like Shell, Exxon and Total struggle with this all of the time. There are still a few block in the "near" ultradeep water (1500m to 2000m water depth) that have not been drilled and as far as I know no drilling has occurred beyond the 2500m water depth (technology for tension leg platforms still not there yet?). There are geologic issues that limit how much more can be found in the area.....Tertiary sand distribution, the limit of the toe thrust structures, maturation windows for source rocks etc. so it is definitely not unlimited but I think there is still some upside. Interestingly enough the exact same geology is present in SaoTome (immediately adjacent Nigeria) and there was quite a bidding war for this acreage a year ago...no drilling has occurred as yet but the chance of a least a couple giant (>500MMB) discoveries is pretty good.
-
rockdoc123 - Expert
- Posts: 7685
- Joined: Mon 16 May 2005, 03:00:00
Re: Issues with Calculating undiscovered reserves
![]() by rockdoc123 » Thu 05 Jan 2006, 18:09:51
by rockdoc123 » Thu 05 Jan 2006, 18:09:51
OK….let’s look at another very interesting example where I think it is safe to say that the pace of exploration has been affected by issues outside of subsurface geology….the Sudan. As a quick background for those not familiar Sudan exploration history got it’s first shot in the arm in the eighties with significant discoveries in the Muglad basin in south-central Sudan by Chevron. They drilled for a number of years but left the country in the early ninties as a consequence of political and economic factors. In the nineties exploration in the Muglad commenced again but not without political influence. The northern portion of the Muglad ended up being fairly heavily explored with good success from the early ninties through to present. Looking at the creaming curve for the Muglad through to present we see what is starting to look like a relatively mature basin with mostly small discoveries remaining.

In general it is recognized that field sizes in a given basin and usually in a series of basins will fall on a lognormal distribution. The field size distribution for the Muglad looks like this:

From this plot we see there is only a ten percent chance of encountering a field size larger than 70 MMB and a less than 1% chance of finding something larger than 400 MMB…this of course being based on the database at that time. An adjacent, geographically separate but geologically analogous basin, the Mellut had seen some early drilling by Chevron with limited success. Because it is directly analogous it makes good sense to believe the reserve size distribution should also be similar….hence we would predict that any wells drilled would tend to encounter the mean size of about 25 MMB. On the contrary when the basin was revisited in 2003 by CNPC, they encountered a 600 MMB pool. Note that this pool size falls outside of the whole of the Muglad distribution and one would have given a zero percent chance a field of this size could be encountered based solely on Muglad data. The issue here seems to be that due to a slight change in lithology the Mellut ends up having much greater sealing capacity than the Muglad. The new creaming curve is interesting and illustrates that the Mellut may still hold some significant reserves:

Another way of looking at upside potential in basins is to look at Exploration Efficiency. Basically cumulative reserves are plotted first as if the largest was discovered first and the smallest last (100% efficiency….what we would all strive to do) and then as it actually happened. An example of an Exploration Efficiency plot for Sudan is:

This illustrates that the exploration of Sudan to this point in time has been about 95% inefficient (pretty much exactly what we do not want to strive for), this of course being due mainly to issues other than subsurface geology. If we compare this to Nigeria (which we looked at before):

We see the exploration efficiency in Nigeria is about 50%, which isn’t too bad. Some workers like to use exploration efficiency as a means of determining what upside a basin might have….this would suggest Sudan has a fair bit of upside in comparison to Nigeria from an exploration maturation standpoint.
So again an interesting look at how you can be fooled by the dataset you have in hand being incomplete. The lesson learned here is that curve fitting is great but you need to ground truth your analysis with an understanding of what is and what is not possible in the subsurface. Interestingly enough the USGS did not consider the cratonic basins of Sudan in it’s 2000 resource assessment.
In general it is recognized that field sizes in a given basin and usually in a series of basins will fall on a lognormal distribution. The field size distribution for the Muglad looks like this:
From this plot we see there is only a ten percent chance of encountering a field size larger than 70 MMB and a less than 1% chance of finding something larger than 400 MMB…this of course being based on the database at that time. An adjacent, geographically separate but geologically analogous basin, the Mellut had seen some early drilling by Chevron with limited success. Because it is directly analogous it makes good sense to believe the reserve size distribution should also be similar….hence we would predict that any wells drilled would tend to encounter the mean size of about 25 MMB. On the contrary when the basin was revisited in 2003 by CNPC, they encountered a 600 MMB pool. Note that this pool size falls outside of the whole of the Muglad distribution and one would have given a zero percent chance a field of this size could be encountered based solely on Muglad data. The issue here seems to be that due to a slight change in lithology the Mellut ends up having much greater sealing capacity than the Muglad. The new creaming curve is interesting and illustrates that the Mellut may still hold some significant reserves:
Another way of looking at upside potential in basins is to look at Exploration Efficiency. Basically cumulative reserves are plotted first as if the largest was discovered first and the smallest last (100% efficiency….what we would all strive to do) and then as it actually happened. An example of an Exploration Efficiency plot for Sudan is:
This illustrates that the exploration of Sudan to this point in time has been about 95% inefficient (pretty much exactly what we do not want to strive for), this of course being due mainly to issues other than subsurface geology. If we compare this to Nigeria (which we looked at before):
We see the exploration efficiency in Nigeria is about 50%, which isn’t too bad. Some workers like to use exploration efficiency as a means of determining what upside a basin might have….this would suggest Sudan has a fair bit of upside in comparison to Nigeria from an exploration maturation standpoint.
So again an interesting look at how you can be fooled by the dataset you have in hand being incomplete. The lesson learned here is that curve fitting is great but you need to ground truth your analysis with an understanding of what is and what is not possible in the subsurface. Interestingly enough the USGS did not consider the cratonic basins of Sudan in it’s 2000 resource assessment.
-
rockdoc123 - Expert
- Posts: 7685
- Joined: Mon 16 May 2005, 03:00:00
Re: Issues with Calculating undiscovered reserves
![]() by AdamB » Sun 01 Oct 2017, 23:24:29
by AdamB » Sun 01 Oct 2017, 23:24:29
Found this gem from the wayback machine, and basedon Pstarrs recent fascination with nothing he knows anything about, thought it would be interesting to watch him vibrate until he exploded over the basics of undiscovered. I also thought it interesting that Mr Reserve shows up in this thread, and understands more than his past statements spotting shale gas and oil as a game changer, and am wondering yet again why he was banned? Haven't seen him falling for all the hair brained doomer ideas that were laid out like a bread trail for the gullible that was happening way back when, so maybe he was an easy mark for not falling for herd think? Anyway, it should be noted that Ron, referenced by Rocdoc as the author of a decidedly interesting USGS report on a topic all peakers should be familiar with, has since retired (a permanent fixture for decades at the USGS booth at AAPG national conferences and sorely missed for an hour long conversation each and every year).
The reason why this matters, is because rocdocs explanation is completely reasonable, was demonstrated by the experts at the IEW that they are also familiar with such basics, and the etp'ers don't have a clue about even this most basic aspect of undiscovered resources and the methods involved in estimating them, let alone using the appropriate statistical methods to do work even remotely similar. The folks at the IEW did however...another reason why the ETPers won't get within a mile of such folks. But hey, THERE they are!

The reason why this matters, is because rocdocs explanation is completely reasonable, was demonstrated by the experts at the IEW that they are also familiar with such basics, and the etp'ers don't have a clue about even this most basic aspect of undiscovered resources and the methods involved in estimating them, let alone using the appropriate statistical methods to do work even remotely similar. The folks at the IEW did however...another reason why the ETPers won't get within a mile of such folks. But hey, THERE they are!
Plant Thu 27 Jul 2023 "Personally I think the IEA is exactly right when they predict peak oil in the 2020s, especially because it matches my own predictions."
Plant Wed 11 Apr 2007 "I think Deffeyes might have nailed it, and we are just past the overall peak in oil production. (Thanksgiving 2005)"
Plant Wed 11 Apr 2007 "I think Deffeyes might have nailed it, and we are just past the overall peak in oil production. (Thanksgiving 2005)"
-
AdamB - Volunteer

- Posts: 9292
- Joined: Mon 28 Dec 2015, 17:10:26
Re: Issues with Calculating undiscovered reserves
![]() by ROCKMAN » Tue 03 Oct 2017, 15:39:17
by ROCKMAN » Tue 03 Oct 2017, 15:39:17
A great discussion about reserve growth especially that from our very experienced rocdoc. But: "It also suggests that ultradoomers are wrong about the imminence of PO.". I know some get tired of the reminder but the fact remains: the amount of reserves left to be discovered is not a primary factor in the future global peak oil rate.
Consider for years there was much debate over the actual global production rate and the max that could be delivered. IOW the actual reserve production capacity: current production + RESERVED production. With the decline of oil prices it seemed clear many producers brought much if not most of that RESERVED capacity online. Which indicates that the actual global oil production rates has never been too far below total capacity.
Next I won't take the time to explain the math: you can believe me or not. I've analyzed and projected ultimate recover of countless wells, fields, trends, etc. for more then 40 years. And I've watched numerous peers do the same. And plotting production rate over time has never been as useful as plotting cumulative production over time. The critical aspect of such a curve is from when the linear inclining portion begins to "lay over" and begins an obvious transition to a more horizontal trend. I cannot vouch for the accuracy of the data but here's one such plot:
https://www.researchgate.net/figure/251 ... herrere-15
Feel free to offer any others. The most critical data is the accuracy of the cumulative discovery amount. And it is interesting to see the implicaton of the time lag between cum discovery and cum production. Because this is the key: this web site is devoted to the global peak oil PRODUCTION RATE. Not peak cumulative production, not peak future discover volumes, etc. Not that they aren't related but discerning that relationship
with the global production rate is very difficult.
For instance let's assume the world has as much COMMERCIALLY RECOVERABLE oil in the future as it has already produced. That does not prove we'll maintain the current rate for decades. In fact it wouldn't guarantee we can hold the current rate for very long. It wouldn't even guarantee the max global oil production X decades in the future might be just 75 million bopd...or less. One can analyze 1,000 depleted fields and not find a common relationship between URR and production rate. The CONVENTIONAL field I'm currently redeveloping took many decades to recover 28 million bbls of oil and never produced more then 1,000 bopd. OTOH I've seen CONVENTIONAL fields recover more then that amount in less then 10 years at an average rate many times higher.
Consider that many of the more recent big field discoveries were made in DEEP WATER. Those projects are designed to max production rates and not URR. About 20% of current US production is from wells making 20 bopd or less. You will never see DW wells producing at such low rates...it just not economical.
All which is to say that accurately projecting how much oil the world will be producing daily at any point in the future will NOT be a function of how much commercially recoverable oil is left to find. But that doesn't mean it isn't an interesting exercise. Debate all you want. It just isn't directly related to the subject of this web site: the global production rate of oil over time.
OK here's the closest I could find: cum US oil production thru 2005. Stops right when it should be getting interesting.
https://wattsupwiththat.com/2011/10/27/ ... downslope/
But let's make a rough estimate for the cum added since then:
2006-2010: 9.5 billion bbls = 195 billion bbls cum
2011-2015: 14 billion bbls = 209 billion bbls cum
If someone with the times cares to add the updated cum data have at it. In the mean time just visualize the last data point, 209 billion bbls, plotted at 2015. Notice how little the projection of the curve misses despite the fact we had a huge surge in US oil production. A surge that has fallen back. IOW it would take many years of sustained very high production to significant change the projection on the cum curve over time. This is the point I was trying to make above about the utility of such a curve when analyzing very MATURE production trends: recent (and potentially short) big increases in production rates don't necessarily mean big increases in URR. Many companies selling their MATURE fields will do work overs and/or drill new wells at the last moment to ramp up daily production rates. We actually use agdrm for this we all understand: "seeding". But plotting a large field's cum, including the new production, will give a much more meaningful URR projection.
Probably didn't explain the concept very well. But it is THE most critical aspect the industry uses to analyze MATURE production. What frustrating is how production rate plots dominate such discussions instead on the much more enlightening cum plots.
-
ROCKMAN - Expert
- Posts: 11397
- Joined: Tue 27 May 2008, 03:00:00
- Location: TEXAS
Re: Issues with Calculating undiscovered reserves
![]() by rockdoc123 » Tue 03 Oct 2017, 16:52:47
by rockdoc123 » Tue 03 Oct 2017, 16:52:47
All which is to say that accurately projecting how much oil the world will be producing daily at any point in the future will NOT be a function of how much commercially recoverable oil is left to find. But that doesn't mean it isn't an interesting exercise. Debate all you want. It just isn't directly related to the subject of this web site: the global production rate of oil over time.
given all the uncertainties one has to take the best guess in terms of future production rate. I had a go at it for the world about a decade ago on this site and came up with a peak somewhere around 2015. The problem there was at the time there was no notion of how fast the shale oil industry in the US would develop and some projects such as in Kazakhstan, West Africa, and offshore Brazil saw substantial commissioning delays. That affects both the total value at the peak as well as the shape and timing. Since project financing is dependant on oil price the drop in price in 2008 followed by the return to $100/bbl from 2011 through to 2014 followed by the sudden drop and slow recovery has made project financing even more challenging.
-
rockdoc123 - Expert
- Posts: 7685
- Joined: Mon 16 May 2005, 03:00:00
11 posts
• Page 1 of 1
Who is online
Users browsing this forum: No registered users and 161 guests