In my opinion, it seems likely that 2013 was the eighth year in a row that annual Saudi net oil exports were below their 2005 annual rate of 9.1 mbpd.
Saudi net oil exports 2002 to 2012, total petroleum liquids + other liquids, EIA, mbpd:2002: 7.1
2003: 8.3
2004: 8.6
2005: 9.12006: 8.6
2007: 8.1
2008: 8.8
2009: 7.6
2010: 8.1
2011: 8.3
2012: 8.7
2013: 8.7 to 8.9 (Estimated)The Saudi ECI Ratio (Export Capacity Index, the ratio of production to consumption) fell from 5.7 in 2005 to 4.0 in 2012. Based on a mathematical model, and based on empirical data*, ECI declines like this are associated with very high rates of depletion in the remaining volume of CNE (Cumulative Net Exports). Of course, when a net oil exporting country hits an ECI ratio of 1.0 (production = consumption), net exports are zero.
Saudi ECI Ratio for 2002 to 2012 (extrapolation based on 2005 to 2012 rate of decline):
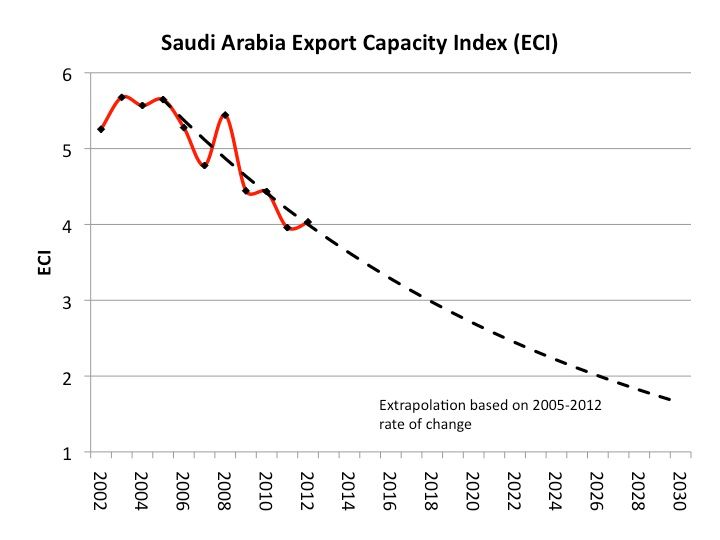
Based on the 2005 to 2012 rate of decline in the Saudi ECI Ratio, I estimate that Saudi post-2005 CNE are about 56 Gb (billion barrels). They shipped about 21 Gb from 2006 to 2012 inclusive, suggesting that they may have already shipped about 38% of their post-2005 CNE, an estimated post-2005 CNE depletion rate of about 7%/year, as production increased at about 0.5%/year from 2005 to 2012.
*Insofar as I know, there were six major net oil exporters (countries with 100,000 bpd or more of net exports) that hit or approached zero net oil exports from 1980 to 2010, excluding China. They are: Indonesia, UK, Egypt, Vietnam, Argentina and Malaysia. Their combined production virtually stopped increasing in 1995, rising only 3% from 1995 to 1998, and as annual net exports fell by 3%. In this three year period from 1995 to 1998, they shipped 40% of their combined post-1995 CNE. So, a 1%/year rate of increase in production corresponded to a 17%/year rate of depletion in post-1995 CNE. Following is a graph showing the normalized Six Country production, ECI ratio, net exports and remaining post-1995 CNE, by year, for 1995 to 2002 (with 1995 values = 100%):
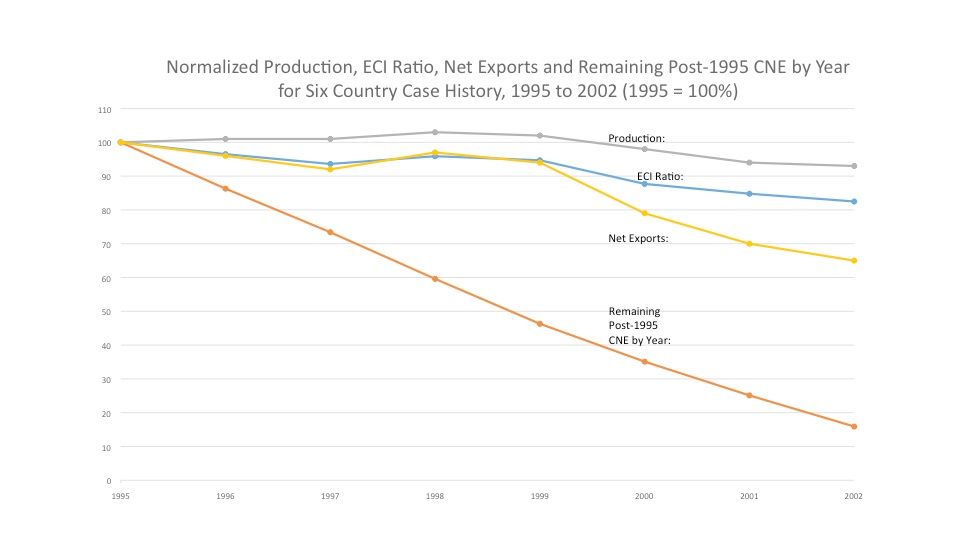
The Six Country ECI ratio fell from 1.7 in 1995 to 1.4 in 2002, and this ECI decline corresponded to an 84% decline in the remaining volume of post-1995 CNE. Note that an extrapolation of the seven year 1995 to 2002 rate of decline in the Six Country ECI ratio suggested that Six Country post-1995 CNE would be about 9 Gb. The actual value was 7.3 Gb.
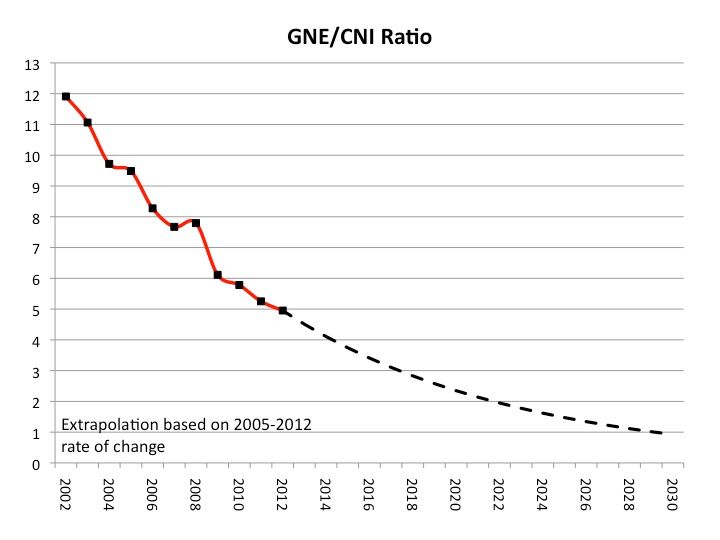
As noted above, the Saudi ECI Ratio fell from 5.7 in 2005 to 4.0 in 2012, and an extrapolation of the seven year 2005 to 2012 rate of decline in the Saudi ECI ratio suggests that their post-2005 CNE will be about 56 Gb, with 21 Gb having been shipped from 2006 to 2012 inclusive, which suggests that Saudi Arabia may have shipped about 38% of post-2005 CNE in the past seven years.
If we look at the Top 33 net oil exporters in 2005, their combined ECI ratio fell from 3.8 in 2005 to 3.3 in 2012, and an extrapolation of the seven year 2005 to 2012 rate of decline in the Top 33 ECI ratio suggests that their post-2005 CNE will be about 530 Gb, with 112 Gb having been shipped from 2006 to 2012 inclusive, which suggests that the (2005) Top 33 net exporters may have shipped about 21% of post-2005 CNE in the past seven years.


