 by Pops » Mon 19 Nov 2012, 14:06:29
I'd not seen US production represented as Hubbert's curve plus discrete curves for "other stuff that burns" -
read the entire post @ Tad Patzek's Life Itself Blog (h/t: TOD)
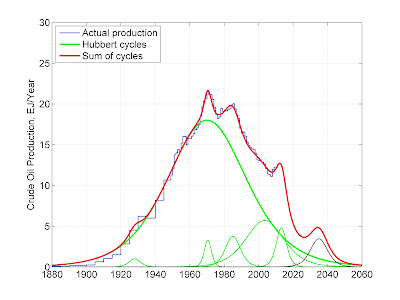
Historic production of crude oil in the U.S. is resolved into several Hubbert curves. The tallest one is the original Hubbert curve published in 1956. The smaller curves starting from 1960 were generated by producing shallow, deep and ultra-deep Gulf of Mexico, Alaska (mostly Prudhoe Bay), and then everything else that was not in the original curve: large waterflood projects, thermal and carbon dioxide enhanced oil recovery (EOR) projects, horizontal wells, hydrofractured wells, etc. The broad curve peaking in 2002 was introduced in late 2002, and the model represented fairly well the U.S. crude oil production until 2010. The last small green curve on the right was introduced last month to describe the Bakken and Eagle Ford shales, as well as the increased production of crude oil from the Permian Basin near Midland, TX. The right-most black curve depicts a hypothetical production of 7 billion barrels of oil from the Arctic Natural Wildlife Refuge (ANWR) in Alaska. So the last point on the blue step-line represents 5.7 MMbopd produced in the U.S. in 2011. This rate is predicted by EIA to grow to over 6 MMbopd in 2012.
The legitimate object of government, is to do for a community of people, whatever they need to have done, but can not do, at all, or can not, so well do, for themselves -- in their separate, and individual capacities.
-- Abraham Lincoln, Fragment on Government (July 1, 1854)


