https://www.skepticalscience.com/Past-a ... e-CO2.html
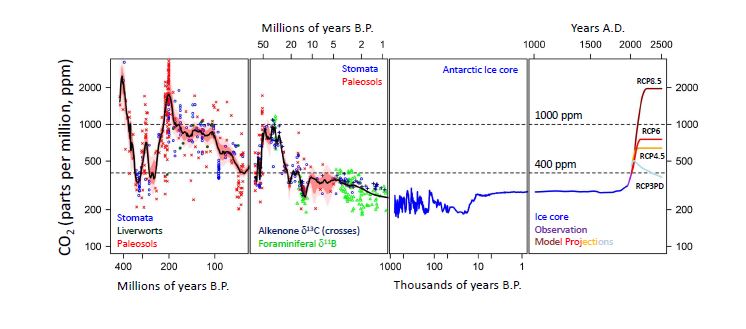
Figure 1: Compilation of available CO2 data for the last 450 million years. For data sources see text. Proxy records are colour coded and labelled in the relevant panel. Greenhouse gas emission scenarios (RCP – Representative Concentration Pathways) used in IPCC AR5 are shown in the right hand panel. Note the variable log scale for time. For the geological data a smoothed line has been fit to the data with an uncertainty accounting for uncertainty in age and CO2. The black line describes the most probable long-term CO2 with 68% confidence limits in red, and 95% confidence in pink.

Figure 2: Climate forcing by changing CO2 and solar output for the last 450 million years. CO2 data and projections are as outlined in Figure 1. Changing solar output calculated as described in Gough et al. (1981; Solar Physics, 74, 21-34) with CO2 forcing from Byrne and Goldblatt (2014; doi: 10.1002/2013GL058456). The red band is the 95% confidence interval around the smoothed line through the published CO2 data.
We're on that highest track, RPC 8.5 (or worse). We are scheduled to soon, in the next few decades, go beyond any level of forcing that has ever been seen in the recorded history of the planet. And at a faster rate than we have ever moved anywhere close to that direction.
And some aver as a certainty that extinction is definitely not possible. No one can know may or may not happen in these contexts--we are wading deep into totally uncharted waters.