US production did not peak in1970. The numbers are clear---1970 was not the all time peak in US oil production---don't you even know that?.
Jesus wept....what part of double peak do you not understand?
Oil production from conventional reservoirs peaked in 1970 as predicted by Hubbert. It wasn't until 35 years later that technological improvements and economic considerations allowed for increased production of oil from unconventional reservoirs, resulting in what will be a second albeit higher peak.
You may not get the concept of a double peak but others certainly do.
https://en.wikipedia.org/wiki/North_Sea_oilUK oil production has seen two peaks, in the mid 1980s and late 1990s,[6] with a decline to around 300×103 m³ (1.9 million barrels) per day in the early 1990s.[citation needed] Monthly oil production peaked at 13.5×10⁶ m³ (84.9 million barrels) in January 1985[35] although the highest annual production was seen in 1999, with offshore oil production in that year of 407×106 m³ (398 million barrels) and had declined to 231×106 m³ (220 million barrels) in 2007
https://oilprice.com/Energy/Crude-Oil/Could-UK-Oil-Production-Peak-Again-In-2019.htmlUK oil production peaked in 1999. The peak was probably pushed out a couple of years because of the major production interruptions following the Piper Alpha disaster. Production declined quickly until around 2011, then the high oil price allowed more brownfield and then greenfield developments that created a third local peak in 2016. Production is declining again this year but there are several large projects due that will create another peak in 2018 or 2019
and as to Hubbert not predicting anything correctly...you better go and change that page on Wiki
https://en.wikipedia.org/wiki/Hubbert_curveBasing his calculations on the peak of oil well discovery in 1948, Hubbert used his model in 1956 to create a curve which accurately predicted that oil production in the contiguous United States would peak around 1970
I’m not sure how you think you are qualified to comment on Hubberts predictions when it is pretty clear you never read his papers nor do you understand what exactly it is that he was doing or predicting.
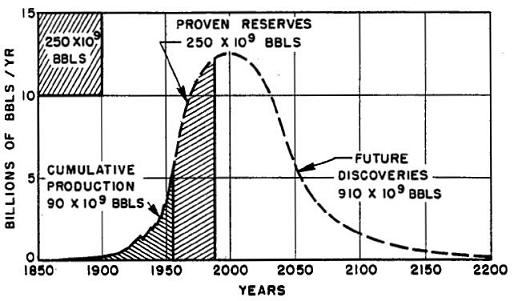
Hubbert, M.K., 1956. Nuclear Energy and the Fossil Fuels. Pubication No. 95 Shell Development Company, Drilling and Production Practice, API. 57 ppA more effective means (Hubbert, 1950a, 1950b) of extrapolating such growth curves is afforded by two basic considerations: (1) For any production curve of a finite resource of fixed amount, two points on the curve are known at the outset, namely tat at t=0 and again at t= infinity. The production rate will be zero when the reference time is zero, and the rate will again be zero when the resource is exhausted; that is to say, in the production of any resource of fixed magnitude, the production rate must begin at zero, and then after passing through one or several maxim, it must decline again to zero.
And Hubbert even identified that multi-peaks happen:
In Figure 13 is shown the corresponding curve for the state of Illinois, which is distinguished by having two widely separated and well-defined maxima, the second considerably larger than the first. The reason for these two maxima is well known
Hubbert goes on to discuss the reason for the second peak in Illinois was due to an underestimation of what were potential hydrocarbon bearing strata and the invention of seismic helped to realize what that might be, creating the later, secondary but higher peak.