Quinny wrote:It's way beyond me (most things are), but I agree that a 'net' useful energy figure would be useful to help understand what's happening. I know someone's bound to scream that this is built into pricing, but IMO that is not a direct enough link.
Even if it could be done historically on actual production data it'd be interesting. It may even show us already on the downslope if EROEI is taken into account.
Here's the best post I found thus far on net energy:
GliderGuider wrote:I took your suggestion and used the new EIA data to make the following graphs.
I used these assumptions:
C&C yields 5.9 MBTU/bbl;
NGPL yields 3.8 MBTU/bbl;
Other Liquids yields 4.0 MBTU/bbl;
EROEI declines linearly from 25:1 in 1980 to 15:1 in 2011.
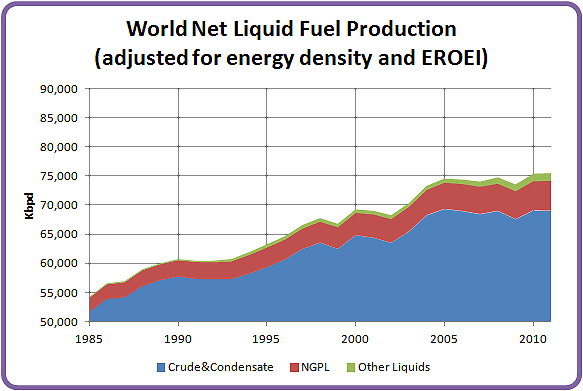
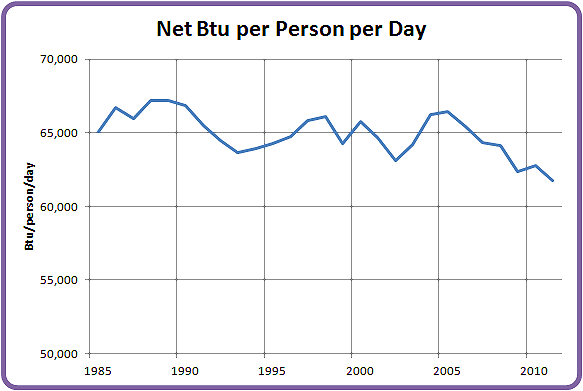
The story is quite clear: net energy from liquid fuels plateaued in 2005, and net energy per capita has been dropping rapidly ever since.
The original data was provided by the EIA. Total Oil Supply, World: International Energy Statistics
The numbers were then adjusted based on their energy content. The EIA also provides data on the heat content of various fuels by year:
Heat ContentFinally, all 3 categories were adjusted based on declining EROEI over time. I am not sure where the author got his EROEI data from, but I don't think it came from the EIA. However it matches up with other estimates I have heard for EROEI. For example:
Fossil Fuels-Energy Return on Energy InvestedYou can see the original EIA data graphed as well as intermediate graphs in the original post:
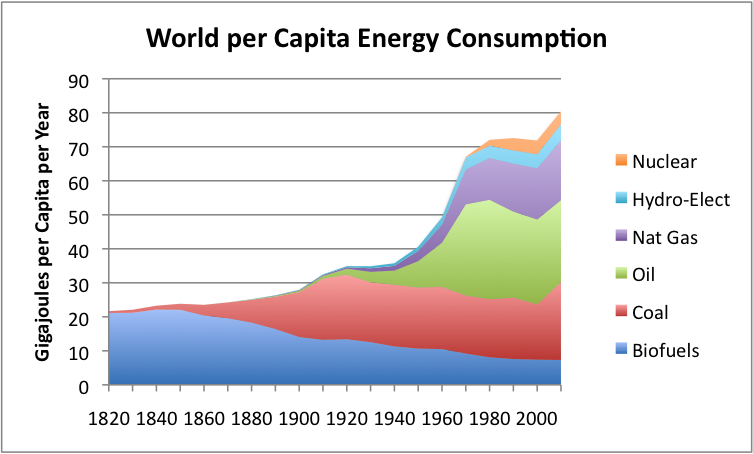
World Gross Liquid Fuel ProductionOne thing noted in a follow up post is that even though our per capita energy from liquid fuels is dropping, our total per capita energy use is still rising. In other worlds, our declining energy from liquid fuels is more than offset by rising energy from other sources:
Gail the Actuary wrote:Glider--what you have shown is net energy from oil and other liquids, per capita per day.
Energy use from coal, natural gas and hydroelectric is rising to offset this decline, even on a per capita basis.
This is my image of long-term world per capita energy consumption from my post World Energy Consumption since 1820.
World per Capita Energy use since 1820
The oil barrel is half-full.


