Guys lots of info and suggestions in this thread ....
Lets try and settle the issues here , cause we can really make a much better job than other people who might have vested interests.
1) Regarding my suggestion to turn this into a
community project. Which is the instrument that we should use? I liked the idea about sourceforge.net but at the same time, politeness mandates that we should not shoot down PO.COM by moving this intitiative elsewhere. After all , it is this site that got us together. So if our moderators can help us with formated displays and graphs we should continue posting here. Source code will have to be distributed somehow ; if this is not feasible through this web site, then by all means lets open a sourceforge project but we should be crossposting here as well. In addition maybe WHT could use his blog to cross post and TF_U use peakoil.nl to post PDF's as they are produced. This would ensure that the project attains the highest possible visibility.
2)
Presentation of results : This is contigent upon a) the ability of our hosts to display graphical information and images and XML code. I have no way of posting in my department's web or ftp site and have IMG links pointing to those images. If someone else has this ability or maintains a blog, we could post there and cross link here, but it might also be easy to directly upload images. However this is a site administration issue so if Aaron or one of the other admins could let us know that would be great!!!!
If formulas have to be given we could use MathML (
http://www.w3.org/Math/) ; Firefox directly presents equations written in MathML but IE needs a plugin like MathPlayer (available for free from Design Science :
http://www.dessci.com/en/products/mathplayer/) . I could do all the rendering in MathML via
Mathematica , but I have to know whether code posted in XML is rendered properly.
By the way there are many open source/free MathML WYSIWYG editors like MathCast (
http://mathcast.sourceforge.net/home.html) so we are not limited to the big bad wolf from WRI.
Maybe one of the site administrators can answer the following question: can one post XML application code and have this displayed properly, or is this feature not implemented/disabled for security reasons?
4)
Agenda for the community project. If we decide to go on with this, we should agree on what we try to accomplish. It is fairly obvious that the people who might be contributing are of different backgrounds, cultures-countries, have different political beliefs etc. It is important to realise that and try and mininize the potential of conflict by establishing and sticking to an agenda which deals with facts and predictions and nothing else. So I could be very happily co-exist with an Earth Firster and a Carbon Industry person in trying to estimate hydrocarbon production till they start to use the project to push a particular agenda. Using the project results is a different story though ... one is free to use them anyway he wants to, as long as he or she keeps the biases away while working on the project. Forgive the lenthy intro, but it is important to realise the truth in SilentE's statement found
here:
Note to the unwary: under NO circumstances should you confuse friend-of-the-White-House Matt Simmons with LATOC-paranoid Matt Savinar.
So I propose to stick to the numbers and the numbers alone and reason only along those lines to avoid confusion between ontological and epistemological statements which have plagued most of the analyses of depletion and subsequent reasoning about implications/consequences/mitigation etc.
Having said all that , which number are we most interested at?
I believe (and this is open to discussion) that the quantities that we should try and estimate are the following:
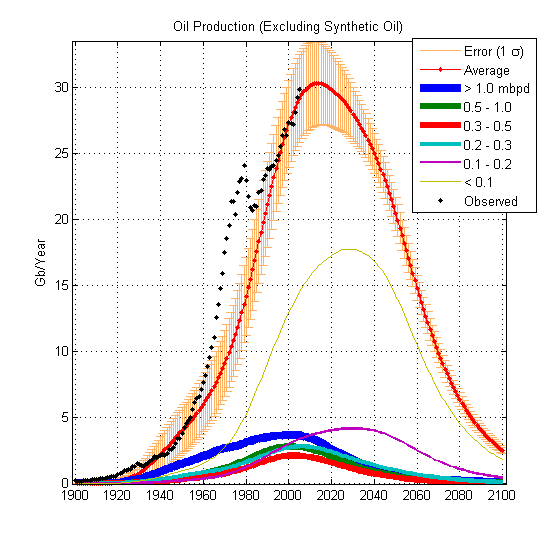
a) Oil production in the future, peak date post depletion declines etc
b) Short term price and market fluctuations.
Note that both a) and b) are tightly interrelated and in fact influence each other. For if the market were to disappear overnight, depletion of the resource would stop, and post-peak the markets will berzerk.
Of course doing so will necessitate modeling of other quantities which affect the former and we should aim to find those individual quantities , understand their influence , put it in numbers and continuously update the models as time ticks by.
This brings us to the next issue:
3)
Methodology. I have noticed various attempts to model depletion in various journals (and by the way , most librarians think that I'm crazy when they realize that a MD is poking into the geology section of the library

). Most of the attempts tried to use fixed parametric forms for the description of the physical basis of the depletion suggested by theories based on Lotka-Volterra dynamics or Roper's mineral resource depletion theory:
http://arts.bev.net/RoperLDavid/minerals/DepletTh.htmI acknowledge WHT's reservations and wholeheartedly agree with him: They are useful default approximations and nothing else. I base my valuation on the following grounds:
a) they fail to take into account the
physical reality of oil drilling- mining
b) they fail to take into account societal feedbacks that can either accelerate or attenuate the rate of depletion
c) they fail to take into account switching-time dynamics and non-linear phenomena
d) provide absolutely no way of incorporating technological advantages and/or assess their impact on dynamics of discovery, depletion, resource substitution (if and when present) etc.
e)
provide no clear separation between the processes of discovery, depletion and marketsf) offer limited facilities for learning from data, or incorporating (imprecise) knowledge if it is known to exist about specific parameters
For example if one examines the following statement from Ropper's site:
At intermediate times there are no rational arguments that we can muster for any particular functional form for P(t) as a function of Q(t). So we shall consider several possibilities and let the production data for a given mineral “choose” which of the possibilities works best by performing least-squares fits to the data. Some obvious statements can be made, however: After rising slowly at earliest times, the production rate should begin to accelerate, then later (at an inflection point) decelerate until the production rate peaks at some time. Then the rate will begin to decline in a similar, but not necessarily symmetrical, fashion. Finally, P(t) will asymptotically approach zero. The simplest assumption that one could make which yields this kind of behavior is that P(t) is strictly proportional to the first power of both [Q¥-Q(t)] and Q(t) at all times;
I cannot see why it is obvious that such a sharp peak should exist and why URR is treated as a
fixed quantity not only known in advance, but able to influence the depletion rate! (I will come to this latter - cause this is a crucial point)
The mathematical constraints put on the production/depletion curve are way too restrictive. In reality the only thing we know about the production curve is that it starts from zero and ends up back to zero. This by virtue of the Roll's Theorem guarantees that the curve has at least one point where its derivative is zero (technically speaking one needs to transform time from [0,Infinity] to a finite interval i.e. [0,1] before one can apply Roll's theorem) . There could be more than one points with the same behaviour ... or more than one peaks, or even a plateau. However using such a curve is an oversimplification .... the production curve for the whole world will be given as a sum of many such curves ... each curve describing how a particular oil field is pumped in response to both geology and economy. And that sum, will also be way too complicated to conceptualize as a curve with a peak and an inflection point, even though it is too guaranteed to have at least one point where its derivative is zero (i.e. a maximum).
And yet many of the peak-oil modellers, use these approximations ... where as a more direct approach that took into account individual oil well data (when and where they exist) is more appropriate and more accurate.
Conceptually any approach that uses a single curve to fit the whole world implicitly assumes that either all oil fields are
physically connected OR that the set of production curves describing the physical depletion of wells is closed under finite addition. But none of the curves usually presented in PO discussions satisfy this criterion i.e. the sum of two logistic curves is not a logistic curve, the sum of two gaussians is not a gaussian etc.
The fact that these methods worked beautfully for the lower US-48 (but guess what, Hubbert was wrong more than once about the URR of the US) , does not mean that they will work for the whole world. After all the political/societal/financial situations and geology in the US during the 20th century has probably little to do with the world as a whole.
What is the method I propose we should use (open to discussion) ?
It is a multi- step approach
A)
Modelling of the physical processes that describe indivindual well behaviour. This models the geology in isolation of the economy!
We should aim to create simplified models of the way reservoirs empty when pumped and state them in mathematical terms. I do understand that modelling these structures in detail require complex CFD and structural geometries codes ... but at useful approximations can be ported from compartmental analysis and 0D electrical network modelling ).
Compartmental analysis tries to model influx and outflux in a complex material system by decomposing it in a system of different compartments , with different volumes and connectivities. So for an example if the way an oil-well empties an "oil pocket" (I apologise for the use of inappropriate terms) behaves like a two compartmental system with one output to the outside world, then the resulting production curve will have a single peak provided the way the two compartment communicate does not change. The volumes of the compartments determine how much oil is potentially recoverable .... and therefore URR is a derived quantity that is related to the physical volumes of the compartments. There is actually quite a developed theory dealing with the identification of such systems i.e. estimating the number of compartments and their interactions from readings of the output of the compartment communicating with the real world. So for example one could use the theory and individual well data to answer questions like are advanced recovery methods allow us to increase the oil ultimately recoverable from a field (by "linking" hitherto unlinked compartments to the output compartment) OR do they simply change the relative volume of existing compartments and hence allow us to reach a high peak followed by a steep depletion? Of course it would quite a scientific hubris to suggest that this approximate method could substitute a detailed geologic simulation but it is better than nothing.
B)
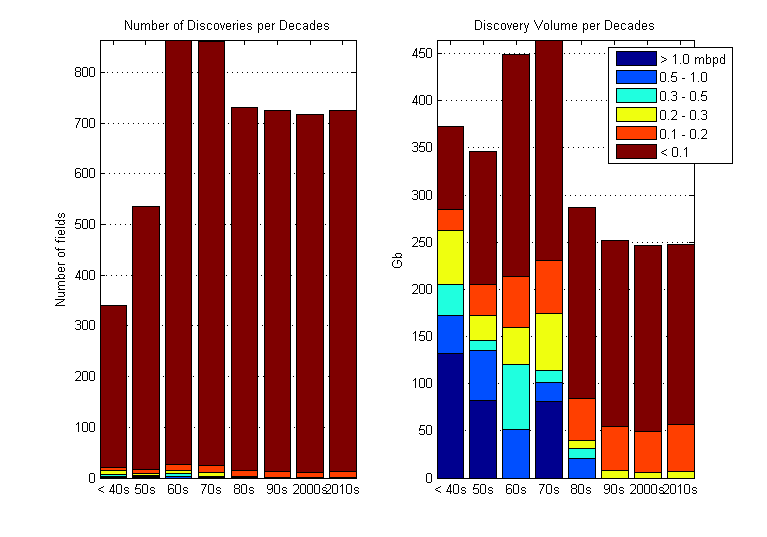
Modelling oil reservoir discovery = EXPLORATION. I found particularly enlightening the comments that rockdock made about log-normal distributions. Are these the terms "creaming curves" are understood? If we had access to discovery data we could estimate such distributions from start by using non-parametric kernel based methods and not rely on fixed parametric assumptions
C)
Modelling the economy i.e. supply and demand . My understanding is that markets are modelled using Stochastic Differential Equations (e.g. Black Sholes formula), but I have absolutely no technical experience in either deploying these mathematical tools (although I'm a fast learner!) or even understand the econometrical context ... Any volunteers?
D)
Modelling interactions: Actually the way economy interacts with geology is pretty straightforward in the compartmental framework. One increases the outflow rate constant (corresponding to opening up the pipes!) or decreases it in response to market signals. I have no way of knowing about exploration though ... conceptually I understand that high prices steer exploration but the argument is that exploration is now a dead end. What lied beneath the ground waiting to be discovered, has already been discovered. This will probably be difficult to answer .... any inputs from the geologists around here?
E)
Learning the models : Quite an impressive number of unknown parameters have to be estimated, and the estimates refined as more production data are available. The only approach that may produce reasonable results is the probabilistic (or actually the Bayesian) approach .... known parameters are fixed, unknown parameters (or actually the probabilities describing their possible values) are estimated and Monte Carlo sims are run . They are the ones generating the scenarios!
F)
Getting the data: rockdock/shakespear1/taskforce_unity any ideas?
4) Choice of tools : from the outset it is fairly obvious that we need software that is able to support the following mathematical methodologies:
a) various flavours of regression
b) probabilistic tools
For that I propose we use the open source R (
http://www.R-project.org) and (win)BUGS from
http://www.mrc-bsu.cam.ac.uk/bugs/welcome.shtml
The second can be dowloaded for free after registration .... and there is also a library that allows R and BUGS to communicate. This will at least guarantee a conformity of tools .... and allow people to test predictions/assumptions on their computers.
However such tools require data, data, data (old and new) and here I rest my case . I hope that other people may contribute ...
"Nuclear power has long been to the Left what embryonic-stem-cell research is to the Right--irredeemably wrong and a signifier of moral weakness."Esquire Magazine,12/05
The genetic code is commaless and so are my posts.


 .
.