Donate Bitcoin

Donate Paypal


PeakOil is You

PeakOil is You

POD

General discussions of the systemic, societal and civilisational effects of depletion.

POD

Unread postby MD » Wed 05 Nov 2014, 09:46:32

Image

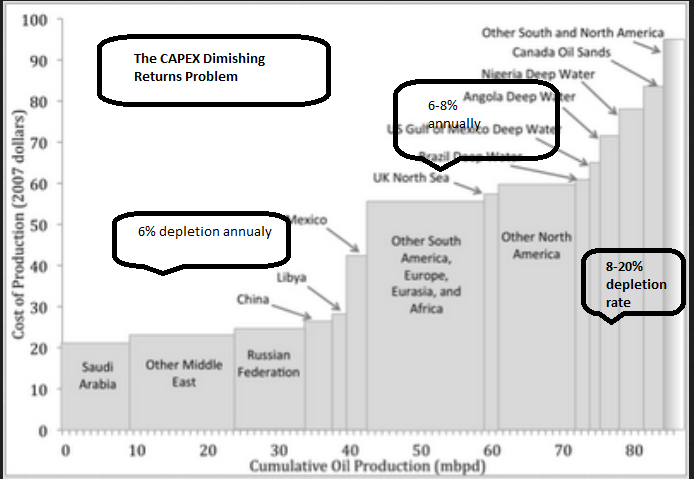
I have been looking for this graph for some time. Today it showed up on the front page!

Picture worth many words.
Stop filling dumpsters, as much as you possibly can, and everything will get better.

Just think it through.
It's not hard to do.
User avatar
MD
COB
COB
 
Posts: 4953
Joined: Mon 02 May 2005, 03:00:00
Location: On the ball

Re: POD

Unread postby ROCKMAN » Wed 05 Nov 2014, 11:07:32

Interesting chart MD. But it leads back once again to a very basic question: what does "Cost of production" mean? Is it the cost to produce existing wells? If so the numbers for the KSA et al don't seem too far off. But if so are way too high for the GOM and others. Lifting costs are generally much lower than many outside the oil patch estimate.

Or does "Cost of Production" mean the cost to develop new reserves? In that case I would say the numbers are much too low for the KSA et al. Some of the bigger proven fields in the KSA require the higher oil prices to develop. Exploring for new fields require as high a price if not more to justify. OTOH a DW GOM field that will recover 300 million bo (250 million bo net) can sell that production for $10 billion at $40/bbl. If it cost $3 billion to develop that field the economics work out more than adequate.

Also in some cases it doesn’t matter which definition on uses: such stats are extremely variable between operators and trends. Some fields have very high LOE (Lease Operating Expense) while other fields in the same trend aren’t so bad. And some operators have good success rates in areas like the deep water plays while others don’t: it doesn’t take too many $250 million dry holes to erode the profitability of a company’s successes.

IOW it’s almost impossible to make such generalized statements. Not only do they tend to not capture the true essence they can both greatly over and understate the situation from trend to trend and from operator to operator.
User avatar
ROCKMAN
Expert
Expert
 
Posts: 11397
Joined: Tue 27 May 2008, 03:00:00
Location: TEXAS

Re: POD

Unread postby ROCKMAN » Wed 05 Nov 2014, 13:31:20

pstarr - "I assume they are based on a reasonable model.” But that's my question: which model? Is it an exploration model running economics for what it cost to drill a new well or is it the economic model to actually produce an existing well? Those two models exist in very different worlds. So again: does County A need $X/bbl to drill for new reserves or does it need $X to generate sufficient cash flow from existing wells to meet its needs? One answer might be $30/bbl and the other $110/bbl.

So I'll ask you: the scale on the left side of the chart says "Cost of Production". What does that mean: the price of oil to justify drilling new wells or the price need to generate a positive cash flow from the existing wells? I'm pretty sure at the KSA can't break even drilling new wells for $25/bbl as that chart shows. I'm also confident that $billions were spent to develop the oil sands if they needed $85/bbl to just break even. As I pointed out that 1 million bopd in the oil sands was developed when oil was selling for $25 to $35 per bbl even when adjusted for inflation.

Again I think folks are using cost of producing oil reservoirs when they really mean cost of developing oil reservoirs. Two very different metrics. Unless you understand what they mean such plots are worthless. In this case I suspect the chart is a mix of the two metrics. Which means it’s not “over-simplified” but totally worthless if that’s the case.
User avatar
ROCKMAN
Expert
Expert
 
Posts: 11397
Joined: Tue 27 May 2008, 03:00:00
Location: TEXAS

Re: POD

Unread postby MD » Wed 05 Nov 2014, 15:08:35

Rock, I get you, but you are missing and making my point at the same time.

The important and simple point is that legacy fields, where costs are low, are depleting at a fairly steady and predictable rate. The world is not adding any significant low cost production.

New production is much more expensive and depletes faster. Drilling like mad and nearly standing still.

Simplistic? Yes. It's a simple diminishing returns problem. Why shouldn't it be simple?
Stop filling dumpsters, as much as you possibly can, and everything will get better.

Just think it through.
It's not hard to do.
User avatar
MD
COB
COB
 
Posts: 4953
Joined: Mon 02 May 2005, 03:00:00
Location: On the ball

Re: POD

Unread postby dashster » Wed 05 Nov 2014, 23:35:55

I see Canadian Oil Sands on the chart. Not sure what they are referring to with regard to depletion rate and Oil Sands.
dashster
Lignite
Lignite
 
Posts: 385
Joined: Fri 28 Dec 2012, 08:39:24
Location: California

Re: POD

Unread postby MD » Thu 06 Nov 2014, 07:12:40

dashster wrote:I see Canadian Oil Sands on the chart. Not sure what they are referring to with regard to depletion rate and Oil Sands.


that's where you enter into comparison problems. Oil sands require massive infrastructure that is "depleting" or "depreciating" constantly, at high rates. In that particular case many of the costs show up on the balance sheet as maintenance, but essentially it is still eating capital whether it be on the depreciation schedule or not.

If you want to drag it off and pull it apart by the details, you will be successful. That doesn't take away from the simple fact that there is a global diminishing returns problem.

A big, fat, CAPEX hole that's eating all of the money that can be printed, borrowed, sold to investors, etc. It's a relentless monster that as the old elephants continue to deplete will create huge problems not far down the road.

There are so many varied accounting methods along with widely varying production profiles that makes a detailed engineering/accounting audit comparison nearly impossible. That does not, however, take away from the simple accuracy of the relationship reflected in the chart. Note I said "accuracy", not "precision".
Stop filling dumpsters, as much as you possibly can, and everything will get better.

Just think it through.
It's not hard to do.
User avatar
MD
COB
COB
 
Posts: 4953
Joined: Mon 02 May 2005, 03:00:00
Location: On the ball

Re: POD

Unread postby ROCKMAN » Thu 06 Nov 2014, 09:16:56

MD - "...that's where you enter into comparison problems". But that's exactly the point I'm trying to make. It's your chart posted: what does it show...are those the low lifting cost ME numbers comparing to the high development cost of new drilling in the DW GOM et al? If so wouldn't it be more appropriate to compare lifting costs of all regions? Likewise to compare development costs of drilling up new reserves in all regions?

The chart looks like its comparing apples to oranges. Actually not even that close: more like apples to onions. LOL. I don't have an accurate picture of what it cost to go out and find/develop new oil reserves in Saudi Arabia but I doubt it's anywhere as low as $20/bbl. If it were the KSA would have many times more rigs drilling then they do now. Who wouldn’t if they could find new oil reserves for $20/bbl? But I do have a good handle on what lifting costs are for DW GOM fields and the number on the chart is ridiculously too high. For instance for a field making just 100,000 bopd the operating cost to produce that oil at $65/bbl would be almost $200 MILLION PER MONTH. That’s $2.4 BILLION PER YEAR to operate such a field. I can assure you that the actual lifting cost isn’t even close to 5% of that amount. The KSA can’t find new oil reserves for $20/bbl and the DW GOM operators wouldn’t drill out there if their lifting costs were even close $65/bbl.

You see what I’m saying now: the chart isn’t representing what anyone thinks it’s saying regardless how they interpret “Cost of Production”. Either way the chart is grossly misleading IMHO.
User avatar
ROCKMAN
Expert
Expert
 
Posts: 11397
Joined: Tue 27 May 2008, 03:00:00
Location: TEXAS

Re: POD

Unread postby MD » Fri 07 Nov 2014, 05:19:23

ROCKMAN wrote:
You see what I’m saying now: the chart isn’t representing what anyone thinks it’s saying regardless how they interpret “Cost of Production”. Either way the chart is grossly misleading IMHO.


I understand, and I cannot defend it in detail. I'm still convinced of its accuracy though.

Lots of production barrels out there these days are making a marginal contribution, and not more than that.

What happens when the marginal barrel of today becomes the normal barrel 20 years from now?

Big f-in problems, that's what happens.

And that is exactly where we are headed!

The marginal barrel barely produces enough to pay electricity and maintenance, or maybe it doesn't even cover costs, but its contribution tops off the truck for the day, so it keeps pumping. Surely you have seen that or its equivalent many times?

The first one I described is the "gentle" marginal barrel. The "harsh" one is the project that eats a bunch of investor money with no where near the sales-pitch return. So the capex is written of by various and sometimes nefarious methods and the well ends up cash flowing on a maintenance basis for another operator for the rest of its service life, eventually becoming the "gentle" type of marginal barrel.

How many times has that scenario played out? Tens of thousands of times I expect, and it sure smells like there is a whole crap-load of those type deals in play today.
Stop filling dumpsters, as much as you possibly can, and everything will get better.

Just think it through.
It's not hard to do.
User avatar
MD
COB
COB
 
Posts: 4953
Joined: Mon 02 May 2005, 03:00:00
Location: On the ball

Re: POD

Unread postby MD » Sat 08 Nov 2014, 04:23:50

What what?

No one is going to step up and tell me I am full of caca?
Stop filling dumpsters, as much as you possibly can, and everything will get better.

Just think it through.
It's not hard to do.
User avatar
MD
COB
COB
 
Posts: 4953
Joined: Mon 02 May 2005, 03:00:00
Location: On the ball

Re: POD

Unread postby ROCKMAN » Sat 08 Nov 2014, 11:00:20

MD - "I'm still convinced of its accuracy though." Fair enough. So you believe the KSA and Russia have undeveloped oil reserves they can drill up for $20/bbl. I wonder why we didn't see those two countries bring in every drill rig on the planet when oil was going for $100/bbl and they could make 5X their investment.
User avatar
ROCKMAN
Expert
Expert
 
Posts: 11397
Joined: Tue 27 May 2008, 03:00:00
Location: TEXAS

Re: POD

Unread postby Keith_McClary » Sun 09 Nov 2014, 01:10:55

Facebook knows you're a dog.
User avatar
Keith_McClary
Light Sweet Crude
Light Sweet Crude
 
Posts: 7344
Joined: Wed 21 Jul 2004, 03:00:00
Location: Suburban tar sands

Re: POD

Unread postby MD » Sun 09 Nov 2014, 10:24:06

ROCKMAN wrote:MD - "I'm still convinced of its accuracy though." Fair enough. So you believe the KSA and Russia have undeveloped oil reserves they can drill up for $20/bbl.


Not sayin' that at all, although both can probably continue to keep depletion in check on the $20 stuff for a while yet. I wouldn't bank on it for long though.

The important point, again, are the marginal barrels, or "mill fill". Those barrels that sell for above market price in smaller quantities because they fill out refinery production runs or logistic models.

It's such a convoluted and complex business. At the ground level decisions are often made with factors other than immediate price concerns.

From the overview then, then best that can be done many times is to understand base dynamics.

Development and production costs vary across a wide range today from 20-120 bucks a barrel or so. The wedge, however, is moving.

It isn't talked about much, because like this one, the conversations tend to get driven off into the bushes. "But xxx can still do some $50 barrels and yyy has is a completely different resource type and zzz yields a completely different mix of end product." Yep, yep. A report detailing all of those variables would be hundreds of pages long and would require tens of thousands of hours of data review, if you could even get to the data. It's why no one has done it.

Doesn't change the basic "accuracy" of the model though. You want "precision" instead? Good luck with that!

The other graphs offered just up thread are interesting too, but their assertion "price required to produce" is a bit misleading. Here's what people need to get their heads around, and I have heard you say it too, I think:

"The market price does not always determine what is being produced on any given day."

Lots of production out there is marginal.
Stop filling dumpsters, as much as you possibly can, and everything will get better.

Just think it through.
It's not hard to do.
User avatar
MD
COB
COB
 
Posts: 4953
Joined: Mon 02 May 2005, 03:00:00
Location: On the ball

Re: POD

Unread postby ROCKMAN » Sun 09 Nov 2014, 10:32:07

Keith - So according to your last chart the ME onshore could add more then 20 million bopd by 2020 at an oil prices slightly below $40/bbl? Or is the chart implying that the ME onshore can continue producing 20 million bopd at less then $40/bbl because of low lifting costs?

This is the same problem I keep tossing at MD: are those the oil prices required to continue producing existing wells (and thus generating positive cash flow) or are those the prices required to drill up new reserves? If it's the prices required to produce positive cash flow from exiting wells then I can assure you the $70/bbl requirement for positive cash flow from Deep Water production is ridiculously too high. The lifting cost for DW GOM production is less than $20/bbl. And in some of the fields out there much less.

Or interpret the chart the other way: there's 20 million bopd that can be generated from new drilling in the ME onshore with oil priced around $40/bbl. So which countries have been just sitting there not developing those reserves since we've had much higher prices for many years now?

You posted the chart so I'll leave it to you to tell us which of the above scenarios is being offered. But regardless of how that "cost" is defined one set of scenarios appear very unrealistic IMHO. There are two very different oil prices: A) the price required to PRODUCE existing oil reserves and B) the price required to DEVELOP new oil reserves. The curve is labeled "Cost of Supply". So which is it...A or B?
User avatar
ROCKMAN
Expert
Expert
 
Posts: 11397
Joined: Tue 27 May 2008, 03:00:00
Location: TEXAS

Re: POD

Unread postby MD » Sun 09 Nov 2014, 10:39:21

ROCKMAN wrote:A) the price required to PRODUCE existing oil reserves and B) the price required to DEVELOP new oil reserves. The curve is labeled "Cost of Supply". So which is it...A or B?


Yeah, and those two are often conflated by analysts and also by slippery accounting methods employed by producers. From a simple well analysis it's easy. It costs me X much to develop it, and costs Y much to produce it over its projected life. Add 'em up and divide by the number of barrels and there you go.

On a world wide basis though? With all of the variables in play? You are only going to get generalities and swags. Anyone that tries to add decimal points to their answers is either a fool or a liar. :lol:
Stop filling dumpsters, as much as you possibly can, and everything will get better.

Just think it through.
It's not hard to do.
User avatar
MD
COB
COB
 
Posts: 4953
Joined: Mon 02 May 2005, 03:00:00
Location: On the ball

Re: POD

Unread postby ROCKMAN » Sun 09 Nov 2014, 11:12:22

MD - I don't necessarily think we view things very differently. But here we go with the nomenclature issue again. Your words: "Development and production costs vary across a wide range today from 20-120 bucks a barrel or so." I can assure you no company or country is spending anything close to the high end of that range to PRODUCE the vast majority of existing oil wells. And I can equally assure you that very few projects DEVELOPED in recent years could have been justified at a price close to $20/bbl. I know: I'm being a picky bastard. LOL.

I don't have a problem with folks tossing out generalities even if they aren't very accurate. Often we just don't have the necessary detailed data base. The problem I have is when folks think it costs so much to produce existing wells or that much new reserves can be added at such low oil prices. I know I'm whipping that dead horse one more time. But for everyone in the oil patch the cost to produce oil is a very different metric than the cost to develop oil production. I've drilled a number of wells that I sold oil/NG from at prices 10X or more then what it cost me to produce them. But they were bad investments because those wells would never recover enough total oil/NG to return the initial investment. I suspect few folks realize how much current production is economical to produce from wells that will never recover the investment even at $100/bbl.
User avatar
ROCKMAN
Expert
Expert
 
Posts: 11397
Joined: Tue 27 May 2008, 03:00:00
Location: TEXAS

Re: POD

Unread postby MD » Sun 09 Nov 2014, 11:21:56

ROCKMAN wrote:...I suspect few folks realize how much current production is economical to produce from wells that will never recover the investment even at $100/bbl.


Exactly!

You know it typically takes three tries before a new independent restaurant stabilizes?

The first owner develops the place for a couple hundred grand, but can't cash flow the place enough to cover both his "production costs" (his daily operating expenses), and the note to his bank (his development costs). Eventually the bank forecloses and dumps the place to the next guy at 50 cents on the dollar. He has a bit better time of it but typically fails also.

Third guy in buys the assets at 15 cents on the dollar, and he is good to go, as long as he stays on his toes and works hard.

Oil patch is no different, just a lot more complicated and on a much larger scale. It looks like there are a lot of "first time restaurant owners" currently in play.
Stop filling dumpsters, as much as you possibly can, and everything will get better.

Just think it through.
It's not hard to do.
User avatar
MD
COB
COB
 
Posts: 4953
Joined: Mon 02 May 2005, 03:00:00
Location: On the ball

Re: POD

Unread postby ROCKMAN » Sun 09 Nov 2014, 12:20:40

MD - Exactly. I just made that point to Nony on a front page story when he asked about my job security: low NG prices shut that program down for my company. If oil prices stay low enough long enough and that angle might erode. So what to do, what to do? Easy answer: I'm developing a relationship with a company whose biz plan is to take advantage of companies crippled by low prices by acquiring their producing properties at a discount. Like I told him: been dealing with the boom/bust cycles during the last four decades. IOW this ain't my first rodeo. LOL.
User avatar
ROCKMAN
Expert
Expert
 
Posts: 11397
Joined: Tue 27 May 2008, 03:00:00
Location: TEXAS

Re: POD

Unread postby Keith_McClary » Sun 09 Nov 2014, 17:23:11

ROCKMAN wrote:You posted the chart so I'll leave it to you to tell us which of the above scenarios is being offered.
They are all from proprietary data shops so we don't get to see what goes into these. (Do paying customers get much more?)

MD wrote:The wedge, however, is moving.
Whatever their methods, it would be interesting to see the same graphs for different years.
Facebook knows you're a dog.
User avatar
Keith_McClary
Light Sweet Crude
Light Sweet Crude
 
Posts: 7344
Joined: Wed 21 Jul 2004, 03:00:00
Location: Suburban tar sands

Re: POD

Unread postby ROCKMAN » Sun 09 Nov 2014, 18:23:38

Keith - "They are all from proprietary data shops so we don't get to see what goes into these". Thanks... didn't realize that. But I'm not asking them to prove their numbers but to clearly define what they mean by "cost". And as I said it doesn't matter what proprietary data they have: regardless of what that definition might be half of that hart is easily assumed BS. If they mean development cost it's extremely unlikely that 20 million bopd could be drilled up in the ME onshore. And if the mean actual production (lifting) cost companies are certainly not spending hundreds of $millions every month to operate individual Deep Water fields.

So I'll poll everyone here. What do you think they mean by "cost": what it cost companies to produce existing wells or what the price has to be to drill new wells? Some of these articles come across as Rorschach test: the readers perceive a piece is saying something it really isn't. This chart is great example since it's extremely unlikely that all the data is correct.
User avatar
ROCKMAN
Expert
Expert
 
Posts: 11397
Joined: Tue 27 May 2008, 03:00:00
Location: TEXAS

Next

Return to Peak Oil Discussion

Who is online

Users browsing this forum: No registered users and 259 guests