This is a graph of world oil production vs world oil demand.
http://www.countercurrents.org/eia1.jpg
The world oil supply/production by 2027 will only be 1/2 of the world oil demand. I find that pretty interesting because by 2027, there will be a collapse of industrialized civilization as a result.


PeakOil is You
An interesting graph about world oil production
First unread post • 15 posts
• Page 1 of 1
An interesting graph about world oil production
![]() by DesuMaiden » Tue 04 Nov 2014, 09:36:15
by DesuMaiden » Tue 04 Nov 2014, 09:36:15
History repeats itself. Just everytime with different characters and players.
- DesuMaiden
- Tar Sands

- Posts: 886
- Joined: Mon 06 Oct 2014, 16:00:31
Re: An interesting graph about world oil production
![]() by Subjectivist » Tue 04 Nov 2014, 10:26:02
by Subjectivist » Tue 04 Nov 2014, 10:26:02
World demand is set by price. If we were still getting all the oil we wanted at $3.00/bbl like we had in 1971 I promise you current demand would quadrupal current production, or more.
II Chronicles 7:14 if my people, who are called by my name, will humble themselves and pray and seek my face and turn from their wicked ways, then I will hear from heaven, and I will forgive their sin and will heal their land.
- Subjectivist
- Volunteer

- Posts: 4701
- Joined: Sat 28 Aug 2010, 07:38:26
- Location: Northwest Ohio
Re: An interesting graph about world oil production
![]() by ROCKMAN » Tue 04 Nov 2014, 10:51:44
by ROCKMAN » Tue 04 Nov 2014, 10:51:44
"The world oil supply/production by 2027 will only be 1/2 of the world oil demand." No, it won't. Not moderated by price global oil "demand" will exceed the supply by many fold. Just as it does today...and has always been the case since Col. Drake pumped the first bbl out of the ground. OTOH, moderated by price, oil demand will exactly match oil supplies in the future...just as it has in the past. Everyone who can afford to buy oil at whatever the future price might be will have all the oil they can buy.
-

ROCKMAN - Expert

- Posts: 11397
- Joined: Tue 27 May 2008, 03:00:00
- Location: TEXAS
Re: An interesting graph about world oil production
![]() by BobInget » Tue 04 Nov 2014, 11:22:39
by BobInget » Tue 04 Nov 2014, 11:22:39
COKE FUELED oil traders could care less about 2027. Most will be dead by then.
Watch oil prices rise towards the end of this election day.
Friday closing's chart will make for a most interesting graph.
Watch oil prices rise towards the end of this election day.
Friday closing's chart will make for a most interesting graph.
- BobInget
- Lignite

- Posts: 200
- Joined: Sun 12 Feb 2012, 17:46:44
Re: An interesting graph about world oil production
![]() by dinopello » Tue 04 Nov 2014, 11:42:08
by dinopello » Tue 04 Nov 2014, 11:42:08
UBS Chief Investment Strategists Michael Ryan explains:
Ryan disagreed, arguing the dynamics in the oil market are more of an oversupply problem than a weak demand problem.
-

dinopello - Light Sweet Crude

- Posts: 6088
- Joined: Fri 13 May 2005, 03:00:00
- Location: The Urban Village
Re: An interesting graph about world oil production
![]() by Keith_McClary » Tue 04 Nov 2014, 12:57:55
by Keith_McClary » Tue 04 Nov 2014, 12:57:55
DesuMaiden wrote:This is a graph of world oil production vs world oil demand.
http://www.countercurrents.org/eia1.jpg
The world oil supply/production by 2027 will only be 1/2 of the world oil demand. I find that pretty interesting because by 2027, there will be a collapse of industrialized civilization as a result.
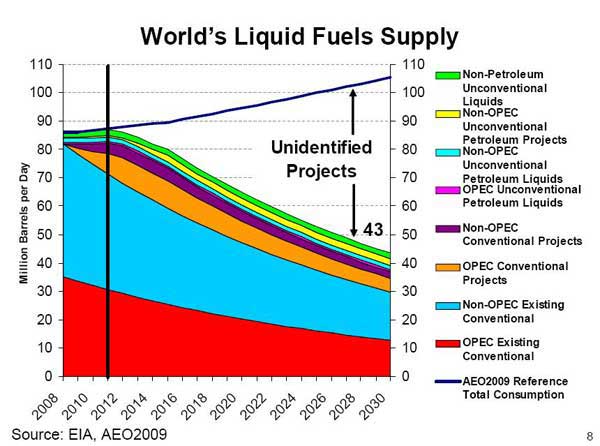
That is from the EIA - Annual Energy Outlook 2009. I went looking for an update on that graph, but they don't seem to do that one any more. Has anyone seen something similar?
Facebook knows you're a dog.
-

Keith_McClary - Light Sweet Crude
- Posts: 7344
- Joined: Wed 21 Jul 2004, 03:00:00
- Location: Suburban tar sands
Re: An interesting graph about world oil production
![]() by tom_s2 » Tue 04 Nov 2014, 15:35:25
by tom_s2 » Tue 04 Nov 2014, 15:35:25
Hi desumaiden,
That's not what the graph says. The graph says that the gap will be made up by "unidentified projects". Maybe the EIA is being too optimistic and there won't actually be enough unidentified projects to provide all that oil. However, oil supply won't be 1/2 demand unless no new oilfields whatsoever are developed in all that time, which is implausible.
No there will not be a collapse of civilization as a result!! The economy sacrifices the LEAST important things FIRST.
Even if your interpretation of that graph were correct, the result would not be a collapse of civilization. The result would be big increase in the price of oil, a severe curtailment of discretionary travel, and a shift to alternatives and electrified transportation like battery-electric cars.
Desumaiden, I'm definitely not meaning to be overly assertive here. However I cannot stress enough that this energy collapse stuff is a fringe crackpot theory, that it's ignored by all relevant experts, and that it has a long history of drastically failed predictions which means there's something seriously wrong with it. Civilization is NOT collapsing for these reasons. Don't spend your whole life preparing for something (and worrying about something) which isn't happening. If you want to stockpile a few years' worth of canned foods and water, then go for it. There are other possible disasters, like worldwide crop failure. However, after you've stockpiled your canned food then leave it at that and get on with your life.
Of course, you can do whatever you want. At this point I think you're committed to these things. However I thought I'd make one final try.
Best wishes,
-Tom S
The world oil supply/production by 2027 will only be 1/2 of the world oil demand.
That's not what the graph says. The graph says that the gap will be made up by "unidentified projects". Maybe the EIA is being too optimistic and there won't actually be enough unidentified projects to provide all that oil. However, oil supply won't be 1/2 demand unless no new oilfields whatsoever are developed in all that time, which is implausible.
there will be a collapse of industrialized civilization as a result
No there will not be a collapse of civilization as a result!! The economy sacrifices the LEAST important things FIRST.
Even if your interpretation of that graph were correct, the result would not be a collapse of civilization. The result would be big increase in the price of oil, a severe curtailment of discretionary travel, and a shift to alternatives and electrified transportation like battery-electric cars.
Desumaiden, I'm definitely not meaning to be overly assertive here. However I cannot stress enough that this energy collapse stuff is a fringe crackpot theory, that it's ignored by all relevant experts, and that it has a long history of drastically failed predictions which means there's something seriously wrong with it. Civilization is NOT collapsing for these reasons. Don't spend your whole life preparing for something (and worrying about something) which isn't happening. If you want to stockpile a few years' worth of canned foods and water, then go for it. There are other possible disasters, like worldwide crop failure. However, after you've stockpiled your canned food then leave it at that and get on with your life.
Of course, you can do whatever you want. At this point I think you're committed to these things. However I thought I'd make one final try.
Best wishes,
-Tom S
- tom_s2
- Peat
- Posts: 111
- Joined: Wed 08 Oct 2014, 15:20:24
Re: An interesting graph about world oil production
![]() by kublikhan » Tue 04 Nov 2014, 19:21:49
by kublikhan » Tue 04 Nov 2014, 19:21:49
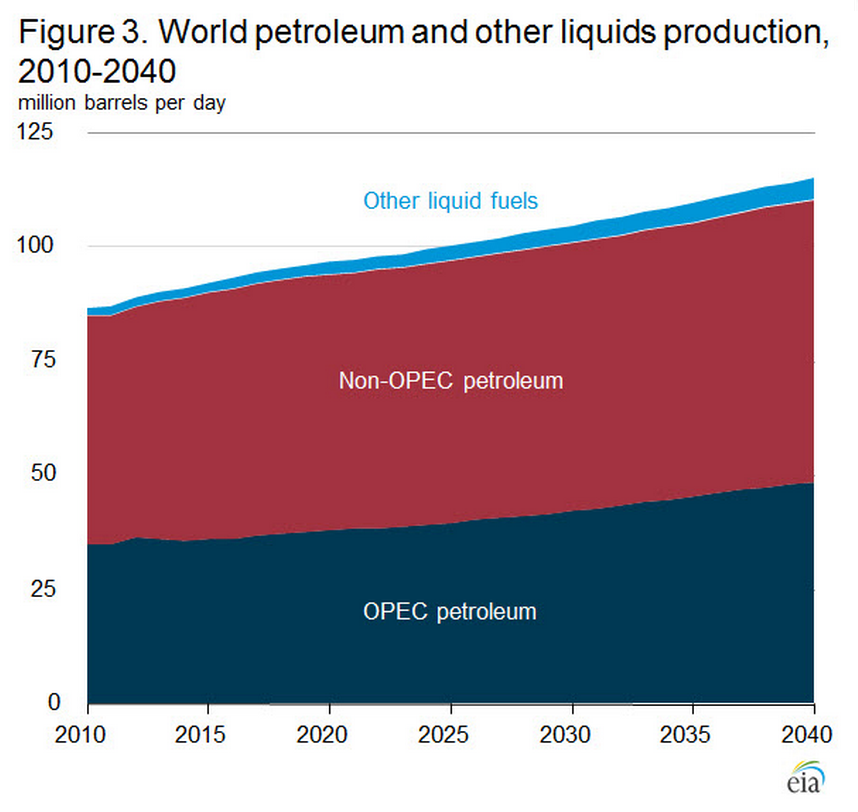
Keith, were you looking for something like this?
http://instituteforenergyresearch.org/w ... Graph3.png
Source: Energy Information Administration, International Energy Outlook 2013
EIA Outlook: Fossil Fuels Continue to Dominate World Energy Supply
http://instituteforenergyresearch.org/w ... Graph3.png
Source: Energy Information Administration, International Energy Outlook 2013
EIA Outlook: Fossil Fuels Continue to Dominate World Energy Supply
The oil barrel is half-full.
-

kublikhan - Master Prognosticator

- Posts: 5023
- Joined: Tue 06 Nov 2007, 04:00:00
- Location: Illinois
Re: An interesting graph about world oil production
![]() by Quinny » Tue 04 Nov 2014, 21:19:59
by Quinny » Tue 04 Nov 2014, 21:19:59
Tom
suppose it depends what is defined by who and what is defined as 'important'!
'No there will not be a collapse of civilization as a result!! The economy sacrifices the LEAST important things FIRST.'
suppose it depends what is defined by who and what is defined as 'important'!
'No there will not be a collapse of civilization as a result!! The economy sacrifices the LEAST important things FIRST.'
Live, Love, Learn, Leave Legacy.....oh and have a Laugh while you're doing it!
-

Quinny - Intermediate Crude
- Posts: 3337
- Joined: Thu 03 Jul 2008, 03:00:00
Re: An interesting graph about world oil production
![]() by ralfy » Tue 04 Nov 2014, 23:46:00
by ralfy » Tue 04 Nov 2014, 23:46:00
If industrial civilization requires an energy demand increase each year to ensure economic growth (because the same civilization is a capitalist one), then collapse may take place much earlier.
-

ralfy - Light Sweet Crude
- Posts: 5603
- Joined: Sat 28 Mar 2009, 11:36:38
- Location: The Wasteland
Re: An interesting graph about world oil production
![]() by Loki » Tue 04 Nov 2014, 23:55:19
by Loki » Tue 04 Nov 2014, 23:55:19
dinopello wrote:the dynamics in the oil market are more of an oversupply problem than a weak demand problem.
 Funniest thing I've heard all week
 A garden will make your rations go further.
-

Loki - Expert
- Posts: 3509
- Joined: Sat 08 Apr 2006, 03:00:00
- Location: Oregon
Re: An interesting graph about world oil production
![]() by Loki » Wed 05 Nov 2014, 00:02:30
by Loki » Wed 05 Nov 2014, 00:02:30
ROCKMAN wrote:Everyone who can afford to buy oil at whatever the future price might be will have all the oil they can buy.
Indeed.
But surely when peak oil hits at 5:43 pm, March 12, 2015, then every car around the world will suddenly run out of gas and global civilization will collapse. Right?
A garden will make your rations go further.
-
Loki - Expert
- Posts: 3509
- Joined: Sat 08 Apr 2006, 03:00:00
- Location: Oregon
Re: An interesting graph about world oil production
![]() by Keith_McClary » Wed 05 Nov 2014, 00:06:21
by Keith_McClary » Wed 05 Nov 2014, 00:06:21
Thanks. I was hoping for a 2014 version of the 2009 graph. I wanted to see what the "unidentified projects" slice looks like (is it getting bigger?).kublikhan wrote:Keith, were you looking for something like this?
http://instituteforenergyresearch.org/w ... Graph3.png
Source: Energy Information Administration, International Energy Outlook 2013
EIA Outlook: Fossil Fuels Continue to Dominate World Energy Supply
EDIT: They were doing this peakish stuff back in 2000 (conventional crude) :

http://www.eia.gov/pub/oil_gas/petroleu ... ply04.html
Their current projections to 2040 don't show any peakishness.
Facebook knows you're a dog.
-
Keith_McClary - Light Sweet Crude
- Posts: 7344
- Joined: Wed 21 Jul 2004, 03:00:00
- Location: Suburban tar sands
Re: An interesting graph about world oil production
![]() by ROCKMAN » Wed 05 Nov 2014, 00:29:15
by ROCKMAN » Wed 05 Nov 2014, 00:29:15
Loki - It would seem that in our neighborhood here the date of global PO has finally moved to the back burner in favor of the POD. But I think we sometimes loose track of the fact that we are insignificant small chunk of the global society. I don't think the great majority even focuses on a GPO date. They just keep muddling along with their heads down.
-
ROCKMAN - Expert
- Posts: 11397
- Joined: Tue 27 May 2008, 03:00:00
- Location: TEXAS
Re: An interesting graph about world oil production
![]() by DesuMaiden » Sat 08 Nov 2014, 15:07:55
by DesuMaiden » Sat 08 Nov 2014, 15:07:55
ralfy wrote:If industrial civilization requires an energy demand increase each year to ensure economic growth (because the same civilization is a capitalist one), then collapse may take place much earlier.
I completely agree with that. The collapse will happen sooner than most people think.
History repeats itself. Just everytime with different characters and players.
- DesuMaiden
- Tar Sands
- Posts: 886
- Joined: Mon 06 Oct 2014, 16:00:31
15 posts
• Page 1 of 1
Who is online
Users browsing this forum: No registered users and 24 guests