

The views expressed in this post are those of the author alone.
This assessment is based on the data in the 2017 BP Statistical Review of World Energy available here. As such it uses that review’s definition of oil which is crude and condensate and natural gas liquids, uncompensated for their different energy contents or values of refined product components.

(Click to enlarge)
Figure 1: World Oil Production 1990 – 2017
This analysis was prompted by a chart by Ovi showing that Non-OPEC production less Russia, Canada and the United States has been in decline since 2004. That decline rate is 0.25 million barrels/day/annum. It had previously risen strongly from 1990.
(Click to enlarge)
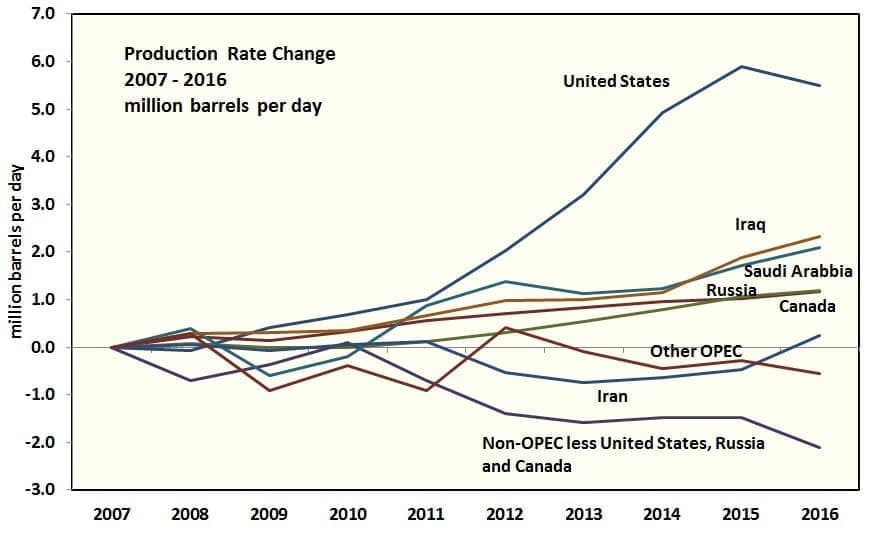
Figure 2: Production Rate Change 2007 – 2016
The United States LTO patch is widely credited with having caused the oil price collapse of 2014. American production had risen by six million barrels per day since 2007. The United States was not alone with four other countries totaling six million barrels per day of production increase. Iraq and Saudi Arabia contributed two million barrels per day each with Russia and Canada contributing one million barrels per day each.

(Click to enlarge)
Figure 3: World Oil Consumption 1990 – 2016
OECD consumption has been flat even as OECD countries have had an increase in GDP.

(Click to enlarge)
Figure 4: Where the Oil Went
The fall of non-OECD consumption from 1990 to 1996 was due to the dissolution of the Soviet Union. Since then consumption growth has been steady at about 835,000 barrels/day/annum. Chinese consumption growth was 240,000 barrels/day/annum up to 2002 and then steepened to 512,000 barrels/day/annum since. OECD consumption growth was strong up to 2007 and then demand contracted due to higher oil prices. From here it looks like OECD consumption has plateaued. China may have also plateaued. Non-OECD consumption is likely to continue rising with a large part of that being due to India.

(Click to enlarge)
Figure 5: World Oil Production from 1990 with a Projection to 2025
This projection is based on U.S. conventional production resuming long term decline and U.S. LTO production continuing to climb, driven by the Permian Basin. Russian production is in a long plateau. Canadian production continues its slow, capital-intensive climb. Other non-OPEC production continues its established decline of 0.25 million barrels/day/year. Iraqi production rises by 2.0 million barrels/day to 2025. It could be higher than that. Other OPEC production had risen by 3.0 million barrels/day from 2000 to 2005, in response to the lifting of production restrictions, and has been in a plateau since. The projection assumes a decline of 0.3 million barrels/day/year.
The projection shows a gap of about eight million barrels per day by 2025 relative to the established growth rate indicated by the dashed line. This could largely be filled if Permian Basin production ramps up faster than projected and Iraqi production growth ramps up faster than projected now that their civil war is over.
In summary, the market is likely to remain in balance and sustained price excursions are unlikely.
By Peak Oil Barrel
OilPrice.com
Cloggie on Thu, 28th Dec 2017 6:41 am
Hydrogen economy, here we come!
Forget about batteries or even pumped hydro, hydrogen is the real deal after all for mass renewable energy storage.
Norwegian company Nel-Hydrogen, with more than 80 years experience in producing hydrogen is asked to build a massive 700 MW power-to-gas installation in Normandy, France:
https://deepresource.wordpress.com/2017/12/28/700-mw-renewable-hydrogen-plant-to-be-built-in-france/
Renewable electricity in, hydrogen gas out.
Initially the hydrogen will be mixed with natural gas and pumped into existing natural gas networks, thereby significantly reducing CO2 emissions.
The first 100 MW will cost 45 million euro.
The West is betting on batteries.
Japan is betting on fuel cells.
I’m betting on Japan.
Davy on Thu, 28th Dec 2017 7:03 am
Good news Tulip, keep us posted.
MASTERMIND on Thu, 28th Dec 2017 9:43 am
Clogg
Renewable energy ‘simply won’t work’: Top Google engineers
Two highly qualified Google engineers who have spent years studying and trying to improve renewable energy technology have stated quite bluntly that whatever the future holds, it is not a renewables-powered civilisation: such a thing is impossible.
http://www.theregister.co.uk/2014/11/21/renewable_energy_simply_wont_work_google_renewables_engineers/
Solar and Wind produced less than one percent of total world energy in 2016 – IEA WEO 2017
https://www.iea.org/publications/freepublications/publication/KeyWorld2017.pdf
Don Zenga on Sat, 30th Dec 2017 3:02 pm
BP is including bio fuels in Petroleum and this is absolutely wrong. If we remove it, then the petroleum consumption may decrease by 2%.
I don’t know what they will do about Methanol which is produced from Coal.
And how much oil is used to produce Oil needs to be factored in.
As the plugin vehicles keeps increasing, the oil consumption will freeze.