Update of the beloved diagram
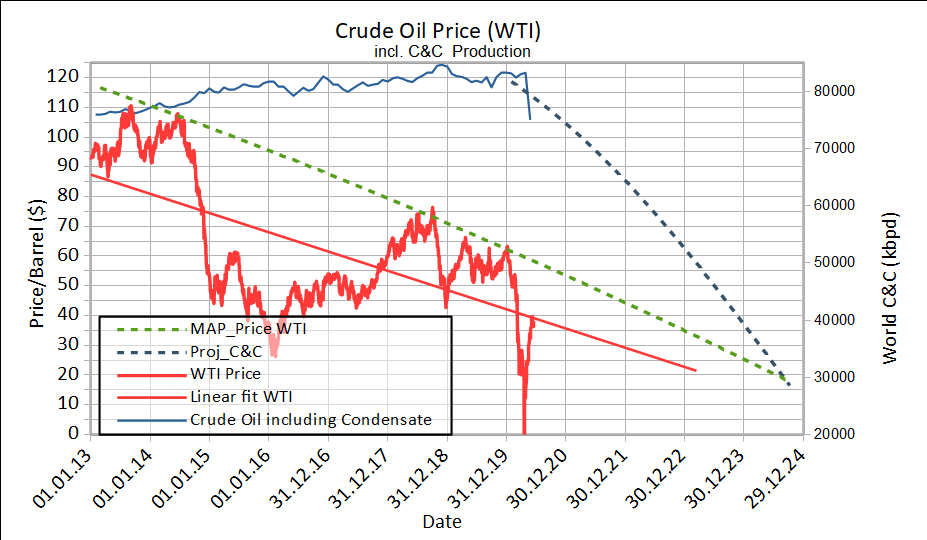
The oil price is still too low for SA and OPEC+. They are forced to continue the reductions.
Exploring Hydrocarbon Depletion
https://peakoil.com/forums/
https://peakoil.com/forums/mid-year-etp-map-update-pt-2-t77607-40.html
BahamasEd wrote:The problem is we can no longer afford to pay for the extraction of fossil fuels, oil, coal and natural gas along with the refining and transport to the end user.
The problem is we can no longer afford to pay for the extraction of fossil fuels, oil, coal and natural gas along with the refining and transport to the end user.
Outcast_Searcher wrote:BahamasEd wrote:The problem is we can no longer afford to pay for the extraction of fossil fuels, oil, coal and natural gas along with the refining and transport to the end user.
Spouting the same nonsense endlessly makes it NO MORE true.
Worse yet, anyone can stand at a corner convenience store and watch folks come in and prove it to themselves as nonsense in 5 minutes. Here they come...buy some fuel...there they go.
Baduila wrote:
The oil price is still too low for SA and OPEC+. They are forced to continue the reductions.
tita wrote:I thought the MAP_Price was something around $19 at this date. Now the ETP crowd just change the data to fit their fucked-up theory to the reality??
You should be ashamed to put bullshit TA finance analysis as anything near to prove your point.
asg70 wrote:tita wrote:I thought the MAP_Price was something around $19 at this date. Now the ETP crowd just change the data to fit their fucked-up theory to the reality??
You should be ashamed to put bullshit TA finance analysis as anything near to prove your point.
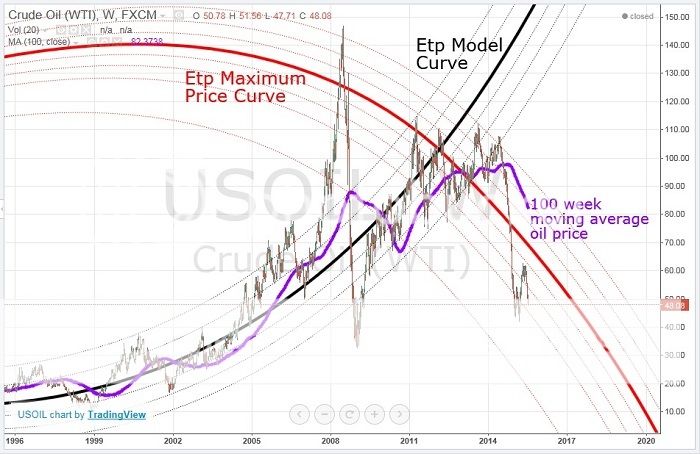
For the record, anyone remember when was the map price was supposed to hit $0 back when ETP was first being flogged here? That was at least two maybe three years ago when ETP was a "thing" and I could have sworn the doomsday 0 date was only 2-3 years off so it has to be around now.

tita wrote:Baduila wrote:
The oil price is still too low for SA and OPEC+. They are forced to continue the reductions.
WTF is this line you call MAP_Price? I see a price of $60 in the end of 2020.
I thought the MAP_Price was something around $19 at this date. Now the ETP crowd just change the data to fit their fucked-up theory to the reality??
You should be ashamed to put bullshit TA finance analysis as anything near to prove your point.

 (Presumably, this line predicted the WTI price if supply / demand continues normally in a non-collapsed economy).
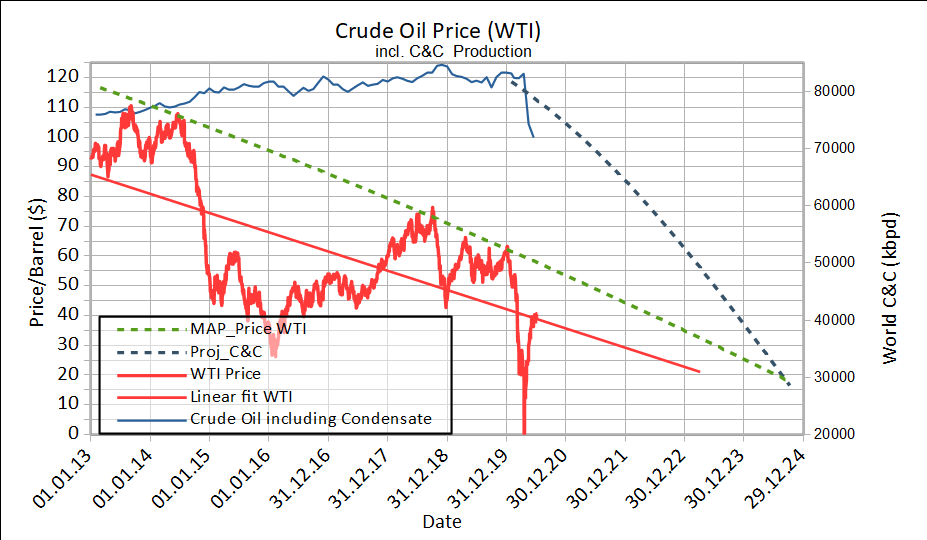
Baduila wrote:Two extrapolations based on physics in one diagram.
Baduila wrote:This link should work:
https://limitstogrowth.de/wp-content/uploads/2020/01/Mar_2020_Thermo_EN_09.pdf
Baduila wrote:
Real price and real production both follow the projections. The oil production in the US has fallen by 3000000 bbl/d, most of the reduction is LTO. Because LTO production is heavily energy consuming, the demand for oil has decreased nearly by the same amount.

Baduila wrote:
Real price and real production both follow the projections. The oil production in the US has fallen by 3000000 bbl/d, most of the reduction is LTO. Because LTO production is heavily energy consuming, the demand for oil has decreased nearly by the same amount.
asg70 wrote:This dead horse has been beaten so much by now I'm surprised anyone still cares, even if it's just to mock Short.
AdamB wrote:asg70 wrote:This dead horse has been beaten so much by now I'm surprised anyone still cares, even if it's just to mock Short.
Were you watching when the switch-a-roo happened to change the claim from $0/bbl a few years back to a different answer now happened? Or did Shorty and Co. just "pull a Trump" as it were, and gaslight the thing into existence one afternoon while ignoring the need to explain?