Page 23 of 24

Re: The Methane Thread pt. 2

Unread postPosted: Sat 06 Aug 2022, 16:00:11
by Tanada

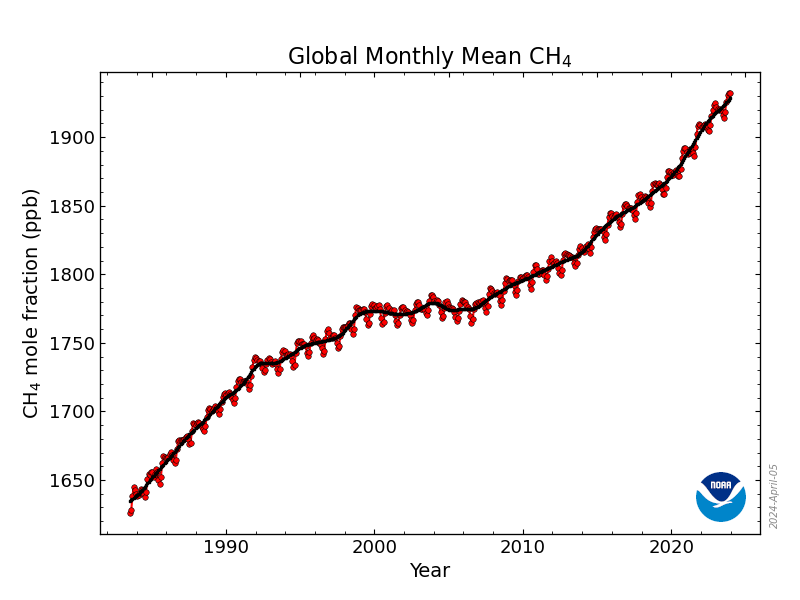
April 2022: 1909.9 ppb
April 2021: 1891.2 ppb

Image

Re: The Methane Thread pt. 2

Unread postPosted: Mon 03 Oct 2022, 00:12:21
by Tanada

May 2022: 1908.74 ppb
May 2021: 1891.62 ppb

Image

Re: The Methane Thread pt. 2

Unread postPosted: Tue 11 Oct 2022, 09:33:00
by Tanada

June 2022: 1906.11 ppb
June 2021: 1888.47 ppb

Image

Re: The Methane Thread pt. 2

Unread postPosted: Sun 16 Oct 2022, 23:05:16
by Plantagenet
I'll be curious to see how big a blip we get in the atmosphere methane number after the huge leak from the Nordstream pipeline sabotage

This was the largest methane leak ever seen.....but was it large enough to show up in the global atmosphere data?

nord-stream-leak-may-have-been-largest-methane-emission-ever-recorded

Image

Cheers!

Re: The Methane Thread pt. 2

Unread postPosted: Thu 01 Dec 2022, 22:25:54
by Tanada

July 2022: 1904.52 ppb
July 2021: 1886.37 ppb

Image

Re: The Methane Thread pt. 2

Unread postPosted: Sun 04 Dec 2022, 12:18:02
by Newfie
Tanad,

Do you have an opinion on how the Ukraine war will shape future nuclear development?

I can see various forces either increasing its use or making people more afraid. But I have no idea which will predominate.

Any thoughts?

Re: The Methane Thread pt. 2

Unread postPosted: Sun 04 Dec 2022, 13:01:57
by vtsnowedin
Newfie wrote:Tanad,

Do you have an opinion on how the Ukraine war will shape future nuclear development?

I can see various forces either increasing its use or making people more afraid. But I have no idea which will predominate.

Any thoughts?

Are you considering nuclear energy or nuclear weapons?

Re: The Methane Thread pt. 2

Unread postPosted: Sun 25 Dec 2022, 22:32:57
by Tanada

August 2022: 1908.61 ppb
August 2021: 1892.60 ppb

Image

Re: The Methane Thread pt. 2

Unread postPosted: Mon 13 Feb 2023, 18:18:03
by Tanada

September 2022: 1914.5 ppb
September 2021: 1900.5 ppb

Image

Re: The Methane Thread pt. 2

Unread postPosted: Mon 13 Feb 2023, 18:24:03
by Tanada

October 2022: 1920.34 ppb
October 2021: 1908.12 ppb

Image

Re: The Methane Thread pt. 2

Unread postPosted: Wed 15 Mar 2023, 14:22:23
by Tanada

November 2022: 1923.57 ppb
November 2021: 1909.73 ppb

Image

Re: The Methane Thread pt. 2

Unread postPosted: Fri 17 Mar 2023, 08:19:47
by Newfie
Plantagenet wrote:I'll be curious to see how big a blip we get in the atmosphere methane number after the huge leak from the Nordstream pipeline sabotage

This was the largest methane leak ever seen.....but was it large enough to show up in the global atmosphere data?

nord-stream-leak-may-have-been-largest-methane-emission-ever-recorded

Image

Cheers!


Appears not even visible


Maybe seen in some deep statistical analysis

Re: The Methane Thread pt. 2

Unread postPosted: Sun 26 Mar 2023, 20:10:50
by theluckycountry
This is a decent article, though it seems to omit methane from arctic tundra and undersea sources, which are quite substantial now the arctic has warmed so much.

Where methane comes from

About 600 million metric tons of methane are released into the atmosphere each year. Estimates suggest two-fifths of these emissions come from natural sources, mainly rotting vegetation in swamps. The remaining three-fifths of emissions come from sources tied to human activity.

Emissions from the fossil fuel industry are well over 100 million metric tons a year and grew rapidly in the 1980s. Natural gas, which in the UK heats homes and generates roughly half of electricity, is mainly methane.

Gas industry leaks are widespread at wells and pipelines and from distribution pipes under streets and home boilers. The coal industry was responsible for up to one-third of fossil fuel emissions between 2000 and 2017 via ventilation shafts in mines and during the transportation and crushing of coal for power stations.

Agriculture, producing about 150 million metric tons a year, is the largest overall source. As are urban landfills and sewage systems, contributing about 70 million metric tons annually.

Scientists can identify sources of methane by studying the proportion of carbon-12 to carbon-13 in the atmosphere. These different forms of carbon – chemically similar but with different masses – are known as isotopes.

Biogenic methane, made by microbes in rotting vegetation or in cow stomachs, is relatively rich in carbon-12, while methane from fossil fuels and fires has comparatively more carbon-13.

For two centuries, rapidly expanding gas, coal and oil industries steadily drove atmospheric methane richer in carbon-13. Since 2007, that trend has reversed, and the proportion of carbon-13 in atmospheric methane has decreased. Although fossil fuel emissions may still be growing, soaring methane emissions are now primarily the result of faster-growing biogenic sources.

Why are biogenic emissions growing?...

https://www.sciencealert.com/atmospheri ... that-means
Re: The Methane Thread pt. 2

Unread postPosted: Wed 26 Apr 2023, 20:03:30
by Tanada

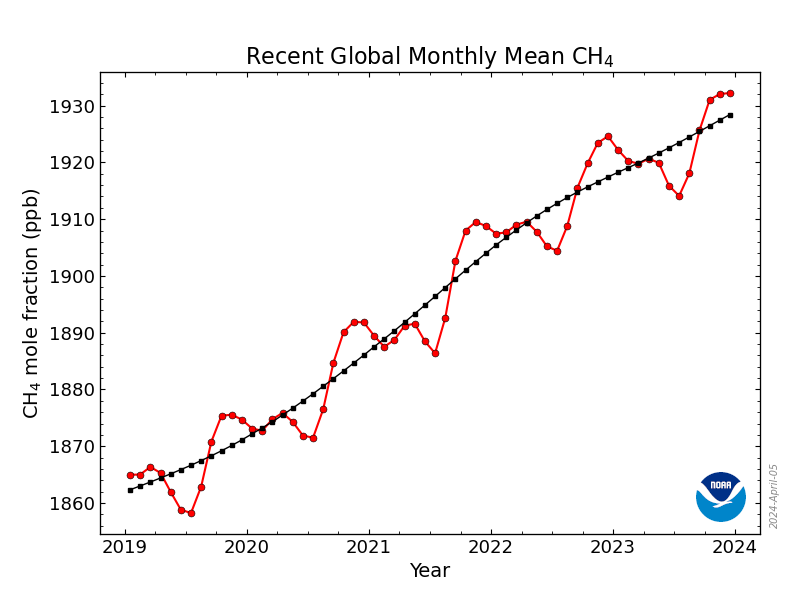
December 2022: 1924.99 ppb
December 2021: 1908.84 ppb

Image
Image

Re: The Methane Thread pt. 2

Unread postPosted: Wed 17 May 2023, 18:36:59
by Tanada

January 2023: 1921.74 ppb
January 2022: 1907.44 ppb

Image
Image

Re: The Methane Thread pt. 2

Unread postPosted: Sun 18 Jun 2023, 21:18:21
by Tanada

February 2023: 1919.97 ppb
February 2022: 1907.70 ppb

Image
Image

Re: The Methane Thread pt. 2

Unread postPosted: Wed 05 Jul 2023, 21:28:36
by Tanada

March 2023: 1920.74 ppb
March 2022: 1908.97 ppb

Image
Image

Re: The Methane Thread pt. 2

Unread postPosted: Sun 20 Aug 2023, 22:11:09
by Tanada

April 2023: 1922.20 ppb
April 2022: 1909.38 ppb

Image
Image

Re: The Methane Thread pt. 2

Unread postPosted: Fri 08 Sep 2023, 15:48:52
by Tanada

May 2023: 1922.26 ppb
May 2022: 1907.80 ppb

Image
Image

Re: The Methane Thread pt. 2

Unread postPosted: Sat 28 Oct 2023, 23:12:00
by Tanada

June 2023: 1917.11 ppb
June 2022: 1905.19 ppb

Image
Image