Page 1 of 10

Russia peaking - 20% decline by 2020?

Unread postPosted: Sat 23 Oct 2010, 15:55:53
by Pops
I can't find the report this article is quoting -
EIA says Russia has 60M barrels and is producing at 3.5M barrels per year -
so 25 years left at current production
so perhaps it is about at peak -
a 20% decline this decade would be about 2Mbbs/day...

Don't forget Russia in the Number One producer now (surpassing KSA this year) and has been producing flat out (I'm guessing of course) with no cutsie attempts to affect prices like our friends KSA.

Here from the Histon - Impington Courier (seriously) with the title: Peak Oil Confirmed!
One the one hand, Russia has officially passed Saudi Arabia as the world’s largest producer of oil. The announcement this week indicated that last year and this year saw a 1 percent rise in Russian oil output. Russia has long been considered as having one of the world’s largest reservoirs of the black gold. However, buried in an official report from Russia’s Energy Ministry was this bombshell: “it is clear that the country has no more than 25 per cent of its resources remaining to be extracted.” Furthermore, Russian Oil “production is expected to DROP 20% within the decade.” Russia has hit Peak Oil. So has Saudi Arabia - a fact known to oil insiders for over a decade.
Re: Russia peaking - 20% decline by 2020?

Unread postPosted: Sat 23 Oct 2010, 16:25:25
by Leutnant
Didn't find anything relating to this on Google News.

Re: Russia peaking - 20% decline by 2020?

Unread postPosted: Sat 23 Oct 2010, 20:57:04
by Pops
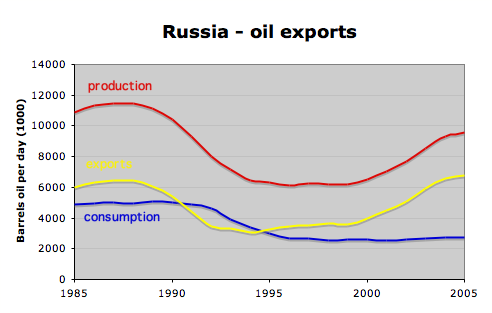
Haha, no wonder shorty gets confused with multiple peaks, as far as the world of the 21st century is concerned, Russia hasn't peaked, their exports are back up to 6.8Mbb/d and insulating us from KSAs problems.


Image

Russian Peak

Unread postPosted: Tue 15 Apr 2014, 08:10:45
by Pops
I've been saying for a while now that the only reason we didn't peak in 2000 (Hubbert anyone?) is that soviet (Russian) production was delayed for a decade - shifted from the 90's to the Oughies. And that their production is flattening out so probably close to peak.

Image

Matt Mushalik at CrudeOilPeak.info (the best PO reporter going, I think) is out with a post that argues the same, here is one chart he linked showing a fairly long trend of decline (originally from the IEA: http://omrpublic.iea.org/omrarchive/13m ... ullpub.pdf )

Image

He has a good collection of charts, read the whole thing:
http://crudeoilpeak.info/russia-peak

Re: Russian Peak

Unread postPosted: Tue 15 Apr 2014, 09:54:30
by Subjectivist
Pops wrote:I've been saying for a while now that the only reason we didn't peak in 2000 (Hubbert anyone?) is that soviet (Russian) production was delayed for a decade - shifted from the 90's to the Oughies. And that their production is flattening out so probably close to peak.

Image

Matt Mushalik at CrudeOilPeak.info (the best PO reporter going, I think) is out with a post that argues the same, here is one chart he linked showing a fairly long trend of decline (originally from the IEA: http://omrpublic.iea.org/omrarchive/13m ... ullpub.pdf )

Image

He has a good collection of charts, read the whole thing:
http://crudeoilpeak.info/russia-peak


This could explain why Putin is making his move on Crimea/Ukraine no rather than later. Now he has money, later he will not be an oil exporter and money will dry up except for natural gas. By controlling Crimea he increases his Natural Gas and if eastern Ukrain is the next frcking gas region he will want hat too.

Re: Russian Peak

Unread postPosted: Tue 15 Apr 2014, 09:59:08
by westexas
Following are links to my first and most recent articles on net oil exports.   The ECI (Export Capacity Index) ratio article is not yet updated with 2012 data (working on it right now).   In the January, 2006 Oil Drum article, I introduced the Export Land Model (ELM), which of course is just a simple mathematical model, and in the February, 2013 article, I introduced the ECI concept.

Hubbert Linearization Analysis of the Top Three Net Oil Exporters
January, 2006
http://www.theoildrum.com/story/2006/1/27/14471/5832

The Export Capacity Index (ECI)
February, 2013
http://peak-oil.org/2013/02/commentary- ... ity-index/

Here are the net export numbers for the (2005) Top Three net exporters (EIA) for 2002 to 2005 (Saudi Arabia, Russia, Norway, EIA total petroleum liquids + other liquids):

2002: 15.3 mbpd
2003: 17.2
2004: 18.1
2005: 18.6

In 2005, these three net exporters accounted for 41% of Global Net Exports of oil (GNE, Top 33 net exporters in 2005, EIA). In early 2006, I wrote my little essay that introduced the ELM concept, focusing on net exports from Saudi Arabia, Russia and Norway. This was my first, and fairly crude, effort at trying to use the logistic (HL) approach to try to model future net exports, and I was too pessimistic regarding short term Russian production (and I was too pessimistic to a lesser degree regarding short term Saudi production), but Russian net exports stopped growing in 2007, and Saudi net exports have remained below their 2005 rate for seven (and probably eight) straight years.

At the time I wrote this 1/06 essay, Top Three net exports were increasing at 6.5%/year, as global annual (Brent) crude oil prices doubled from $25 in 2002 to $55 in 2005. At a 6.5%/year rate of increase in net exports, combined net exports from the top three would approach 30 mbpd in 2012.


Here is an excerpt from the 1/06 article:

As predicted by Hubbert Linearization, two of the three top net oil exporters are producing below their peak production level.   The third country, Saudi Arabia, is probably on the verge of a permanent and irreversible decline.   Both Russia and Saudi Arabia are probably going to show significant increases in consumption going forward.  It would seem from this case that these factors could interact this year produce to an unprecedented--and probably permanent--net oil export crisis.


In the following seven years from 2005 to 2012, annual crude oil prices doubled again, from $55 in 2005 to $112 in 2012, with one year over year decline in 2009. In response, here are the combined net exports from Saudi Arabia, Russia and Norway (EIA):

2006: 18.0 mbpd
2007: 17.6
2008: 17.9
2009: 16.6
2010: 17.2
2011: 17.4
2012: 17.3

When we plug in some CNE (Cumulative Net Export) estimates, I estimate that Saudi Arabia, Russia and Norway may have collectively already shipped about 30% of their combined post-2005 CNE, through 2012.

Incidentally, (2005) top three production increased at a pretty rapid clip from 2002 to 2005 (5.9%/year). Even if we assume about 3%/year, which is consistent with what Yergin was predicting for the increase in global production in this time frame, top three net exports would have been close to 23 mbpd in 2012, assuming the same (2005 to 2012) rate of increase in consumption (3.7%/year). The actual rate of increase in production was basically zero, as top three production went from 23.6 mbpd in 2005 to 23.8 mbpd in 2012. Note that the above CNE estimate assumes perpetually flat production, which does not seem to be a likely outcome. When we plug in a more realistic production decline number, the post-2005 CNE estimate will fall significantly.

Re: Russian Peak

Unread postPosted: Tue 15 Apr 2014, 10:12:07
by westexas
Regarding Russia specifically, recent Russian net oil exports (total petroleum liquids + other liquids, EIA):

2002: 5.0 mbpd
2003: 5.8
2004: 6.5
2005: 6.7
2006: 6.9
2007: 7.2
2008: 6.9
2009: 7.0
2010: 7.1
2011: 7.1
2012: 7.2

Note the inflection point in 2007. Russia's ECI ratio (ratio of production to consumption) fell from 3.7 in 2007 to 3.3 in 2012. Based on the five year (2007 to 2012) rate of decline in their ECI ratio, a rough, but fairly consistent rule of thumb suggest that they will have shipped about half of their post-2007 CNE (Cumulative Net Exports) by the end of 2027.

Based on the ECI data, I estimate that Russia has already shipped about one-fifth of their post-2007 CNE, through the end of 2013.

Re: Russian Peak

Unread postPosted: Tue 15 Apr 2014, 10:32:12
by Ron Patterson
From the IEA: http://omrpublic.iea.org/omrarchive/13mar2013fullpub.pdf

FSU Crude Oil Exports in Million Barrels per Day

2012 .... 6.5
2013 .... 6.39
Nov-13 . 6.36
Dec-13 . 6.15
Jan-14 . 6.09

Re: Russian Peak

Unread postPosted: Wed 16 Apr 2014, 16:21:43
by steam_cannon
Subjectivist wrote:This could explain why Putin is making his move on Crimea/Ukraine no rather than later. Now he has money, later he will not be an oil exporter and money will dry up except for natural gas. By controlling Crimea he increases his Natural Gas and if eastern Ukrain is the next frcking gas region he will want hat too.
Exactly, he has the power to make a move now and it's down hill if he doesn't. Also the coast of Ukraine is an area with oil, so he's got plenty of reason to want to "free" Crimea.

Re: Russian Peak

Unread postPosted: Wed 16 Apr 2014, 17:26:02
by shortonoil
Here is a link to LukOil's field specs as of a few years ago. The weighted average (by production volume) gives an 87% water cut. Since many of these fields are the same vintage as most Russian fields, it is reasonable to assume that Russia has peaked.

http://www.lukoil.com/materials/doc/Dat ... art_03.pdf

As to why world conventional crude didn't peak until 2005, when Hubbert's curve indicated 2000 should have been the date, can be explained as a simple mathematical oversight. Between 1960 and 2000 the EIA followed a logistic curve, very closely. The deviation between the 1960 to 2000 EIA reported production of 744 Gb, and what a logistic curve produces is very close to zero (.06 Gb). As we show in Graph# 29 at our site, "PDF Normal & Skew" there is a slight deviation from the Normal logistic. The true function is a Skewed Logistic curve. We determined this by applying Quantile Statistics. At the time the EIA set up their model, Quantile Statistics was not available. It was a mathematical method that had not yet been invented.

Even though the skewness is quite small, it is enough to move the Peak forward by five years. The last 14 years of arguing over the Peak, resulted from a very small, but significant error in the original model. In our study we discuss the ramifications, and derivation of the skewed function in great detail. The EIA was only a tiny bit in error, and everyone followed. Hubbert's curve is alive and well!


http://www.thehillsgroup.org

Re: Russian Peak

Unread postPosted: Wed 16 Apr 2014, 17:49:38
by ROCKMAN
"As to why world conventional crude didn't peak until 2005, when Hubbert's curve indicated 2000 should have been the date, can be explained as a simple mathematical oversight" And there's an even easier explanation. Just like Hubbert's model for US peak his projections were only for those existing trends that have had a long development history at the time he constructed his model. His projection for future field discoveries was only for those trends and not others yet to be identified. The model he used didn't include any of the Deep Water trends. Nor did they include the horizontally drill and fractured shale trends because none of that production had been established when he made his models.

When one looks at the production history of the trends that Hubbert used to develop his US model he hit it right on the nose. Yes…we are producing more oil today…but not from the trends that he based his model upon. I haven’t seen it done but I suspect the same would hold true for his global model also: the trends he used to build that model have reached the level he projected. The addition trends, which weren’t used in his model, have been added to our current production.

It doesn’t matter how many times folks incorrectly restate what Hubbert said it won’t make it true: he wasn’t predicting how much oil the US or the world would be producing in the future. He was predicting how much oil would be produced from the existing trends he used in his model. No matter how many times a falsehood is repeated it will never make it true.

Re: Russian Peak

Unread postPosted: Wed 16 Apr 2014, 20:41:38
by peterjames
shortonoil wrote:Here is a link to LukOil's field specs as of a few years ago. The weighted average (by production volume) gives an 87% water cut. Since many of these fields are the same vintage as most Russian fields, it is reasonable to assume that Russia has only a tiny bit in error, and everyone followed. Hubbert's curve is alive and well!
http://www.thehillsgroup.org


Geez, they are some scary figures , especially when you look at the drops in production for each of the wells over the years. We certainly seem to be building up the cliff, so we have further to fall.

Re: Russian Peak

Unread postPosted: Thu 17 Apr 2014, 09:34:08
by radon1
http://rt.com/business/oil-field-astrak ... overy-948/

Mega oil field discovered in southern Russia

A new oil field with roughly 300 million tons of oil and 90 billion cubic meters of gas has been discovered in the Astrakhan region of Russia.

“The field’s reserves are unprecedented, this discovery confirms the high potential of the Astrakhan region in terms of these major discoveries,” Sergey Donskoy, Russia’s Natural Resources Minister said on Wednesday.

Re: Russian Peak

Unread postPosted: Thu 17 Apr 2014, 10:11:00
by Subjectivist
radon1 wrote:http://rt.com/business/oil-field-astrakhan-discovery-948/

Mega oil field discovered in southern Russia

A new oil field with roughly 300 million tons of oil and 90 billion cubic meters of gas has been discovered in the Astrakhan region of Russia.

“The field’s reserves are unprecedented, this discovery confirms the high potential of the Astrakhan region in terms of these major discoveries,” Sergey Donskoy, Russia’s Natural Resources Minister said on Wednesday.


Even if this report is 100% correct how long will it take to start producing this oil, and how fast will they be able to pump it out? If it takes a decade and comes out at under a million bbl/day then it will slow Russias decline and that is good for Russia. If it comes out in five years at two million a day it might push the Russian production peak up for a few years before the decline overtakes it from the older fields.

Re: Russian Peak

Unread postPosted: Thu 17 Apr 2014, 10:31:15
by yellowcanoe
radon1 wrote:
A new oil field with roughly 300 million tons of oil and 90 billion cubic meters of gas has been discovered in the Astrakhan region of Russia.

“The field’s reserves are unprecedented, this discovery confirms the high potential of the Astrakhan region in terms of these major discoveries,” Sergey Donskoy, Russia’s Natural Resources Minister said on Wednesday.


That may be a big oil field by todays standards but even if all 300 million tons can be recovered, it represents about one month of world oil consumption.

Re: Russian Peak

Unread postPosted: Thu 17 Apr 2014, 10:37:37
by radon1
Well, the good thing about this discovery was that it happened in an area which had already been very well explored, and which is a good location logistically, being European south plains.

The previous big discovery, Vanqor, ca 500m tons, was in an Eastern Siberia, which is remote and harsh. This one did not take too long to beging producing, and after the production commencement (and wrestling it from BP) it pushed Russia's total production to a new peak.

Re: Russian Peak

Unread postPosted: Fri 18 Apr 2014, 21:04:53
by TheDude
Meanwhile there's always that unconventional stuff: Lukoil, Total agree to work on Siberian Bazhenov shale oil-report | Energy & Oil | Reuters

Interfax also reported an unnamed Lukoil representative told it the company plans to extract some 100,000 tonnes of oil (733,000 barrels) at the Bazhenov formation this year. Reuters could not reach Lukoil on Saturday.


2kb/d, in other words. Gotta start somewhere. The initial Bakken production 10 years ago was mighty lean, too.

I read everything I can find on the Bazhenov. A formation the size of Texas and the GOM put together could bring more than a few barrels to market, even with really awful recovery rates. Of course if they flood the market tight oil itself won't be economical in the first place, but hey...