New High of Liquid Fuel Production?
But . . . but . . . but . . . this wasn't supposed to happen! 


LINK
LINK
Friday, December 10, 2010
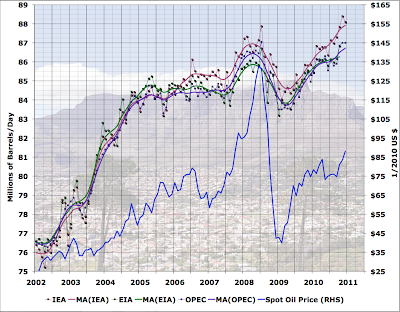
New High of Liquid Fuel Production
Both the IEA and OPEC are out with their new monthly reports today. And both report that oil production in November 2010 exceeded the previous high month of July 2008 (back when oil was $140). Probably the difference is within the margin of error, and in any case the third agency (the EIA) won't weigh in for a few months. At the moment, the average index looks like pretty much a statistical tie . . . Still, a significant point: not peak monthly oil just yet. As long as there isn't a massive financial crisis in the next few months (which is what happened to the last global high in oil production) I imagine we'll clearly exceed the July 2008 peak production. In particular, the point I first made here still holds: the increases in the last eighteen months have largely come from non-OPEC production rather than OPEC, and the latter undoubtedly still have some spare capacity that can be released (at a price). Thus production can and will go somewhat higher as long as demand continues to increase, which will be true as long as the global economy doesn't hit another big pothole.


 What difference? Why the price , that's what difference.Our economy is addicted to oil that is both abundant and cheap. As the share that conventional oil holds declines and expensive substitutes increase the net value we receive from burning liquid fuel declines.