Donate Bitcoin

Donate Paypal


PeakOil is You

PeakOil is You

Mid-Year ETP MAP Update Pt. 2

Discuss research and forecasts regarding hydrocarbon depletion.

Re: Mid-Year ETP MAP Update Pt. 2

Unread postby AdamB » Mon 24 May 2021, 16:13:57

aadbrd wrote:
Baduila wrote:Without comment.


Stop posting graphs without comment. If there's anything that's been communicated to you is that what seems obvious to you in these graphs is not obvious to others. Don't be lazy.


Or stupid. Or both at the same time. This poster still can't explain why the same method used to predict $0/bbl suddenly decided "oops...now was THAT stupid or what!" and presto! Different answer!
Plant Thu 27 Jul 2023 "Personally I think the IEA is exactly right when they predict peak oil in the 2020s, especially because it matches my own predictions."

Plant Wed 11 Apr 2007 "I think Deffeyes might have nailed it, and we are just past the overall peak in oil production. (Thanksgiving 2005)"
User avatar
AdamB
Volunteer
Volunteer
 
Posts: 9292
Joined: Mon 28 Dec 2015, 17:10:26

Re: Mid-Year ETP MAP Update Pt. 2

Unread postby Roxy » Tue 25 May 2021, 12:01:49

Whoever predicated oil would go to zero must have been a genius. About a year ago it did go to zero and even all the way down to minus $43.
Roxy
Wood
Wood
 
Posts: 24
Joined: Thu 20 Nov 2014, 20:23:37

Re: Mid-Year ETP MAP Update Pt. 2

Unread postby AdamB » Tue 25 May 2021, 13:53:51

Roxy wrote:Whoever predicated oil would go to zero must have been a genius. About a year ago it did go to zero and even all the way down to minus $43.


The author has claimed the numbers output from his method were yearly averages. Sorry, no genius involved, just run of the mill dumbassery.
Plant Thu 27 Jul 2023 "Personally I think the IEA is exactly right when they predict peak oil in the 2020s, especially because it matches my own predictions."

Plant Wed 11 Apr 2007 "I think Deffeyes might have nailed it, and we are just past the overall peak in oil production. (Thanksgiving 2005)"
User avatar
AdamB
Volunteer
Volunteer
 
Posts: 9292
Joined: Mon 28 Dec 2015, 17:10:26

Re: Mid-Year ETP MAP Update Pt. 2

Unread postby Outcast_Searcher » Wed 26 May 2021, 10:28:57

Roxy wrote:Whoever predicated oil would go to zero must have been a genius. About a year ago it did go to zero and even all the way down to minus $43.

When a SINGLE pricing FLUKE due to a futures contract requirement in the short term has ANY meaning re what it costs consumers on average to buy gasoline, diesel, etc. over the course of a year, be sure and get back to us.

As it it, unless your comment was sarcastic, it was silly at best.

(Looking back at your comment history, you were apparently serious. :roll:
I can see that trying to talk to you would be like trying to talk to short. Good luck in life, being immune to math, logic, facts, etc).

ETP, as it was framed and preached, has been shown to be total nonsense over time.

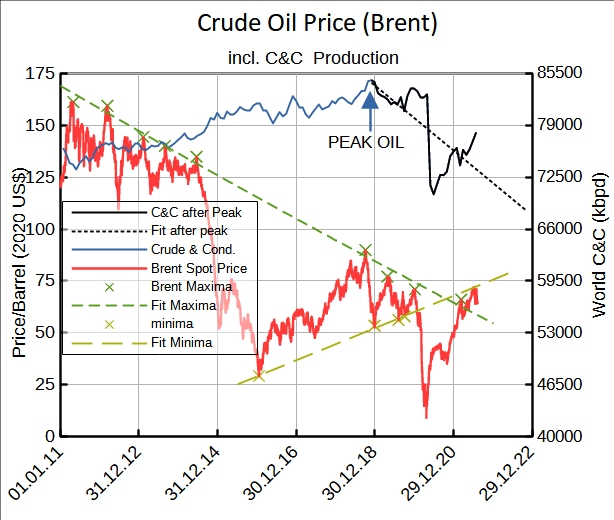
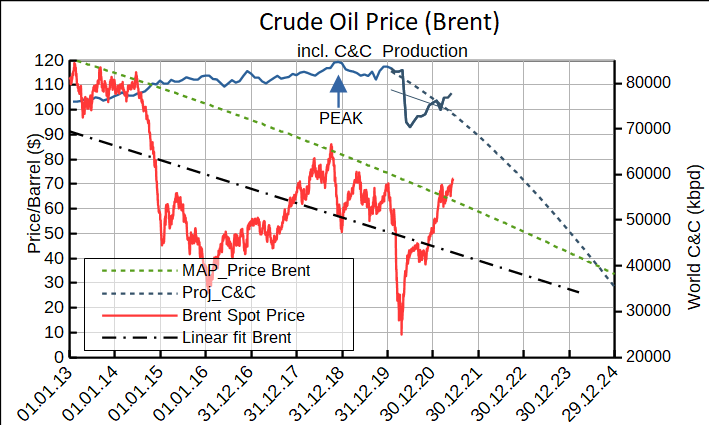
Oil (i.e. WTI) is NOT moving anywhere toward zero price over the course of a year, even in an economy that is moving away from it as a trend for ground transport. It's already mid-2021, and it was supposed to be at about $2 by year end. Case closed to anyone with eyes to see and a brain to think. For context, WTI has roughly doubled in the past year, and it's been roughly holding in the mid $60's on average for well over 2 months now.
Given the track record of the perma-doomer blogs, I wouldn't bet a fast crash doomer's money on their predictions.
User avatar
Outcast_Searcher
COB
COB
 
Posts: 10142
Joined: Sat 27 Jun 2009, 21:26:42
Location: Central KY

Re: Mid-Year ETP MAP Update Pt. 2

Unread postby aadbrd » Wed 26 May 2021, 15:50:18

The only value this thread has is a case-study in how a small number of people refuse to let go of their world-view now matter how obviously wrong it is revealed to be.
User avatar
aadbrd
Permanently Banned
 
Posts: 510
Joined: Sat 26 Dec 2020, 16:09:06

Re: Mid-Year ETP MAP Update Pt. 2

Unread postby Outcast_Searcher » Sun 30 May 2021, 10:47:23

aadbrd wrote:The only value this thread has is a case-study in how a small number of people refuse to let go of their world-view now matter how obviously wrong it is revealed to be.

Actually, I've noticed over the past year how Seeking Alpha is often an example of that principle for virtually any popular stock.

Bulls are bulls and bears are bears, and all facts can be hand waved away.

The proportion of posters on stock X who are insistent that their stock will provide them outsized gains real soon now, month after month, because they like the stock, is amazing, IMO. You'd think statistics didn't exist or economic reality didn't matter and stock market and economic history didn't exist.

So on this topic, it's a small number. But for economics in general, at least for the stock market, it seems to be a rather large number.
Given the track record of the perma-doomer blogs, I wouldn't bet a fast crash doomer's money on their predictions.
User avatar
Outcast_Searcher
COB
COB
 
Posts: 10142
Joined: Sat 27 Jun 2009, 21:26:42
Location: Central KY

Re: Mid-Year ETP MAP Update Pt. 2

Unread postby aadbrd » Tue 01 Jun 2021, 21:06:25

I wonder how much longer this thread will limp its way forward if oil prices keep rising...
User avatar
aadbrd
Permanently Banned
 
Posts: 510
Joined: Sat 26 Dec 2020, 16:09:06

Re: Mid-Year ETP MAP Update Pt. 2

Unread postby Baduila » Sun 20 Jun 2021, 05:29:28

How many trillions of dollars are the US corona stimulus packackes up to now ? Three ? Four ?

At least, they have the effects, that the the value of the US dollar is falling and the inflation is rising.
Without inflation correction the updated diagram is this:
Image

Has anybody subscribed to shadowstats and access to inflation data (value below the green bar)?
http://www.shadowstats.com/inflation_calculator
Image Take care of the second law.
Baduila
Peat
Peat
 
Posts: 172
Joined: Fri 26 Jun 2015, 12:44:17

Re: Mid-Year ETP MAP Update Pt. 2

Unread postby AdamB » Sun 20 Jun 2021, 10:17:19

Baduila wrote:Without inflation correction the updated diagram is this:
Image


So...mid-year update is....stupid idea is still stupid. Got it. Might I recommend recycling some part of the idea so it doesn't remain a stupid idea?
Plant Thu 27 Jul 2023 "Personally I think the IEA is exactly right when they predict peak oil in the 2020s, especially because it matches my own predictions."

Plant Wed 11 Apr 2007 "I think Deffeyes might have nailed it, and we are just past the overall peak in oil production. (Thanksgiving 2005)"
User avatar
AdamB
Volunteer
Volunteer
 
Posts: 9292
Joined: Mon 28 Dec 2015, 17:10:26

Re: Mid-Year ETP MAP Update Pt. 2

Unread postby Outcast_Searcher » Mon 21 Jun 2021, 14:53:23

Baduila wrote:Without inflation correction the updated diagram is this:
Image

Meanwhile in the real world of data and markets, WTI is pushing toward $75 as we speak, up nearly 2% on the day.

How does the performance of WTI in 2021 IN ANY WAY support the ETP idea that oil will be nearly worthless in 6 months?

Hint: It doesn't, no matter how much you try to skew things.
Given the track record of the perma-doomer blogs, I wouldn't bet a fast crash doomer's money on their predictions.
User avatar
Outcast_Searcher
COB
COB
 
Posts: 10142
Joined: Sat 27 Jun 2009, 21:26:42
Location: Central KY

Re: Mid-Year ETP MAP Update Pt. 2

Unread postby Baduila » Fri 09 Jul 2021, 14:09:36

Because inflation now is so high, i have to use 2020 dollars for the oil price to get decent curves.

Image

For people not aware of the old posts of this thread:
-The green dotted line displays the maximum oil price the world economy can tolerate.
-The blue dotted line displays the minimum oil price OPEC can tolerate.

Both lines have crossed in 2020.
Today, OPEC is stronger.
Image Take care of the second law.
Baduila
Peat
Peat
 
Posts: 172
Joined: Fri 26 Jun 2015, 12:44:17

Re: Mid-Year ETP MAP Update Pt. 2

Unread postby AdamB » Fri 09 Jul 2021, 15:19:19

Baduila wrote:Because inflation now is so high, i have to use 2020 dollars for the oil price to get decent curves.


Quite scientific. All the topnotch scientists change underlying data to make sure their models deliver the answer they want.

:lol: :lol: :lol: :lol:

Baduila wrote:For people not aware of the old posts of this thread:


For those people..you haven't missed anything.

Baduila wrote:-The blue dotted line displays the minimum oil price OPEC can tolerate.
Today, OPEC is stronger.


Pretty cool! I love a minimum price OPEC can tolerate without..you know...information on what minimum price OPEC can tolerate. Quick Baduila, change the underlying data again! Inflation went down this afternoon!
Plant Thu 27 Jul 2023 "Personally I think the IEA is exactly right when they predict peak oil in the 2020s, especially because it matches my own predictions."

Plant Wed 11 Apr 2007 "I think Deffeyes might have nailed it, and we are just past the overall peak in oil production. (Thanksgiving 2005)"
User avatar
AdamB
Volunteer
Volunteer
 
Posts: 9292
Joined: Mon 28 Dec 2015, 17:10:26

Re: Mid-Year ETP MAP Update Pt. 2

Unread postby Outcast_Searcher » Sat 10 Jul 2021, 15:33:46

AdamB wrote:
Baduila wrote:Because inflation now is so high, i have to use 2020 dollars for the oil price to get decent curves.


Quite scientific. All the topnotch scientists change underlying data to make sure their models deliver the answer they want.

:lol: :lol: :lol: :lol:

Baduila wrote:For people not aware of the old posts of this thread:


For those people..you haven't missed anything.

Baduila wrote:-The blue dotted line displays the minimum oil price OPEC can tolerate.
Today, OPEC is stronger.


Pretty cool! I love a minimum price OPEC can tolerate without..you know...information on what minimum price OPEC can tolerate. Quick Baduila, change the underlying data again! Inflation went down this afternoon!

By comparison he makes the thought processes and use of logic by 9 year olds look good, so there's that.
Given the track record of the perma-doomer blogs, I wouldn't bet a fast crash doomer's money on their predictions.
User avatar
Outcast_Searcher
COB
COB
 
Posts: 10142
Joined: Sat 27 Jun 2009, 21:26:42
Location: Central KY

Re: Mid-Year ETP MAP Update Pt. 2

Unread postby tita » Fri 16 Jul 2021, 13:50:52

Outcast_Searcher wrote:
aadbrd wrote:The only value this thread has is a case-study in how a small number of people refuse to let go of their world-view now matter how obviously wrong it is revealed to be.

Actually, I've noticed over the past year how Seeking Alpha is often an example of that principle for virtually any popular stock.

Bulls are bulls and bears are bears, and all facts can be hand waved away.


Indeed. There is basically just stories of "What is going to happen in not so distant future", and deep irrationnal faith.
User avatar
tita
Coal
Coal
 
Posts: 418
Joined: Fri 10 Jun 2005, 03:00:00

Re: Mid-Year ETP MAP Update Pt. 2

Unread postby Baduila » Mon 19 Jul 2021, 11:06:33

Image

Oil Price and C&C Production with trend lines.
The price trend gets very volatile, but i assume the production trend gets more stabile.
Image Take care of the second law.
Baduila
Peat
Peat
 
Posts: 172
Joined: Fri 26 Jun 2015, 12:44:17

Re: Mid-Year ETP MAP Update Pt. 2

Unread postby Baduila » Mon 19 Jul 2021, 11:08:39

Price is in 2020-US-Dollars
Image Take care of the second law.
Baduila
Peat
Peat
 
Posts: 172
Joined: Fri 26 Jun 2015, 12:44:17

Re: Mid-Year ETP MAP Update Pt. 2

Unread postby Outcast_Searcher » Mon 19 Jul 2021, 16:56:53

Baduila wrote:Price is in 2020-US-Dollars

ANY dollars beyond, say, 2008, $70+ for WTI (which is what it's been for months) is SO FAR AWAY from the roughly $2 that ETP predicts is so NONSENSICAL, that the fact that you continue to support ETP is laughable.

But continue. That's what you do, logic, facts, or credibility or not.
Given the track record of the perma-doomer blogs, I wouldn't bet a fast crash doomer's money on their predictions.
User avatar
Outcast_Searcher
COB
COB
 
Posts: 10142
Joined: Sat 27 Jun 2009, 21:26:42
Location: Central KY

Re: Mid-Year ETP MAP Update Pt. 2

Unread postby AdamB » Mon 19 Jul 2021, 16:59:28

Baduila wrote:The price trend gets very volatile, but i assume the production trend gets more stabile.


Your trends are wildly entertaining for sure, but if puerile is what you do best, then knock yourself out.
Plant Thu 27 Jul 2023 "Personally I think the IEA is exactly right when they predict peak oil in the 2020s, especially because it matches my own predictions."

Plant Wed 11 Apr 2007 "I think Deffeyes might have nailed it, and we are just past the overall peak in oil production. (Thanksgiving 2005)"
User avatar
AdamB
Volunteer
Volunteer
 
Posts: 9292
Joined: Mon 28 Dec 2015, 17:10:26

Re: Mid-Year ETP MAP Update Pt. 2

Unread postby Baduila » Thu 19 Aug 2021, 04:41:18

The oil price is somewhere between the minimum OPEC can tolerate (dark yellow line) and the maximum the world economy (green line) can tolerate.

Too low for Saudi Arabia and OPEC. Too high for the world economy.

You can see the 2nd law of thermodynamics working. Has any one of the trolls ever succeeded to understand the steady state entropy rate balance for control volumes ? And the consequences for oil production exergy ?

Image
Image Take care of the second law.
Baduila
Peat
Peat
 
Posts: 172
Joined: Fri 26 Jun 2015, 12:44:17

Re: Mid-Year ETP MAP Update Pt. 2

Unread postby Roxy » Thu 19 Aug 2021, 04:51:26

Thanks Baduila, always look forward to seeing your monthly update.
Roxy
Wood
Wood
 
Posts: 24
Joined: Thu 20 Nov 2014, 20:23:37

PreviousNext

Return to Peak oil studies, reports & models

Who is online

Users browsing this forum: No registered users and 25 guests

cron