In a February, 2013 article, titled “The Export Capacity Index (ECI):A New Metric For Predicting Future Supplies of Global Net Oil Exports,” I summarized recent global production and net export data, and I introduced what I call the Export Capacity Index (ECI), which is the sum of total petroleum liquids + other liquids production (per EIA definition) divided by liquids consumption for an oil exporting country. Net Oil Exports are defined as Total petroleum liquids + other liquids production less liquids consumption (EIA).
In the ECI article, I also reviewed what I called the Export Land Model (ELM), which is a simple mathematical model which examines what happens to net oil exports, given increasing internal consumption versus an ongoing decline in production in a net oil exporting country.
Based on the ELM, we can conclude that given an ongoing production decline in a net oil exporting country, unless they cut their internal consumption at the same rate as the rate of decline in production, or at a faster rate, the resulting net export decline rate will exceed the production decline rate, and the net export decline rate will accelerate with time.
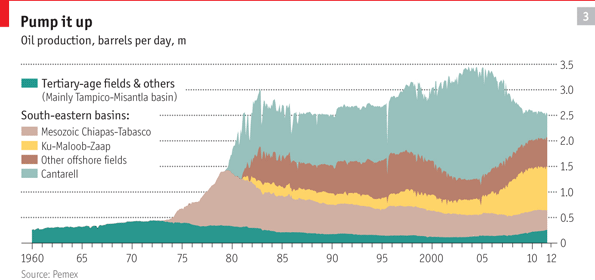
Mexico’s production peaked in 2004 at 3.83 mbpd (million barrels per day, as defined above). Their 2004 liquids consumption was 2.07 mbpd, resulting in 2004 net exports of 1.76 mbpd.
Their initial 2004 to 2005 rate of change in production was -1.7%, and their initial rate of change in consumption was +2.2%/year, resulting in a 2004 to 2005 net export rate of change of -6.7%/year. In simple percentage terms, a 1.7% decline in production, plus rising consumption, resulted in a 6.4% decline in net oil exports, from 2004 to 2005.
Their 2004 to 2012 rate of change in production was -3.4%/year, and their rate of change in consumption was +0.7%/year, resulting in a 2004 to 2012 rate of change in net oil exports of -11.1%/year. In simple percentage terms, a 24% decline in production, plus rising consumption, resulted in a 59% decline in net oil exports, from 2004 to 2012, with net oil exports falling from 1.76 mbpd in 2004 to 0.72 mbpd in 2012.
The rate of change in their ECI ratio, the ratio of liquids production to liquids consumption, fell from 1.8 in 2004 to 1.3 in 2012 (at an ECI ratio of 1.0, net oil exports would be zero). At the 2004 to 2012 rate of decline in Mexico’s ECI ratio, they would approach zero net oil exports in about six years, around the year 2019.
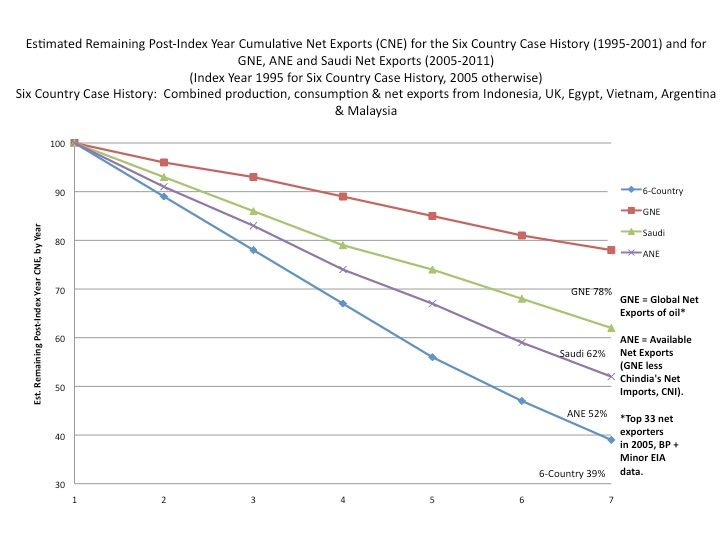
Based on the 2004 to 2012 rate of decline in Mexico’s ECI ratio, their estimated post-2004 Cumulative Net Exports of oil (CNE) are about 4.2 Gb (billion barrels). They shipped a total of 3.2 Gb in net exports from 2005 to 2012 inclusive, which suggests that Mexico’s post-2004 CNE are already about three-fourths depleted, which would be a post-2004 CNE depletion rate of about 18%/year through 2012, i.e., the rate at which Mexico is depleting their post-2004 cumulative supply of net oil exports. This is completely consistent with what we have seen in other regions, e.g., Indonesia, as they approached zero net oil exports. Note that Mexico was the third largest supplier of net crude oil imports into the US in 2012 (EIA).
Mexico’s net export decline was a contributor to the regional post-2004 decline we have seen in net oil exports. The seven major Western Hemisphere net oil exporters in 2004 were Canada, Mexico, Venezuela, Trinidad & Tobago, Colombia, Argentina and Ecuador, i.e., countries with in the Western Hemisphere with net oil exports of 100,000 bpd or more in 2004. Their combined net oil exports fell from 5.9 mbpd in 2004 to 5.0 mbpd in 2012 (EIA). In other words, rising net oil exports from Canada have only served to slow the overall post-2004 regional decline in net oil exports.
Link to ECI article (Using BP + EIA data):
http://peak-oil.org/2013/02/commentary-the-export-capacity-index/Jeffrey J. Brown


 Maybe they're rallying around that flag on talk radio these days again, wouldn't surprise me.