

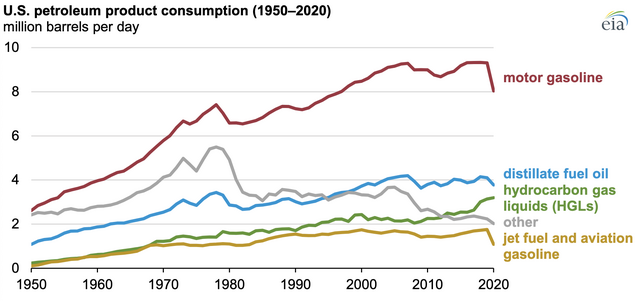
Renewables account for most new U.S. electricity generating capacity in 2021
developers and power plant owners plan for 39.7 gigawatts (GW) of new electricity generating capacity to start commercial operation in 2021. Solar will account for the largest share of new capacity at 39%, followed by wind at 31%,[ natural gas at 16%, and batteries at 11%.]
EIA expects the capacity of utility-scale battery storage to more than quadruple; 4.3 GW of battery power capacity additions are slated to come online by the end of 2021. The rapid growth of renewables, such as wind and solar, is a major driver in the expansion of battery capacity because battery storage systems are increasingly paired with renewables. The world's largest solar-powered battery (409 MW) is under construction at Manatee Solar Energy Center in Florida; the battery is scheduled to be operational by late 2021.

This follows a similar pattern to last year where 2020 saw the US add over 7x as much capacity in wind and solar compared to fossil fuels.
Meanwhile, 3.8 GW of fossil fuel capacity is retiring in 2021. 6 GW of fossil fuel capacity retired in 2020 and 14 GW of fossil fuel capacity retired in 2019.


