Peak Oil is You

Donate Bitcoins ;-) or Paypal :-)
Page added on August 16, 2017
Oil To $100? Deja Vu A Decade Later
Summary
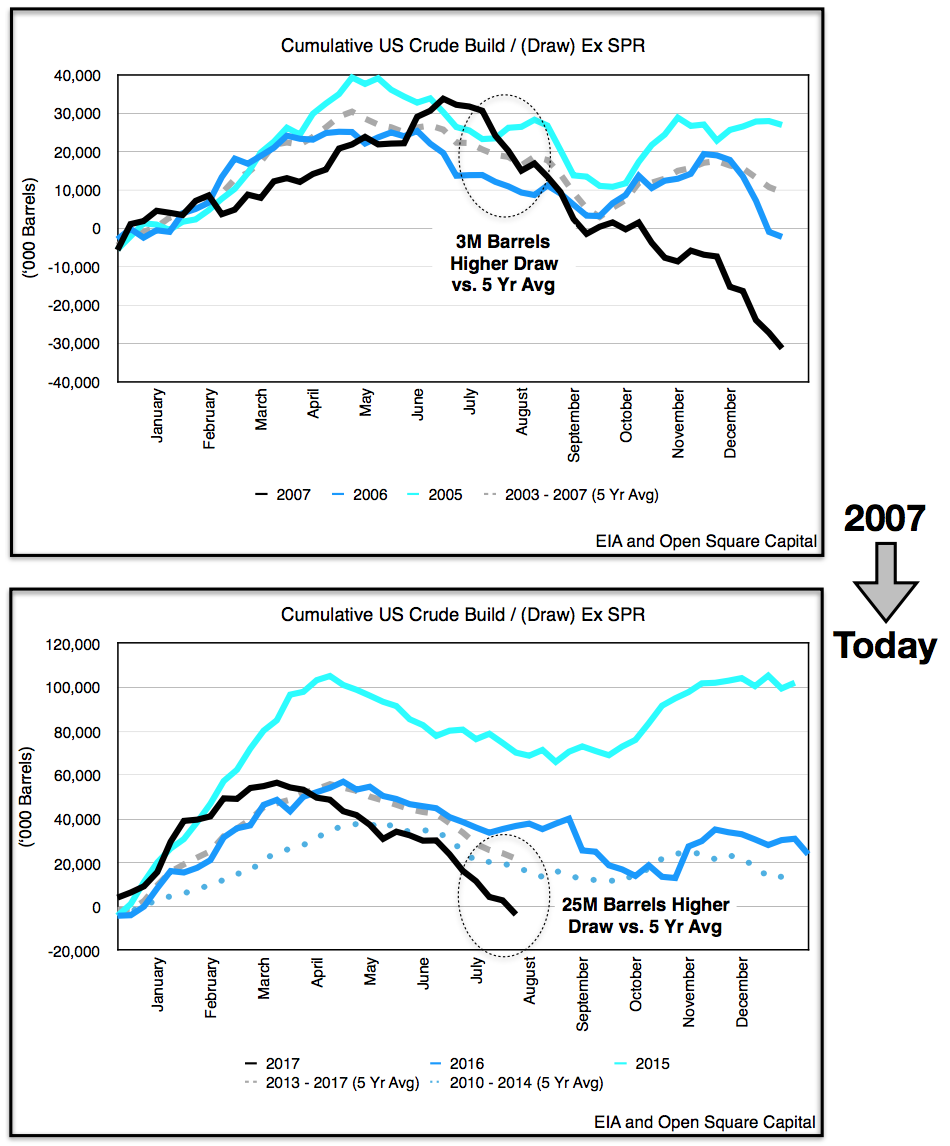
We revisit 2007, the year before oil prices leaped above $100/barrel.
Worldwide excess inventories today are 2.5x higher than in 2007.
US total stock are drawing 3x higher today than 2007, and could accelerate as we head into H2 2017.

Call us intrigued. Goehring and Rozencwajg had previously called for $100/barrel oil by 2018 because they contend that 2017 is setting up to be a repeat of 2006/7 where an undersupply of oil was exacerbated by a later OPEC cut. By December 2007, oil inventories hit the 5-year average, and projected shortages in 2008 and onward set up the run for oil to quickly reach triple-digits by mid-2008. Catnip for oil bulls no doubt, but let’s just take a look at what oil stocks looked like then and what they look like today.
OECD Inventories
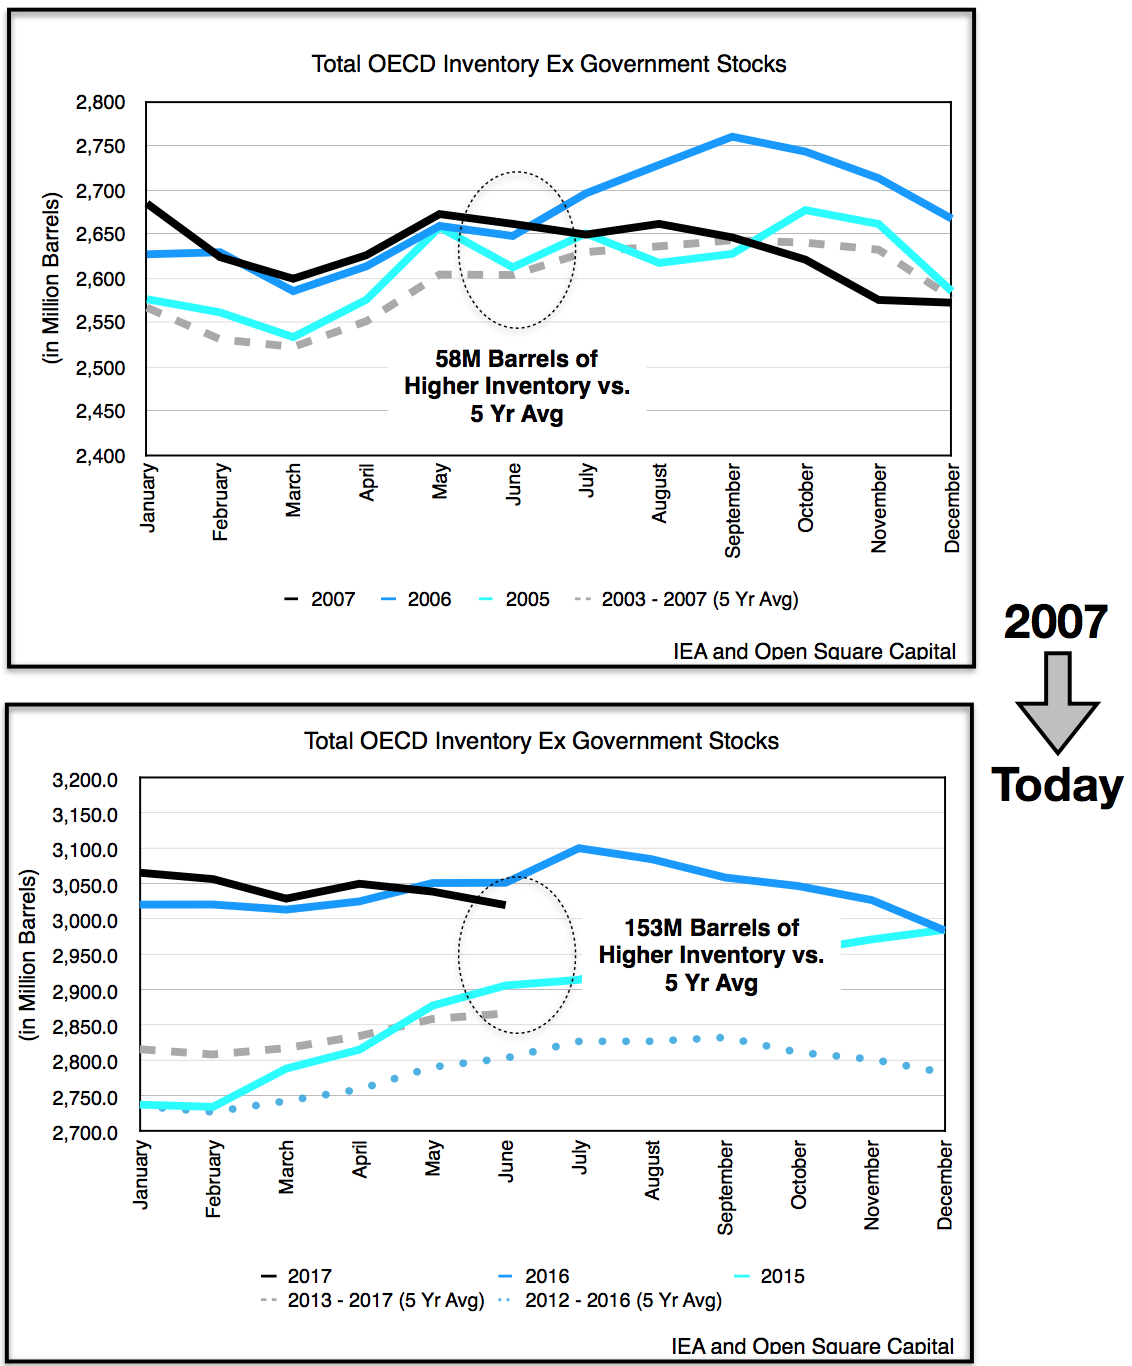
First off, total worldwide OECD inventories were about 10% lower a decade ago. Looking at IEA data from June of 2007, total OECD inventories (both crude and oil products) were 58M barrels above the 5-year average. In a few more months (by September of that year), the excess would be eliminated. Today, the oil picture is much different. Excess oil stocks are almost 2.5x higher than the 5-year average at 153M barrels. Although demand today at 98M bpd is close to 15% higher the 86M bpd in 2007, the oil market certainly has its work cut out for it.
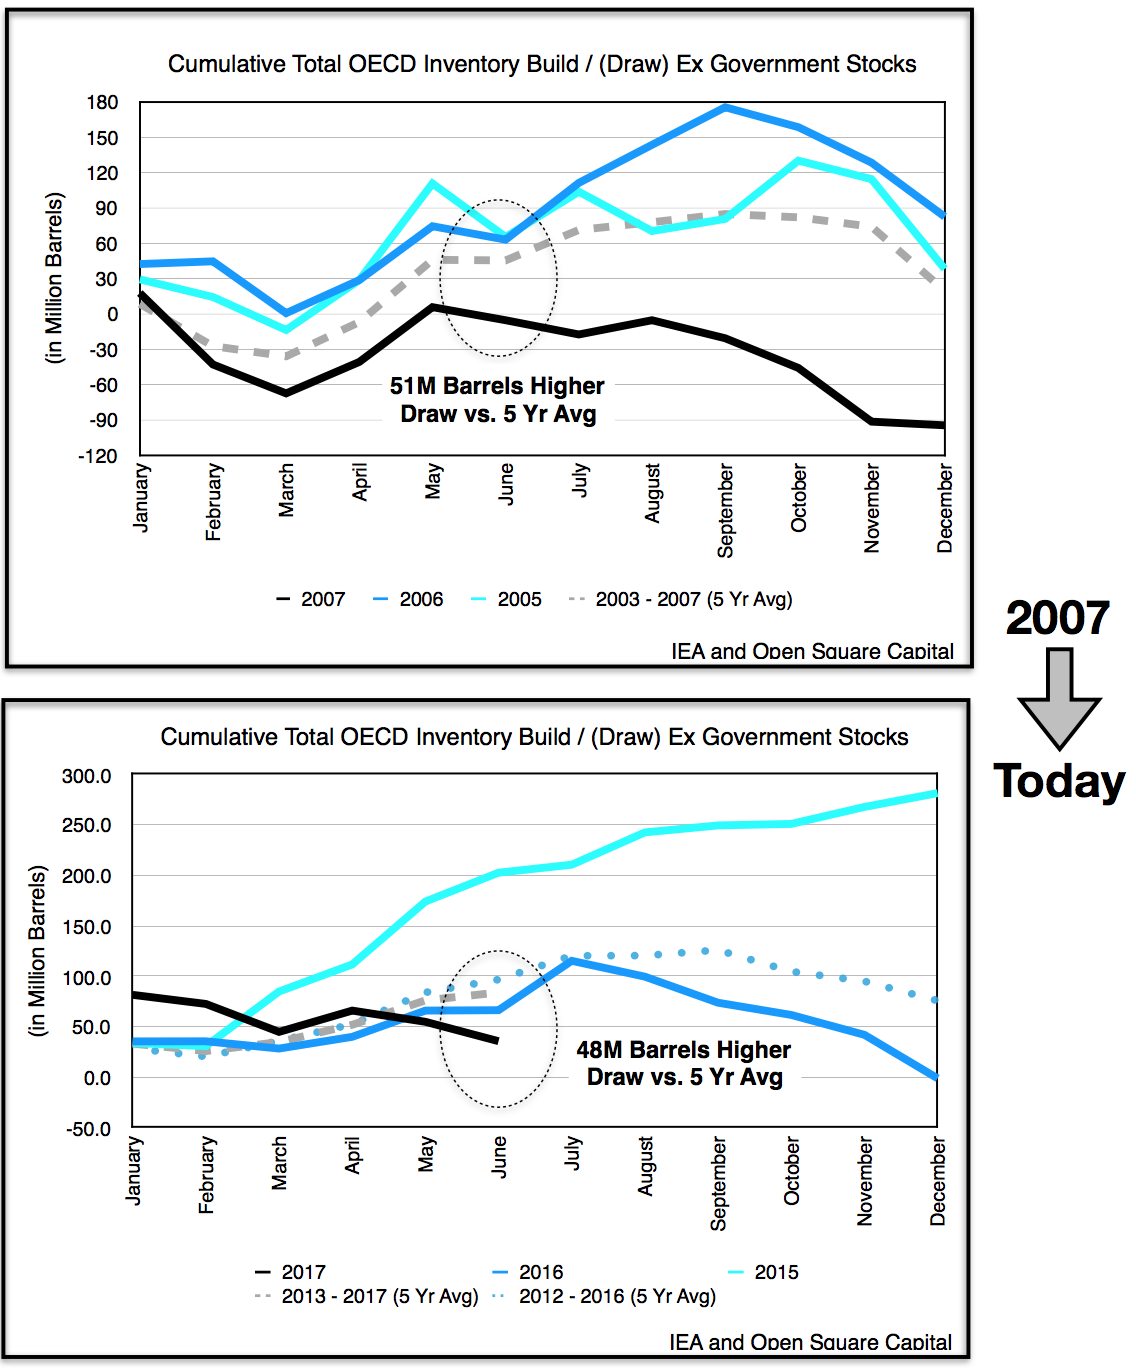
So what about draws? Well, fairly close. In 2007, draws were 51M barrels higher than the 5-year average, so inventory drawdowns were accelerating. In contrast to today, the draws (as of IEA’s June data) are slightly less (at 48M barrels higher vs. the 5-year average). Yet, because of the elevated inventory levels we noted above, the inventory draws would need to be even higher to rebalance the market.
US Inventories
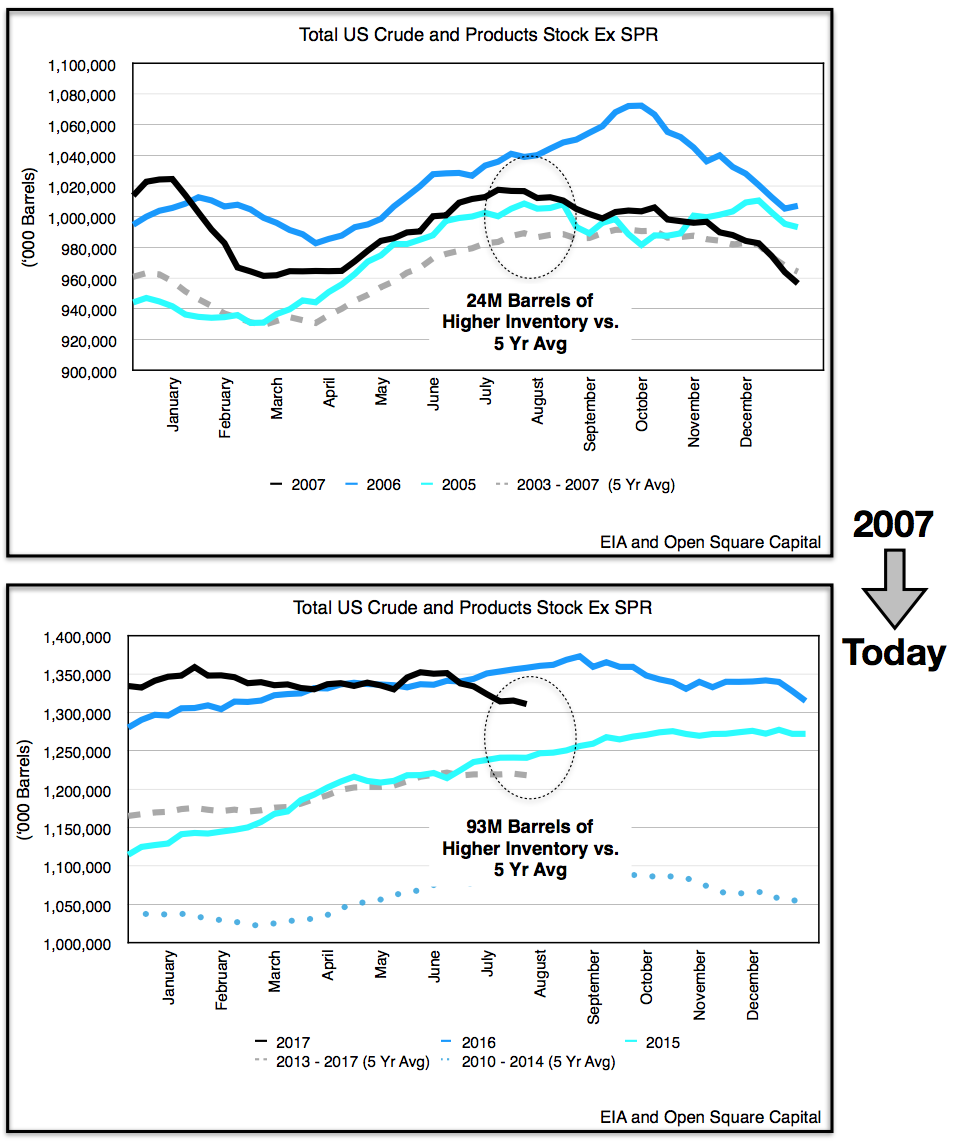
This may be discouraging but if we dive into the OECD figures and look at the largest market, the US, we can see some interesting trends. For the US analysis, we’ll use data up to August because of the timeliness of EIA data. Let’s start with total US inventories (both crude and oil products). In 2007, total excess inventories were running about 24M barrels higher than the 5-year average, whereas today, they are close to 3.5x more at 93M barrels. Inventories levels overall are higher today by about 30%, so the “excess” is greater on both an absolute and proportional basis. The 93M barrel “glut” is essentially 60% of the total OECD glut of 153M barrels, so what happens to this excess will greatly impact OECD trends.
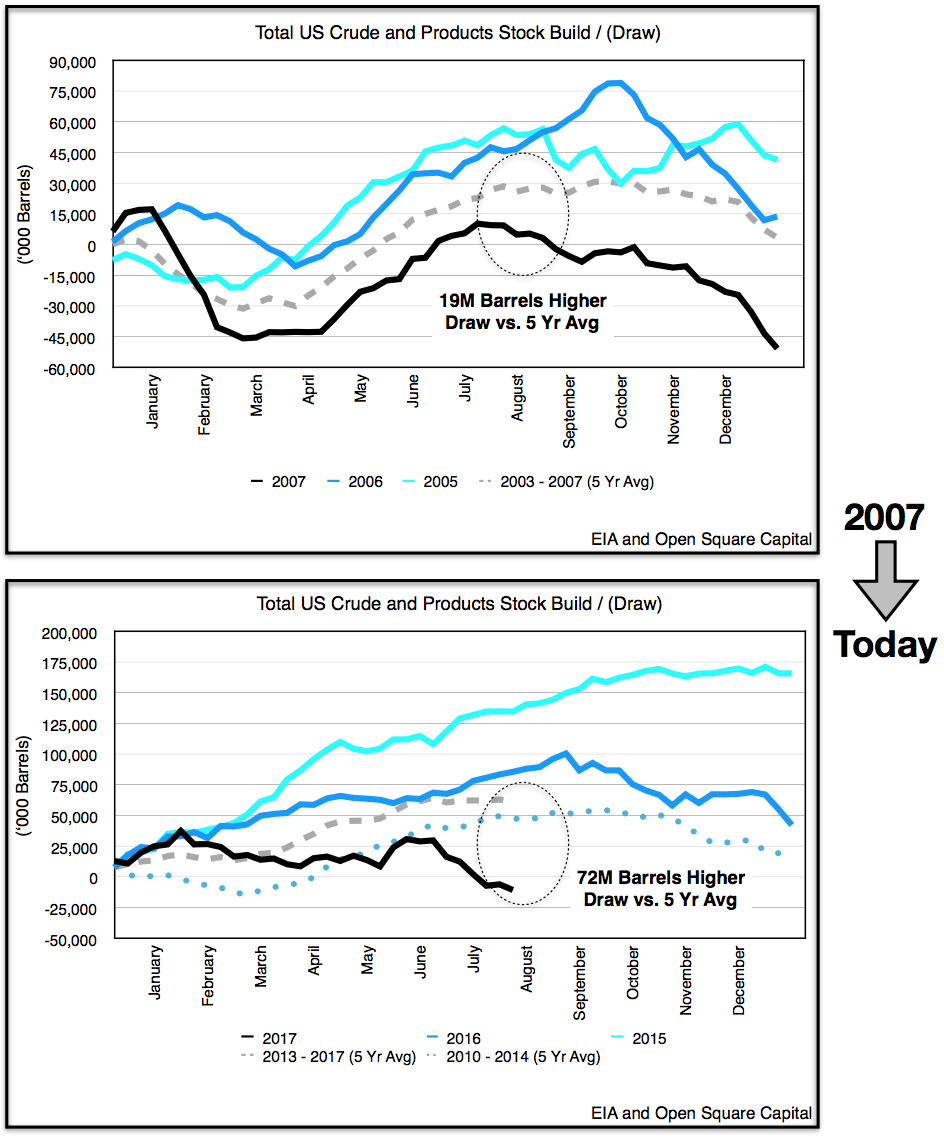
What are those trends? We’ll what we’re now seeing is that US crude and oil products are drawing down at a substantially accelerated pace. By August 2007, oil inventories had increased by only 9.5M barrels vs. the 5 year average build of 28.7M barrels, a 19M barrel difference.
This year we’re experiencing an even larger counter-seasonal draw. Whereas in the past 5 years we’ve averaged an inventory build of 60M barrels, this year we have a 10M draw, a 72M difference.
Much of the excess stock in both 2007 and today are due to crude levels. Let’s take a look at crude oil, and how it is performing vs. the 5-year average. For 2007, by August crude oil inventories were drawing about 3M barrels higher than the average. This year, the crude inventory draws are more than 8x higher at 25M barrels higher than the average.
Takeaways
So what’s our takeaway? Well, the “excess” worldwide inventories (i.e., current inventories vs. the 5-year average) are 2.5x times higher today than a decade ago, and almost 3.5x higher in the US.
OECD draws, although elevated compared to the 5-year averages for both 2007 and today, are trending similarly, which means it appears that rebalancing in 2017 is still much further off than 2007. Unlike 2007 (where oil inventory increases followed the 5-year average trend line in the first half of the year, and then subsequently drew down at a faster rate in the second half), this year the draws have been significant since Q1 and are accelerating. We also contend that even the Q1/Q2 draws were understated given that inventory destocking masked the true undersupply. Thus, as we head into the latter half of the year, the undersupply of oil seen in H1 will not only carry over, but join with the seasonal drawdown to accelerate draws further.
Thus, it’s likely that despite the higher excess inventory levels in 2017 vs. 2007, the elevated draws (coupled with H2 seasonal draws) could make short work of today’s elevated inventory levels. Regardless of whether the oil market achieves rebalancing by year-end or Q1 2018, the undersupply should continue into 2018 as US growth fails to keep up with growing demand. We also believe OPEC will extend its cuts in some form as it needs to incentivize higher oil prices (not only for the Aramco IPO, but encourage oil investment after 3 years of underinvestment in long-term capex).
Just as in 2007 when the fundamentals rebalance, sentiment and oil prices can quickly swing upwards if perception of further draws continue. So although we may have started 2017 with higher excess inventories than 2007, we may eventually end-up at the same place, a shortage. If so then 2018 could be a deja vu of 2008 again, and for oil bulls it’d be a welcome sight.
8 Comments on "Oil To $100? Deja Vu A Decade Later"
Outcast_Searcher on Wed, 16th Aug 2017 9:21 am
And then the ETPers will make some excuse. And the doomers will proclaim doom from high prices instead of low prices again.
Same song, different verse.
onlooker on Wed, 16th Aug 2017 9:41 am
Outcast, why don’t we wait till it hits 100 or something before we cast premature aspersions.
joe on Wed, 16th Aug 2017 10:32 am
In 07 peak oil of conventional oil hit home, opec squeezed our balls by cutting and Bush – Bin Laden oil group made out big. Now the world has changed forever. The result of their arrogance is that electric cars are coming in, wind energy is here and home energy standards all over the world demand heat efficient homes. On top of that opec needs to beat Americas 5millionbpd of tight oil to have a similar level of impact. Iraq is coming back, soon Libya will come back Canada is still fighting. Nothing short of global war will raise the price of oil as we saw in the DPRK/US spat over nukes. What people learned from 07 was 2 things, we needed tight oil as peak oil is here and that ‘too big to fail’ would be the corporate socialism of the future.
Sissyfuss on Wed, 16th Aug 2017 11:30 am
After being anesthetized by all the abstruse charts I defer back to Short. Net energy shrinkage is a bitch.
MASTERMIND on Wed, 16th Aug 2017 2:18 pm
The 1973 so-called “oil embargo” which reduced oil supply to the USA by somewhere around 3% or 4%. It slammed the US economy, caused the largest stock market crash since the great depression, doubled gasoline prices, severely damaged US industry and caused a 55 MPH national speed limit which remained in effect for ten years. The government also put restrictions on how much gasoline you could purchase. There were fist fights and even a couple murders between the public at gas stations. Just wait until we experience a 10% or 20% drop in oil supplies. In a few years or sooner we certainly will. When it hits the economic and social damage will be catastrophic. The end of Western Civilization, from China to Europe, to the US, will not occur when oil runs out. The economic and social chaos will occur when supplies are merely reduced sufficiently.
MASTERMIND on Wed, 16th Aug 2017 2:35 pm
Conventional Oil Peaked in 2006 –IEA
http://imgur.com/a/hccu9
New Oil discoveries by scientists have been declining since 1965 and last year was the lowest in history -IEA
http://imgur.com/a/W60yn
International Energy Agency Chief warns of world oil shortages by 2020 as discoveries fall to record lows
https://www.wsj.com/articles/iea-says-global-oil-discoveries-at-record-low-in-2016-1493244000
Saudi Aramco CEO believes world oil shortage coming despite U.S. shale boom
http://www.foxbusiness.com/markets/2017/07/10/saudi-aramco-ceo-believes-oil-shortage-coming-despite-u-s-shale-boom.html
UAE warns of world oil shortages ahead by 2020 due to industry spending cuts
http://www.arabianindustry.com/oil-gas/news/2016/nov/6/more-spending-cuts-as-uae-predicts-oil-shortages-5531344/
HSBC Global Bank warns 80% of the worlds conventional fields are declining and world oil shortages by 2020
https://www.research.hsbc.com/R/24/vzchQwb
UBS Global Bank warns of industry slowdown and world Oil Shortages by 2020
http://www.telegraph.co.uk/finance/newsbysector/energy/oilandgas/12136886/Oil-slowdown-to-trigger-supply-crisis-by-2020-warns-bank.html
German Government (leaked) Peak Oil study concludes world oil shortages would collapse the world economy & world governments/democracies
http://www.spiegel.de/international/germany/peak-oil-and-the-german-government-military-study-warns-of-a-potentially-drastic-oil-crisis-a-715138.html
The Oil Age may come to an end for a shortage of oil. -Saudi Oil Minister Sheikh Yamani
rockman on Wed, 16th Aug 2017 9:40 pm
Looker – why don’t we wait till the price stays low for many years before we cast premature aspersions. Your same point could have been offered in 2005. Cuts both ways, eh?
Joe – “What people learned from 07 was 2 things, we needed tight oil as peak oil is here…” First, global PO did not hit in 2007, 2008, etc. In fact, it will take decades to prove the world has reached PO recently. Second, the US surge in oil production did not develop from any recognition of a “need” for the oil: it happened as a result of a surge in oil prices. A surge in prices obviously not due to peak global oil production since production increased in the following years.
MM – As you pointed out: The 1973 oil crisis began in October 1973 when the members of the OPEC proclaimed an oil embargo. The embargo occurred in response to United States’ support for Israel during the Yom Kippur War. Embargo: October 1973 – March 1974
FYI: from 1970 thru 1977 US oil imports increased every year. The “embargo” did not decrease our imports:
https://www.eia.gov/dnav/pet/hist/LeafHandler.ashx?n=PET&s=MCRIMUS1&f=A
OTOH: “The 1979 oil crisis or oil shock occurred in the United States due to decreased oil output in the wake of the Iranian Revolution. Despite the fact that global oil supply decreased by only ~4%, widespread panic resulted, driving the price far higher.”
Cloggie on Fri, 18th Aug 2017 2:54 am
Gas-prices in Germany fallen to lowest level since 2005:
http://www.spiegel.de/wirtschaft/service/gaspreise-sinken-auf-tiefsten-stand-seit-zwoelf-jahren-a-1163414.html
5.8 cent/kwh
Too many suppliers, now including the Americans.
Germany gets 40% from Russia and most of the rest from Holland and Norway.
I hope it rises substantially soon, to support Russia and renewables. LNG from Qatar could soon play an important role and replace Dutch and Norwegian decreasing supply.