Peak Oil is You

Donate Bitcoins ;-) or Paypal :-)
Page added on April 7, 2013
Trends In The Cost Of Energy

Introduction
Energy is the largest component of the world’s Gross Domestic Product. It is a measure of our state of civilization. Its availability determines our standard of living, but also threatens to undermine it: the excessive use of stored energy through burning fossil fuels is a cause of Climate Change. Now, the depletion of these fuels will force us to reinvent how we can continue to advance our civilization in a sustainable manner.
The phenomenon of climate change was identified first in the nineteenth century. By the end of the twentieth century, a consensus evolved in the scientific community as well as among progressive political establishments about the need to limit global warming, but a global response has proved elusive until now.
Over the last half century a number of significant changes to our energy outlook have emerged. In 1949 M. King Hubbert, an Exxon engineer, predicted that oil production in the US would peak in 1971
This prediction was correct within days. The Global Hubbert’s peak (GHP) has been followed by a decline in fossil fuel reserves. A number of other transformational developments have occurred over the same time frame, including:
i. the emergence of cost effective renewable energy sources, particularly Solar Photovoltaic (PV)
ii. with new extraction technology, large amounts of local natural gas reserves have become accessible to dramatically change energy politics. This recent discovery of recoverable natural gas, together with the rapidly advancing renewable industry, gives the US local options not expected a decade ago. The US again has a realistically independent energy future.
In this article, the cost evolution of a variety of energy sources is examined. In particular, the role of renewable “Electronic Energy” in the form of PV will be examined in detail. The author shows data indicating that by 2020, photovoltaic electricity will be the lowest cost electrical energy available. This further asserts the need for a reliable storage solution compatible with wind and PV electricity generation.
It also suggests to the financial community to reexamine investments in the energy mix.
Comparison of Various Technologies
The technologies we will compare in this article are nuclear, coal, oil, and natural gas; and solar PV and wind among the renewable options. Table 1 summarizes the comparative status of these energy sources.
To compare all the options, Kilowatt-hours (kWh) will be used as the measure of energy, wherever possible. (In some cases it is difficult to obtain true comparable costs). In Table (1) and on the comparative graphs Figure (2) and Figure (3) the costs are calculated with the following formula:
The cost of generation ($/kWh) = [cost of generation equipment ($/kWh) + cost of fuel $/ (kWh) + maintenance $/(kWh)].
This calculation assumes:
• i) All technologies have 20 years of usable operating life
• ii) Interest on capital is included in the cost of generation equipment
• iii) Maintenance includes both labor and capital equipment
• iv) Base load operation is 7,000 hours (80% duty cycle)
•for nuclear, coal and fossil fuel.
• v) Wind and solar hours of operation is dependent on location. For wind 4,000 hours (45% duty cycle) for solar 2,000 hours (23% duty cycle) are assumed.
This calculation does not take into account the cost of environmental, health, decommissioning, and other indirect liabilities, nor does it take into account the end of life value of the operating system. The cost of financing is included in the cost generation equipment (assuming a debt to equity ratio for the financing of 4:1). For details of the calculation see (energy calculations)
Nuclear Power
The politically most sensitive energy source is nuclear. In recent years, bowing to public wishes, Germany has decided to shut down all nuclear facilities. Two years after the Fukushima accident, Japan is still uncertain about restarting its reactors. Chernobyl and Three Mile Island all are within recent memory.
Nuclear power does not emit any carbon containing gases, so it does not contribute to climate change. Operating in principle for 24 hours, it is a suitable power source for clean base load electricity. Sources of concern are accidents and the unresolved issues of disposal of spent fuel and decommissioning nuclear power stations at the end of their life
When the first nuclear reactors were built, proponents declared that nuclear power would be too cheap to meter. It did not turn out that way. Today, it is difficult to understand the true cost of nuclear power. A first reference represents a most optimistic view of nuclear power. This paper created enough interest that there has been an ongoing discussion since it was first published on April 2 2010. The conclusion of the paper is that the cost of nuclear power is under $0.04 per kWh. The value of nuclear power shown on Figure (3) before 2000 shows this number. This analysis does not adequately take into account the concerns expressed above about nuclear power.
A further reference comes from the experience of the most active player in the nuclear power industry, Electricite de France (EDF). EDF has built and operates the largest number of nuclear power stations in the world. In the reference quoted they announce more than a factor of three cost overruns on the Flamanville plant. The plant now is planning to start operation in 2016 and forecasts $0.12/kWh electricity cost.
It is difficult to arrive at a reliable cost of nuclear electricity. The best numbers I can extract is an average price of $0.10/kWh for 2010, and $0.12/kWh for 2020. The general conclusion of the experts is that nuclear power will not represent more than the present fraction in the electricity mix (presently at below 20% in the US).
Fossil Fuels
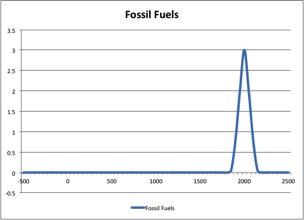
Figure 1. Timeline of the usage of fossil fuels
Figure 1) is a dramatic representation of the time line of the history of the use of fossil fuels. In the beginning (1 to 4 billion years ago), the majority of gases were CO2 and N2 in the atmosphere. From this beginning of time, fossil fuels were created by photosynthesis enabling CO2 to react with water.
CO2 + H2O >>> light >>> O2 + C – (H2O)
If all the O2 in the atmosphere was made by this process, the upper limit of fossil fuels stored over 4 billion years can be calculated from the total O2 in the atmosphere today. Within an order of magnitude accuracy, the weight of O2 in the atmosphere is 10e18kg (1followed by 18 zeros). The extractable part of this stored fossil fuel (see table 1, is estimated to be less than 10e16kg, less than 1% of the total carbon deposits, as calculated from the Precambrian content of the atmospheric O2) is expected to take place over a few hundred years as shown by the small blip on the time line (note that the first part of the line extending over 5 miles to the left of the page). The peak of the bell shaped curve, representing Huppert’s peak, falls close to the year 2000. The half width of the blip is 100 to 200 years, making it imperative that we find an alternate energy source to fossil fuels in our children’s lifetime.
Climate Change is principally caused by increased CO2 and other greenhouse gases in the atmosphere, due to man made and all other effects. Increased CO2 leads to an increase in the earth temperature. There is however, an even more serious consequence of increased CO2 (and parallel a reduction in O2) in the earth’s atmosphere. At the present rate of CO2 generation, (10e13 kg/year), we have to consider the reduction of atmospheric O2 to the point when living organisms can not sustain life. (A reduction of O2 concentration of 1% equivalent to 10e16kg of O2, would affect life itself.) We are presently a factor of 1000 away from this condition.
Coal
Coal is the most abundant stored fossil energy on earth. The estimated extractable reserves are about 1 Trillion tons. There is enough coal to provide power to the globe for more than a century. The US has one of the largest reserves in the world. The problem however is that coal is also largest green house polluter of all the energy sources (Table 1). In 2012 coal was the fuel for 40% of the world’s electricity and 26% of the global primary energy. The use of coal for electricity generation in the US is being replaced by natural gas. In 2012, for the first time the generation of electricity by natural gas was equal to the electricity generated by coal.
At a price of $30 per ton, the cost of electricity generated by coal is about $0.03 per kWh. The price of coal today can reach $150 per ton. At these prices the cost of natural gas generated electricity becomes competitive with that generated by coal. These cost calculations do not include the cost of externalized environmental and health costs, which amount to about $0.14 per kWh for coal.
Coal as a source for carbon has a value as a raw material for several industrial and consumer uses. For electricity generation coal is not the lowest cost solution any more.
Oil
Ever since the age of the automobile, fossil fuels (primarily oil) have been the world’s preferred energy source. Returning to Figure 1), and Hubbert’s Peak, the bell shaped curve starting around the year 1900 indicates the use of fossil fuels. Since early in the planet’s history, photosynthesis has converted carbon dioxide and water to hydrocarbons and oxygen. Today, burning fossil fuels reverses that process. If we burn all the stored fossil fuels, we would end up with an atmosphere primarily of CO2, instead of oxygen. That would be the ultimate climate change.
The world’s crude oil reserves at the end of 2012 are about 1,600 billion barrels. The consumption for the same year was reported at 32 billion barrels (10e13kg). With these numbers the existing oil reserves would last 50 years. Of course both the size of reserves and consumption levels are moving targets. Whatever the supply and consumptions numbers are, available oil reserves are finite and we are beyond Hubbert’s peak. The remaining oil should be kept for industrial and consumer applications, and not burned to produce heat and pollution.
| Energy content | Total reserves | 2012 years left | CO2 pollution | Electricity cost ($/W)
1980 2010 2020 |
|||
| Nuclear | 0.03 | 0.11 | 0.17 | ||||
| Fossil fuels | |||||||
| Coal | 7 kWh/kg | 1 trillion tons | 300 | 1kg/kWh | 0.03 | 0.07 | 0.12 |
| Oil | 10 kWh/l | 1 trillion barrels | 43 | 0.7 kg/ kWh | 0.11 | 0.15 | 0.19 |
| Gas | 10 kWh/l | 1000 trillion m3 | 100 | 0.55kg/ kWh | 0.04 | 0.06 | 0.07 |
| Renewable energy | |||||||
| Wind | 0.08 | 0.07 | 0.06 | ||||
| Solar PV | 1.00+ | 0.10 | 0.05 | ||||
Table 1. Comparison of different energy sources ($/kWh)
Natural Gas
Natural gas is one of the forms of recoverable stored hydrocarbons. Total natural gas reserves are estimated to be 10e15kg. Natural gas has received special attention in the last decades, since the size of US reserves has become apparent. Potentially, these reserves can make the US energy independent.
Natural gas, due to its molecular makeup produces less CO2 than other fossil fuels. However, there are significant environmental consequences associated with the hydrofracturing (fracking) process to extract the newly identified natural gas reserves. The water that is used in fracking and the subsequent disposition of that water has to be taken into account in the evaluation of how clean natural gas is.
Natural gas today can be cost competitive with coal to produce electricity. But the pricing of these two fuels is very volatile. In 2012 the cost of natural gas reached parity with coal for the production of electricity, but in February 2013 a recent report of the IEA forecasts coal to be the dominant fuel again for electricity at least until 2015.
The natural gas industry has attracted so much capital that at least for the time being the price of natural gas will remain competitive.
Wind
Among the different sources of renewable electricity generation, wind was the first to reach large-scale cost effective penetration of the energy industry. Cumulative electricity generation from wind reached 300 GW by 2011. Wind capacity is large enough so that the transmission capacity of the existing grid is limiting the growth of wind generation.
The intermittent nature of wind makes it even less predictable then solar. A suitable energy storage medium will be necessary to enhance the value of electricity generated from wind (and solar).
The cost of electricity from wind has leveled off, since megawatt-size wind turbines have been deployed. Electricity costs range fro $0.05/kWh to $0.10/kWh, depending on location and the cost of equipment. The industry expects further modest cost reductions. One of the uncertainties of wind electricity is the cost of maintenance.
Wind energy generation has already found its proven role in the electricity mix. As a viable renewable energy, its future competitiveness in relation to fossil fuels will only improve.
Solar PV (Photovoltaic)
Since the author’s primary expertise is in PV, the role of PV will be examined in more detail. Figure 2) shows the historical cost evolution of thin film PV modules and those of crystalline PV modules. This figure shows a forecast until 2020, assuming the trend observed for the past decades will continue. This Figure is a summary of the substance of this article.
PV, The Electronic Energy Source
Moore’s law is an empirical observation in the semiconductor industry. It observes that the density of integrated circuit components doubles approximately every two years. This periodicity has changed with time, starting at 18 months, now closer to three years. This is not a law of physics, It is an empirical observation that is effected by many parameters, notably by the laws of the land, the state of the art of applicable science and by investments committed to the progress in the technology.
There is a similar relationship for the cost evolution in PV technology, illustrated on Figure 2. While Moore’s law can be demonstrated by the progress in one company (Intel), progress in PV has to be viewed in terms of the accomplishments of commercial entities, governments, and academic institutions worldwide. The main empirical observations are the following;
• There are two parallel developments, for crystalline Si and for thin film PV. Among thin films aSi (amorphous Silicon), CdTe (Cadmium Telluride) and CIGS (Copper Indium Gallium DiSelenide) are included in the “Thin Film” plots. Points are taken from several publications, but the primary data is from the NREL continuing report of maximum cell efficiencies, as measured at NREL . Two summary presentations that well summarize the progress of PV development and their data is used in the construction of Figure 2. [see note(A) below]
• The efficiencies of the two different classes of PV cells – crystalline Silicon (CSI) and Thin Films – are plotted against time. The data falls on two parallel lines with the same slope. The line representing Thin Films (lower line) is shifted in time by about 12 years from the evolution of cSi cells. This is the time the Thin Film PV development was delayed compared to the development of cSi PV technology. For more than three decades the curves show remarkable similarities. [See note C]
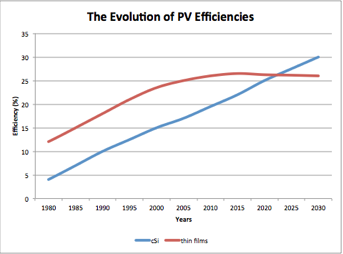
Figure 2. The evolution of PV efficiencies for the period 1980-2030 Upper line cSi the lower line Thin Films (aSi, CdTe and CIGS)
PV developed for space applications and concentrating PV CPV are not included on Figure 2.
The main conclusion of this analysis is:
The efficiency of PV cells of crystalline Si and thin film have increased at a rate of 5% per decade. There are no reasons or physical laws that the efficiency should not keep increasing until they reach their maximum efficiency determined by band gap and the number of devices used for multijunction cells.
This is the equivalent of Moore’s law for PV technologies. It is to be noted that PV module efficiencies in production lag by about three percent behind cell efficiencies. (there is a scatter of +/-0.1 in the absolute value of the efficiencies). The curve of cSi with a 1eV band gap will have to go parallel with the time axis at about 30% efficiency. For thin films, since multi junction cells are included, this asymptotic behavior comes about at around 50%. The efficiency of thin film PV cells is forecast to reach 25% by 2020 and 30% by2030, with corresponding commercial module efficiencies of 22% and 27% respectively.
Figure 3 shows the cost evolution of the various energy technologies in the past 40 years and reasonable expectations until 2030. These calculated values use the data taken from various references quoted above. The forecast for PV is based on the considerations presented below
Figure 3. The cost of electricity US cents/kWh for different technologies for the period 1980-2030
The cost of thin film modules per watt has always been substantially lower (about 50%) than crystalline Si of the same efficiency. The efficiency of cSi was at any given time about 5% higher than thin film PV [note Figure2] because the development of cSi has preceded those of thin films by five years.
The reason for the lower costs of thin films are cost difference are;
i) the thickness of the semiconductor material is much thinner, (2 microns compared to 300 microns)
ii) the interconnections of the monolithically integrated module was part of the manufacturing process resulting in substantially lower assembly costs
iii) the electrode structures and the high currents in crystalline Si technology require additional costly materials and processes not needed for thin films.
There is an existing high volume mature industry that can guide us in estimating the terminal cost expectations of glass-to-glass encapsulated thin film PV modules. Car windows and low-e windows are a very similar structure and cost to the thin film PV product. The estimated production volume for these products is over 1 billion square meters per year. This volume would generate over 200GW of PV electricity. In this volume the manufacturing cost of the laminated glass is about $20 per square meter. This can be expected to be the terminal cost of glass-to-glass PV modules. If we assume thin film module efficiency by 2050 of 40%, one square meter will produce 400 Watts. This gives a terminal cost for this type of modules of $0.05 per watt. We double this terminal cost for PV (as a conservative contingency), with $0.10 per watt module prices a system can be installed at $0.20 per watt, with resulting cost of PV electricity of about $0.01 per kWh. The $0.10 module cost is equivalent to $40 per square meter of the laminated glass industry product, still twice the existing terminal cost reached in the glass industry.
Now let us examine the reality of these further cost reductions. We will focus on ternary semiconductors without any carcinogenic material such as Cadmium. State of the art of CIGS laboratory cells have 20.7% efficiency. For the moment we bypass other PV technologies, to focus only on TFGPV (Thin Film Glass encapsulated PV). High efficiency triple junction crystalline PV devices such as GaInP/GaInAs/Ge (with demonstrated cell efficiencies above 41%) primarily used in space application and CPV applications are substantially more expensive than TFGPV.
There are several advanced concept PV systems, based on nanotechnology that may lead to improved efficiencies. At this point the commercialization of nanotechnology based PV devices is not adequately defined. Once they are fully developed, they might replace the present thin film semiconductor material in a TFGPV device. Their influence on cost will be felt if the nanotechnology based PV will lead to higher efficiency devices.
In planning the future, the role of crystalline Si PV has to be understood better. Today the PV industry is in a destructive mode due large subsidies of the industry and the large overcapacity of production that was funded globally. In 2012, manufacturing capacity in China is greater than demand and all crystalline manufacturers are operating at a loss. It seems that the government of China has made a commitment to keep the industry alive and allowed further lending to the industry and set up substantial consumption.
As discussed earlier, thin film modules of identical efficiency have substantially lower cost than cSi. In the examination of future PV options we focus on ternary semiconductor thin film devices. The route to higher efficiency is reached by the use of multi-junction devices. Starting with the present CIGS champion cell of 20% efficiency, an ideal double junction cell is forecast to have a maximum efficiency of 30%. Expecting the usual lower efficiency for a module compared to a champion cell, module efficiency (as predicted by Figure 2) of 22% is a reasonable by 2020 with the introduction of tandem devices. 30% cell efficiency with the development of triple junctions is forecast by 2030.
To calculate cost, we start with delivery of 5% efficient aSi product from Duna Solar in 1998. The starting point manufacturing cost was $0.95 per watt. The predicted module cost for a 22% efficient TFGPV module is $0.24 per watt in 2020 and $0.15 per watt in 2030. We assume [see note (B)] installed system costs of $1.0 per watt in 2020 with corresponding electricity price of $0.05/kWh. With installed system cost $0.60 per watt in 2030, the cost of electricity is $0.03/kWh. It is to be noted that ultimate limit of PV efficiency can be increased in subsequent years at least double that of the 2030 value to over 50% and above, with further reduction of cost to $0.01/kWh. The overall conclusion from this analysis is:
The cost of electricity produced by TFGPV is forecast to decrease throughout the century to the level of one cent per kWh
The percentage of PV in the energy mix very much depends on the availability of suitable storage. Presently, there is a strong focus on the development of battery technologies. Batteries are not likely to reach the energy densities available in fossil fuels. However the availability of very low cost PV electricity opens up a different approach to energy storage. Consider the potential use of aluminum as a fuel. A mixture of Al and water can produce Hydrogen at room temperature. The main problem is that the amount of Hydrogen generated is still below the weight or volume capacity of fossil fuels. The other big problem is that the cost of hydrogen generated this way still higher than by other means. However if the cost of PV electricity can be brought down to $0.01/kWh, Hydrogen from Al generation becomes cost competitive with fossil fuels.
Conclusion
The energy industry is in transition. From the basket of energy technologies available today the industry will change gradually to clean renewable energy. The transition period will take several decades, depending the positioning of the capital and the timing and amount of investment. Ultimately the dominant element in the energy mix is expected to be solar PV.
In solar PV there will be a refocus on thin film based PV, with a further increase of efficiency to the 50% range and a decrease in module cost to under $0.20/watt and $0.01/kWh. This is a realistic goal by the middle of the century. Such low electricity costs will also bring novel solutions to energy storage. Investors in the energy industry will be well served to note this change in direction!
12 Comments on "Trends In The Cost Of Energy"
BillT on Sun, 7th Apr 2013 2:16 am
Alpha is seeking a world we will not inhabit in 2030 or 2050. A world where high tech processes will still be possible in volume. Minerals like CdTe (Cadmium Telluride) and CIGS (Copper Indium Gallium DiSelenide) will not be available when the system goes down. Not in the quantities needs for scale production of anything.
Again, without a storage system, all of this tech is practically junk if you want to run a modern civilization. You cannot have a power source that goes down with the sun or stops when the wind exceeds a certain speed or stops completely. Think operating rooms, factories, refrigeration, etc.
As for prices … the $0.01 per KWh is just another ‘too cheap to meter’ lie. This guy is pushing the tech field he makes his living off of. While I enjoyed his assumptions, there was little reality in it. Really? We are going to be able to make thousands of square miles of laminated glass when oil and natural gas is gone? Process it and make something out of it and then ship it all over? LMAO!
Norm on Sun, 7th Apr 2013 9:16 am
Well of course Bill T if all you do is presume there is no solution, then there is no reason to get out of bed in the morning. There is one good energy source it is ‘hope springs eternal in the human heart’. It seems that some of this stuff might work out as energy source (example solar panels) its just that all the Mitt Romney’s need to stop stealing away all the money for their greedy selves, and then there might be enough capital to work with. The most exotic solar panels are used on spacecraft by NASA and their materials are too rare to be mass-produced. However there are mass-production versions of the solar panels which can be made with cheaper more available materials. You mentioned ‘no storage system’ and thats interesting also. Actually the ‘solar tower’ which uses a half-circle array of steered mirrors, can also store considerable energy as molten salt etc etc for night-time usage. Its also possible that night-time storage can be attained with industrial scale methods. What really dogs us, in my opinion, is the rotten-to-the-bone political government and corporate systems which don’t produce anything useful and lack basic IQ.
Anyway, have a better day tomorrow.
Kenz300 on Sun, 7th Apr 2013 11:56 am
The cost of oil, coal and nuclear keeps rising and causing environmental damage.
The cost of wind and solar keeps dropping and is safe and clean. Wind and solar do not require evacuation zones like nuclear power plants.
It is time to speed up the transition to safe, clean alternative energy sources and reduce our use of Climate Changing fossil fuels and dangerous nuclear energy.
We need to learn lessons from Fukishima and Chernobyl and realize that the cost of nuclear energy is too high.
Japan using Fukushima people as human Guinnea Pigs – YouTube
http://www.youtube.com/watch?v=rr2PmjdpLqM
Cloud9 on Sun, 7th Apr 2013 1:21 pm
The transition to energy consumption levels last seen in the 19th century will not end mankind or end civilization. It will end the nanny state and collapse empires. As we pass through the eye of the needle population trends we have seen in the 20th century will reverse themselves. At the end of the day we will have a younger more agrarian population.
J-Gav on Sun, 7th Apr 2013 1:49 pm
It seems safe to say that non-fossil fuel energy will (and should) expand over the coming years. In the process they will likely achieve higher efficiencies and at least partially adapt to the use of cheaper, more abundant materials. The fact nevertheless remains that alt-energies will never replace fossil fuels, not even to the tune of one third of what we presently consume …
And the upshot of that is a future with declining net per capita energy available. Lifestyles will of necessity change, becoming simpler and less energy-intensive, while appropriate tech makes its return and costly vaporware is left where it belongs – on the drawing-board. This can all happen the hard way: by voluntary restrictions (conservation),individual and social preparedness in terms of resilience … or it can happen the very hard way: by waiting for a miracle and then watching everything disintegrate and having to re-build everything from scratch. In the latter case, the Transition would be much messier than in the former, though either one will be wrenching and painful, leaving a very different landscape for the following generation.
BillT on Sun, 7th Apr 2013 3:20 pm
Norm, politics are not preventing anything from happening. The Chinese are producing more panels than they can consume. We could buy them cheap if the competing corporations would let them be sold here. Money and profits are preventing it, not government.
So what is the problem? Money. The US is bankrupt as are most Americans when you look at their net worth. When there is no money, there will be no panels or anything else. you have not thought out the whole process by which ANYTHING comes into existence in today’s world. It is very very complicated and all of it starts with money and ends with money and that requires a system to make it happen. That system is going away, and may never return.
Kenz300 on Sun, 7th Apr 2013 5:12 pm
Oil, coal and nuclear are the past.
Wind and solar are the future.
The sooner we transition to wind and solar the better for the climate, the environment and us.
GregT on Sun, 7th Apr 2013 5:37 pm
“The fact nevertheless remains that alt-energies will never replace fossil fuels, not even to the tune of one third of what we presently consume …”
True, but only If we build all alternate energy infrastructure before the coming economic collapse. Keep in mind, that this would include one third of what we currently consume in food as well. If we don’t build out the infrastructure it time, our consumption could be one tenth of present.
Human beings don’t tend to do very well without food.
keywords on Tue, 9th Apr 2013 5:06 pm
In all honesty this is a wonderful indepth article nonetheless as with most great copy writers there are many factors that might be worked about. But never ever the significantly less it absolutely was interesting.
blog7 on Sun, 25th Jul 2021 2:54 am
The energy industry is in transition. From the basket of energy technologies available today the industry will change gradually to clean renewable energy.
Osh University on Tue, 20th Feb 2024 10:09 am
Osh University, the leading kyrgyzstan medical college , is dedicated to producing competent healthcare professionals. Its reputation for high-quality education and a world-class faculty makes it the ideal choice for medical students.
Shalamar Hospital on Tue, 20th Feb 2024 10:10 am
When it comes to heart health, Shalamar Hospital proudly offers the expertise of the best cardiologist in Pakistan , ensuring the highest standards of cardiac care.