
The EIA’s Petroleum Supply Monthly has been published with production data for all individual states and offshore areas. All data is Crude + Condensate and in thousand barrels per day with the last data point March 2014.
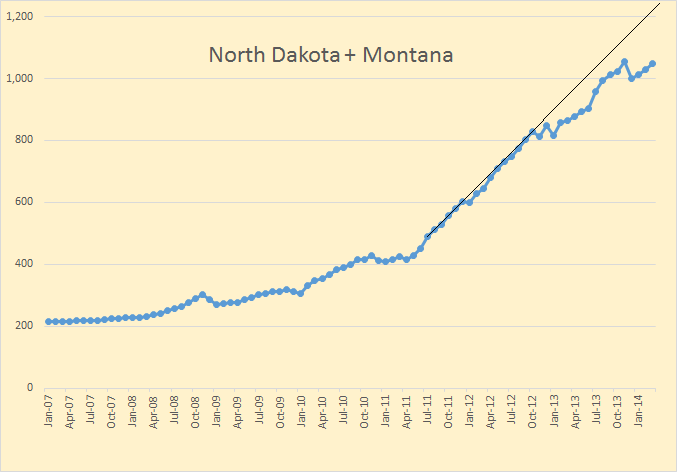
Since the Bakken occupies part of two states, North Dakota and Montana, I have combined their production in order to get a better idea of what is really happening there. I have drawn a trend line from July 2011 through October 2012. That shows where production might have been if the fast decline rate and bad weather had not caught up with the. Production was 1,050,000 barrels per day in March, still 5,000 barrels per day below the point reached in November.
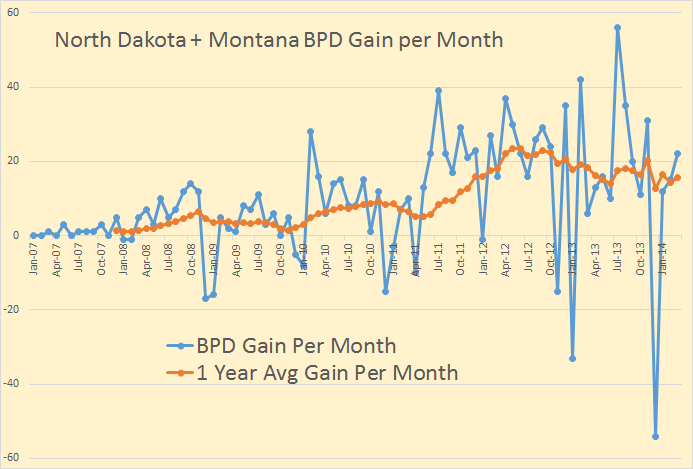
I wanted to show this chart so we could get a better idea what is really going on in the entire Bakken area. Back in May and June of 2012 production was increasing by an average of 23,500 barrels every month. Now production is increasing by an average of 15,580 barrels per month.
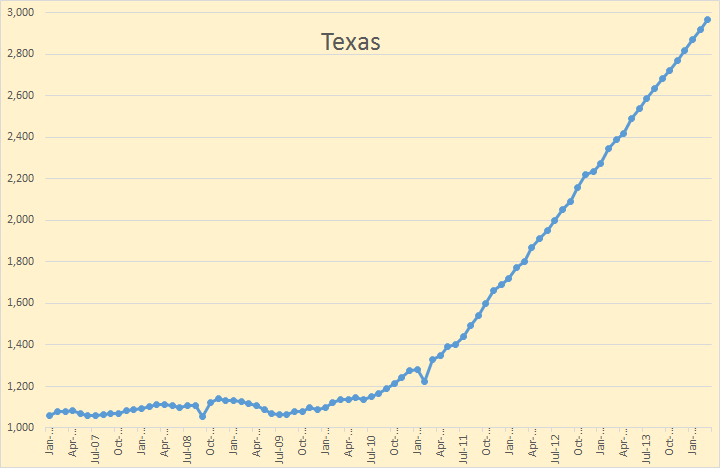
Texas is, by far, the state with the most production. But the last year or so is just an estimate by the EIA. That is why the last 12 months or so are so linear, they are all just a guess.
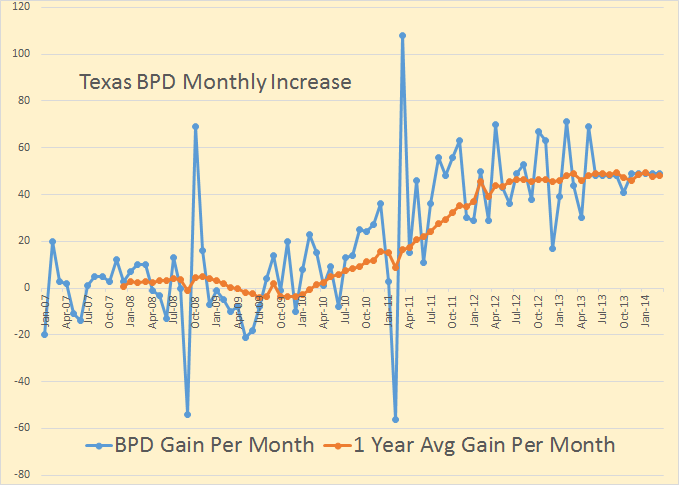
Texas change per month is a little more dramatic but keep in mind the last year is only an estimate. That estimate has Texas production increasing by 48,000 barrels per month.
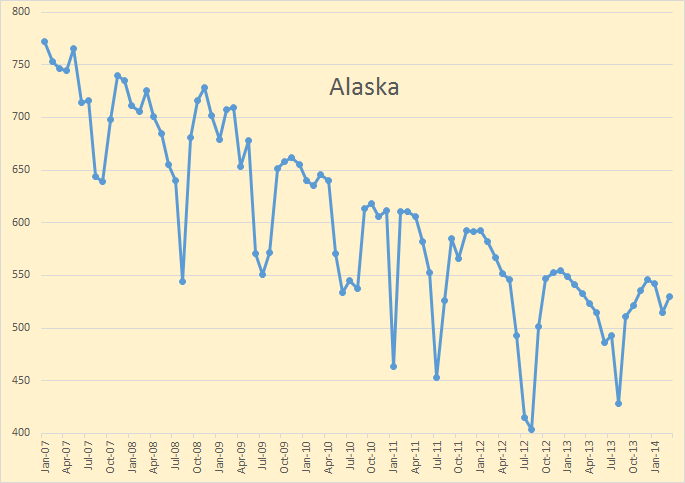
I haven’t posted Alaska before. They are, of course, in continuous decline. They have, as of late, shown a slight slowdown in their decline rate however.
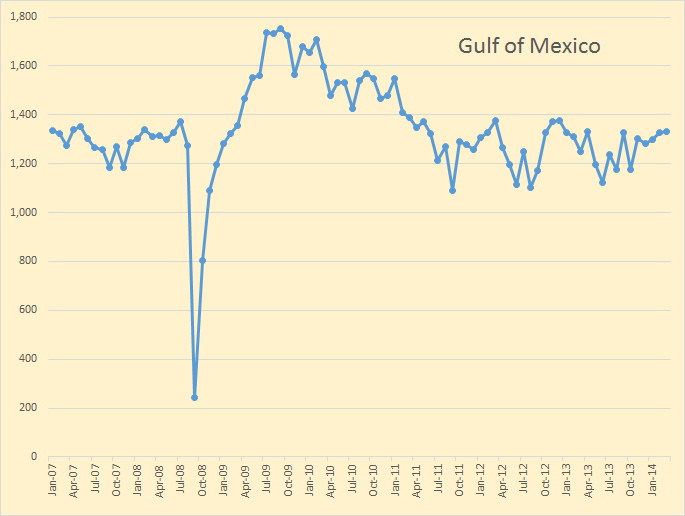
The Gulf of Mexico is going nowhere fast. They are continually drilling new wells in new fields. However the deep water wells have such a very high decline rate that they are just staying even. The EIA is counting on the GOM pumping 2 million barrels per day by 2016 to get them to 9.6 million barrels per day. That is not going to happen. They will be lucky to get to 1.5 bpd. In fact they will be lucky just to hold off decline.
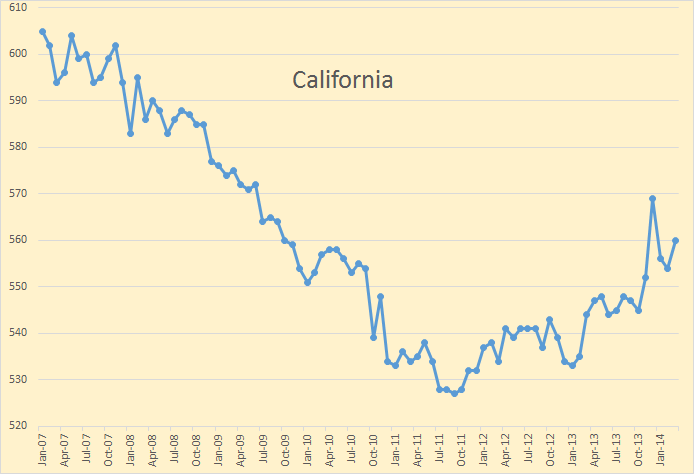
I just had to show California now that the Monterey Shale has gone kaput. They have increased production by about 30,000 barrels per day since mid 2011.
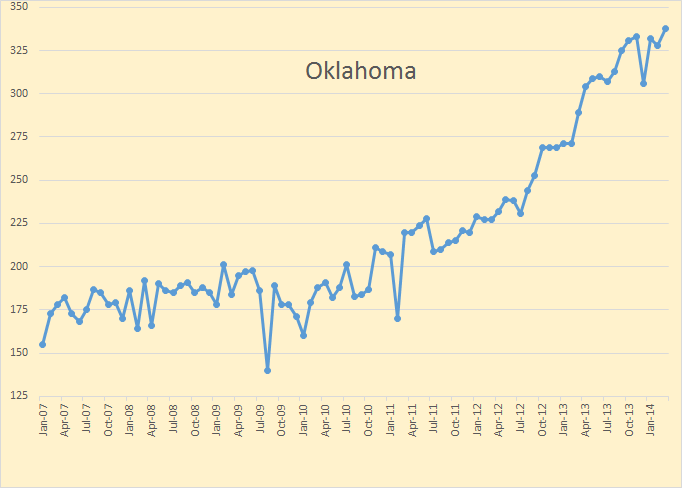
Oklahoma has shown some slight increase in production but has slowed down as of late.
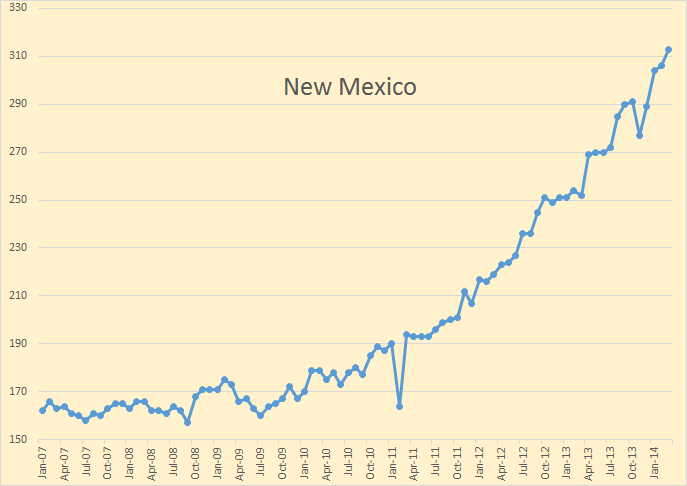
New Mexico has been increasing production lately, up about 100,000 barrels per day over the last three years.
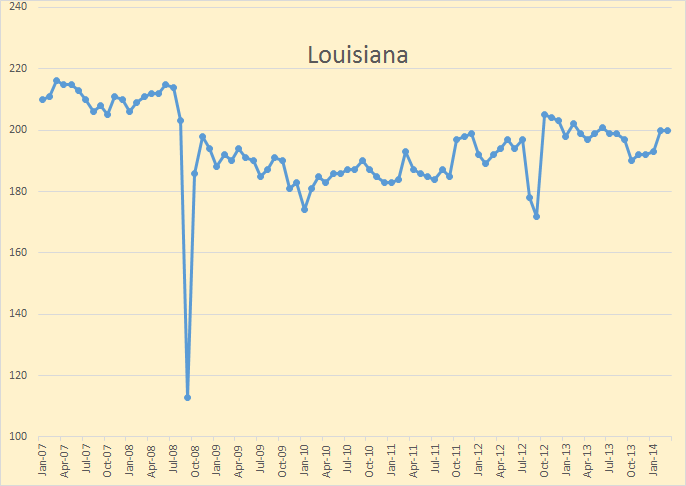
And the last of the big producing states is Louisiana. The big spike down in September of 2008 was Hurricane Gustav.
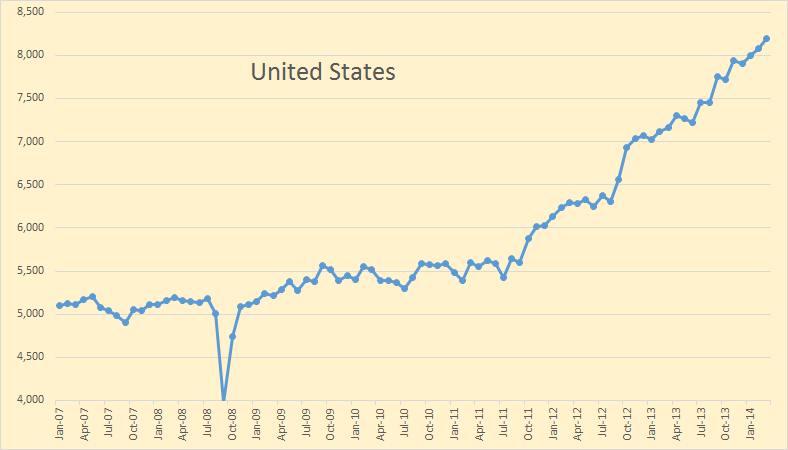
And it all adds up to this.
I send out an email notifying some folks of every new post. If you would like to be put on that list or removed from it, please notify me at DarwinianOne at Gmail.com.
peterjames on Fri, 30th May 2014 5:54 am
Ok, I dont know all the facts, but I read that there are a great deal of wells in the GOM. At least 3500 in depths over 150 metres, and 50,000 all up, but I am assuming alot of those 50,000 are non producers. Even 10,000 wells producing 1.4 mbod equates to an average of 140 bopd per well. I know alot of them must have already paid for themselves, but they must still cost a great deal to maintain. Like the alaskan pipeline not being able to transport oil when supply drops below a certain point, surely there must be a point where a great deal GOM production just has to stop. Can we see a point one day in the next few years when alaska is pumping 350,000 barrels, GOM is pumping 650,000 barrels, and then the next day the owners stop it, as it just doesnt make sense?
bobinget on Fri, 30th May 2014 8:40 am
As prices continue to go higher, additional investment money comes on board. Everyone in the ol-bidness and industry itself needs to work. Everything won’t close down overnight. Look up ‘stripper wells’, they are the future as well as a good chunk of now.
rockman on Fri, 30th May 2014 9:16 am
Peter – Here are the stats: The Gulf of Mexico area, both onshore and offshore, is one of the most important regions for energy resources and infrastructure. Gulf of Mexico federal offshore oil production accounts for 23 percent of total U.S. crude oil production and federal offshore natural gas production in the Gulf accounts for 7 percent of total U.S. dry production. Over 40 percent of total U.S. petroleum refining capacity is located along the Gulf coast, as well as 30 percent of total U.S. natural gas processing plant capacity. But to answer specifically: offshore ops require much higher rates to remain commercial due to those high ops costs. Onshore there are companies making adequate cash flow just producing 1 bold per well. The verge onshore US well produces less than 10 bold.
More random stats: 27,000 abandoned oil and gas wells in Gulf of México. The oil industry has drilled 42,000 wells in the Gulf of México.
A link with lots of data:
http://www.geographic.org/deepwater_gulf_of_mexico/production_rates.html
Such as: Deepwater oil production rates increased rapidly from 1996 through 2000 and remained steady since that time. Deepwater gas production rates rose from 1996 to mid-1997 and then stabilized at the current high rates.
shortonoil on Fri, 30th May 2014 2:03 pm
It must be remembered that about half of the shale oil production reported is not refine able into fuels, it is used as a chemical feedstock. Our oil situation is not nearly as good as the EIA is leading us to believe. If it weren’t for the slowing global economy, prices would be much higher, or there would be fuel shortages, or both. This data should be viewed with circumscription!
http://www.thehillsgroup.org
Northwest Resident on Fri, 30th May 2014 4:32 pm
A scientifically trained mind would use the phrase: “This data should be viewed with circumscription!”
A public relations manipulative techniques trained mind would use this phrase instead: “This data is pure bullshit and should be viewed with extreme suspicion.”