Peak Oil is You

Donate Bitcoins ;-) or Paypal :-)
Page added on February 22, 2014
Reverse Engineering the North Dakota Bakken Data
This is a guest post by Ovi Colavincenzo
There is considerable discussion on this site regarding when the North Dakota portion of the Bakken will peak. Having looked at the monthly Bakken data that the State publishes, it raised the question of whether it was possible to do a reverse analysis of the data and then use it to develop a model that would replicate the ND Bakken production, exactly. The objective being to provide further insight on what is happening in the ND Bakken.
In order to do this, the following conditions and information were required:
- A monotonically increasing number of new producing wells
- A typical/average decline curve for the ND Bakken field
- Not too many wells being shut/reworked each month
The last bullet is a preferred condition because if a number of low producing wells are shut and replaced by newer high producing wells, then the estimated flow rate of the new wells will be on the high side.
From 1999 to mid 2005, approximately 200 wells were in production in every month. The addition of an increasing number of new wells began to occur in mid-2005, so start date for the analysis was set at the beginning of 2008 to address the first bullet point above.
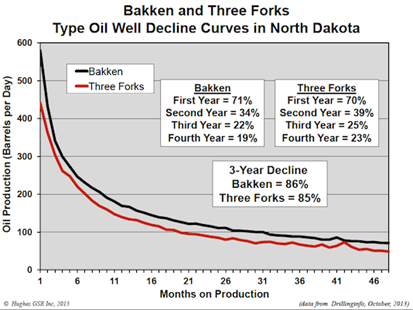
Figure 1: Source: The Shale Revolution” by J.D. Hughes
For the decline curves, two were used and are shown in Figures 1 and 2. One came from “The Shale Revolution” by J.D. Hughes, November 19, 2013 shown in Figure 1. The other came from North Dakota’s Directors cut, “Tribal Leader Summit” 09 05 12 (PDF), Figure 2.
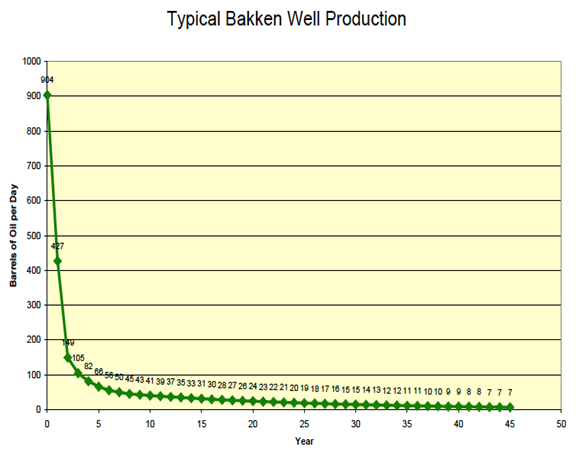
Figure 2: Source: North Dakota Director’s Cut “Tribal Leader Summit”
Note that the ND data is yearly and the Hughes data is monthly. While the Hughes data represents the average decline rate for a number of wells, it is not clear what data was used to derive the “Typical Bakken Well Production” curve shown in Figure 2. Note the significant difference in the initial production rates, 904 b/d vs 580 b/d. Also a post in “The Oil Drum #9954”, by Rune Likvern, raises questions of how typical it is.
Since it is not clear from the monthly ND data, whether wells are being closed, either temporarily for maintenance/re-fracking or permanently, the ND production and wells data were averaged using a three month moving average prior to being used in the development of the model. The intent of using the moving average was to minimize the effects of closing and reopening wells. There is some indication that the opening and closing of wells does impact the variability in the results and is shown below in a comparative chart.
To conduct this analysis, a normalized Bakken decline curve was required. The decline curves shown above were normalized for this analysis. Two curves were used in order to assess the impact on the results from using two different curves. The two normalized decline curves are shown in Figure 3. The major difference between the two occurs in the first two years. After the first year, the Hughes decline curve is down by 71% vs. 53% for the ND Director.
Note that there are only four years of original Hughes data. Beyond four years, the data is extrapolated and parallels the ND Director data. The original North Dakota Director’s Cut data was yearly and the monthly data was interpolated from the yearly data using a sliding quadratic function.
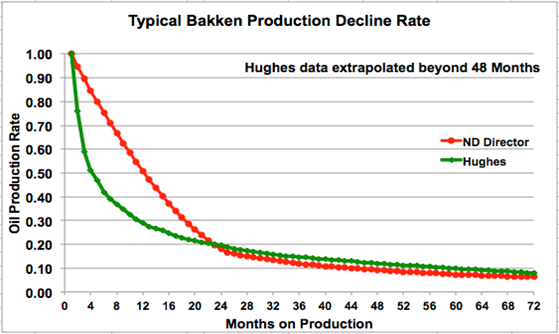
Figure 3: Normalized Bakken decline curves
To assess the affects of the differences in the two data sets, the cumulative production associated with each decline curve was compared. The curves in Figure 4 show how the production rate increases due to drilling one identical well each year in the first month of each successive year. Looking at the Hughes curve, after drilling 1 well each year for 7 years, the production rate from the 7 wells is only 1.9 bbls/day in 72th month. After 7 years of production, adding one new well at the beginning of the 8th year only increases the production rate of the field by 0.07 bbls/d, to 1.97 b/d, i.e., 7% of the initial production rate of the new well. The Red Queen has shown up.
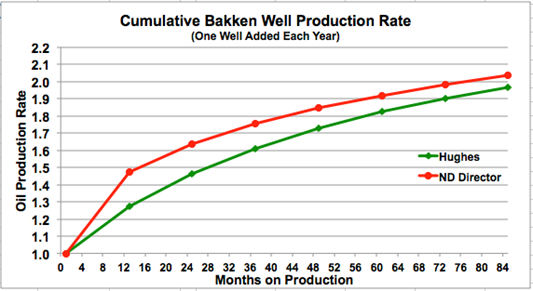
Figure 4: Cumulative yearly production from adding one well each year
While the ND Bakken data published monthly shows the overall increase in the field’s production, it does not provide information on the productivity of the new wells completed in that month. As indicated above, the objective of this analysis is to calculate the amount of additional new production required each month to use in a model that would exactly match the ND Bakken production data, after accounting for depletion from all previous months. Below are three charts that summarize the results of the analysis and the model’s output.

Figure 5: Monthly new production
Figure 5 shows the amount of production added by the new wells each month to match the ND Bakken data that was averaged over three months.
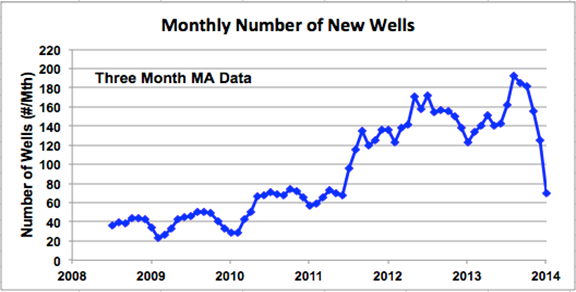
Figure 6: Monthly addition of new wells
In Figure 5 note the dramatic increase in additional production from roughly 30 kb/d to 60 kb/d in mid 2011. This sharp increase is related to the sharp monthly increase in new well completions from 70/Mth to 130/Mth during the same period shown in Figure 6. The trend in new crude production parallels the number of new well completions to the beginning of 2013 and into 2014. What is surprising is the drop in the average number of new well completions beginning in mid 2013. Is this a sign of things to come?
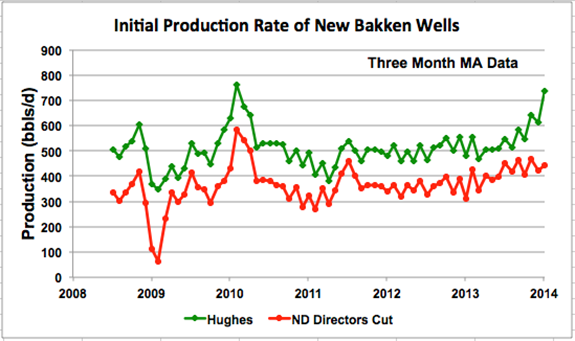
Figure 7: Comparison of Hughes and ND Director initial production rate
The average initial production rate of the new wells added each month is shown in Figure 7. One can see a roughly constant production from the new wells beginning in mid 2008 up to 2013 for both curves, except for the two spikes. Looking at the Hughes data, the new wells from mid 2008 to the beginning of 2013 were averaging 500 b/d, increasing to approximately 650 b/d at the end of 2013. A similar trend appears in the ND Director’s Cut graph but the growth in 2013 is less pronounced. This raises the question of whether the increasing well production rates reflect the increasing length of the new wells being drilled or are they being drilled in sweeter areas. I have read that some wells are now 2 miles long and think that initial production would be proportional to the length of the well.
The dip in well production in early 2009 is associated with the dip in total ND Bakken production. The sharp increase in Q1-10, I believe is associated with the temporary closing of older, low production wells, which are then brought back on line after maintenance a few months later when the average well production settles into a more typical stable range.
The decline rate that the new wells must offset to keep production increasing is shown in Figure 8 below. It appears that the decline rate at the end of 2013 is somewhere between 55,000 b/d/Mth and 75,000 b/d/Mth. If the new wells are supplying approximately 500 b/d and the average decline rate is around 65,000 b/d, then a minimum 130 wells/month are required to offset the decline.
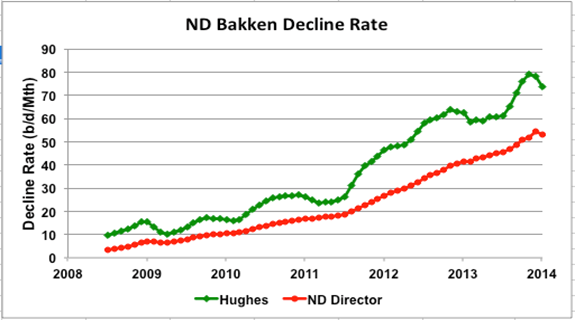
Figure 8: Total monthly decline rate from all of the previous months’ wells
It was noted earlier that the original ND Bakken data showed high variability in the number of wells drilled and this had a significant impact on the results when analysing the original data set.
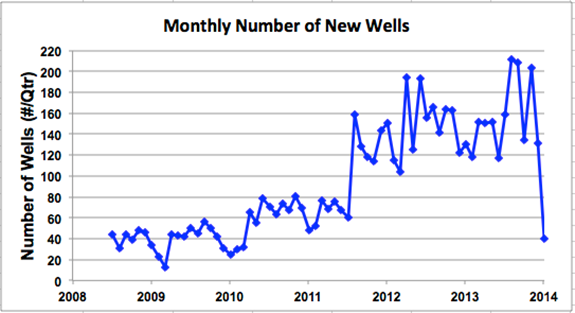
Figure 9: Original data set of monthly new well completions
To provide the readers with an idea of the variation in the original data, the original monthly well data is shown in Figure 9 and its impact on the initial production rate is given in Figure 10. Compare the variability in Figure 9 with Figure 6 and Figure 10 with Figure 7. One can see how the monthly variation in well completions affects the variation in the initial production rates shown in Figure 10. However note that the four month moving average is similar to the Hughes curve in Figure 7.

Figure 10: Impact of high variation in original wells data on initial production rate
In Figure 10, even though only 40 wells were completed in December 2013 (Figure 9), the initial production rate of the wells was still the same as in November and December, close to 800 b/d, based on the original data. In other words the drop in the production rate from November to December, from 911,292 b/d to 862,987 b/d was due primarily to the low number of well completions.
This model is capable of projecting future production rates or scenarios by providing production estimates/guesstimates for future months. However, I believe the model’s greater value is in showing/evaluating how the growth in production in the ND Bakken has increased through a combination of the addition of new wells and drilling wells that have a higher initial production rate. By continuing to track the initial production rate, we should see either a drop in number of wells or a drop in the initial production rate or both as we approach the peak. This behaviour should manifest itself in both decline curves.
I will keep these charts updated on a timely basis or when something significant occurs.
28 Responses to Reverse Engineering the North Dakota Bakken Data
Thanks for the work. I agree that keeping an eye on average IP (is it slipping) and number of wells dug is essentially the key to monitoring the play. Who know what the 10-20 year type curve really is like and at a certain point, who cares. In any case, new drilling is required and when it lessens (or new wells are less nice), then the play will peak almost immediately.
1. Give me your feedback on the USGS study. Good methodology? Do you think their numbers are low, high, or about right?
http://pubs.usgs.gov/of/2013/1109/
2. Yeah, I figured it had to be completions causing such a radical drop. (and the table they report the months stuff has the number of new wells and number of barrels in columns) Perhaps over time we get to the effect of too much downspacing and/or lack of sweet spots (essentially geology factors). But for now, it does kind of look like it really was weather in December.
3. What do you think of the report by Cosima Theloy on geology and technology factors (Google it, not sure how to hyperlink to a pdf).
4. How do the TF and Bakken compare in output? Seems like a fair amount of TF wells have been done so we ought to be able to compare.
5. I watch the daily rig counts at Million Dollar Way.
http://themilliondollarway.blogspot.com/2014/02/friday-february-21-2014.html (example, scroll down)
Seems interesting that in general, we have exactly the same number of rigs in 2014 as 2o13, but moderately down from 2012. This has been pattern for last month. Even though new wells are being drilled a little more efficiently (with more pad drilling), it would still seem to imply some cooling of interest (after all, rigs are available, why not keep the amount from 2012…or even ramp up higher and higher…just for the financial draw). but then the 2014 is same as 2013…so still significant investment worthwhile and not declining more. I just don’t know how to read it. Takeaway bottleneck? Fracking bottleneck?
12 Comments on "Reverse Engineering the North Dakota Bakken Data"
rollin on Sun, 23rd Feb 2014 3:11 pm
Interesting study that shows the history of the Bakken production. I doubt if it can give accurate future projections, except by coincidence. There are too many variables and limits that can change the whole thing downward. Downward is the more likely future scenario rather than continually increasing production.
Like all oil fields, they run down after a while and so far it is increasingly costly to try and get more out of failing fields. The Bakken has a steep failure rate because of geology.
Nony on Sun, 23rd Feb 2014 4:44 pm
Obviously eventually it will run down, but we’re not seeing it yet. Average well production has stayed the same (actually slightly improved) from 2008-2012.
Northwest Resident on Sun, 23rd Feb 2014 4:54 pm
“… a minimum 130 wells/month are required to offset the decline.” That is a lot of holes that must be drilled, if that 130 is a correct number.
“… only 40 wells were completed in December 2013.”
Uh-oh…
It seems to me that Bakken is going to run out of places where worthwhile holes can be drilled in the very new future.
rockman on Sun, 23rd Feb 2014 6:09 pm
First, a reminder: the Bakken is not a “field” but a trend: a collection of different fields and productive areas. Second, I wish Rune from TOD hung out here. He had a reliable, and more important, a detailed accounting of Bakken production. Last time we shared data, a year+ ago, an interesting trend was developing in both the Bakken and Eagle Ford. Regardless of how high or low the initial production and decline rates might be there’s another stat to compute: how much oil was recovered during the first 12 months of EACH individual well. Obviously this can only be determined for wells completed more then a year earlier. This stat eliminates variations due initial test rates reported. Such data is very easily manipulated. It also reduces IP rates variations due to length of the laterals and multiple fracs which would presumably produce higher IP’s.
And the results were surprising even for those of us without great expectations for these plays. The results: the average first 12 production sum was decreasing at a noticeable rate. Poor memory so I’m more guessing the number Rune came up with. But that stat was decreasing 10%-20% per year…or more.
I’ll do an update for the Eagle Ford but it will take a good bit of time. It’s tedious process and cannot be automated. I have to research each lease individually over multiyear periods. But it’s a powerful stat: the driver of every drilling play is how quickly the initial investment is recovered. Ultimate recovery, initial flow rate, decline rate, etc. take back seat to rate of return which is heavily dependent on the “payout” timing. And that factor, which is also dependent upon oil prices, determines what will and won’t happen in the future in these trends.
Keith_McClary on Sun, 23rd Feb 2014 9:35 pm
Rune is still around:
http://fractionalflow.com/2013/12/23/in-bakken-nd-it-is-now-mostly-about-mckenzie-county/
ghung on Sun, 23rd Feb 2014 9:39 pm
@Rockman: Rune can be found at his site fractionalflow.com. Looks like his latest is from 23 December – “IN BAKKEN (ND) IT IS NOW MOSTLY ABOUT MCKENZIE COUNTY”
Nony on Mon, 24th Feb 2014 12:03 am
See the analysis by Enno over at PeakOilBarrel (graph in the discussion of this post). Average well production is NOT declining in the Bakken. He graphs it with cum curves.
Nony on Mon, 24th Feb 2014 12:16 am
Here is the graph:
http://peakoilbarrel.com/reverse-engineering-north-dakota-bakken-data/comment-page-2/#comment-9747
first year IP for 2008-2103 are all about the same and better than 2007.
Nony on Mon, 24th Feb 2014 1:01 am
I’m not sure how operationally useful the “trend versus field” criticism is. When the USGS assessed the basin, they did so on the basis of continuous assessment units rather than field by field.
http://pubs.usgs.gov/fs/2013/3013/
I think in terms of how you exploit the region (well placement) or do calculations of size it is a very different situation than drilling elsewhere. These companies are collecting oil from the fractures and microfractures of the middle bakken layer (almost source rock) rather than looking for individual traps. they have less than 1% dry holes and less than 20% uneconomical (at current price, blabla). It’s more like mining ore than searching for pockets of oil. Yeah, the vein might get a little richer in places, but it’s still considered a continuous resource for all practical purposes (and yes, I getcha on the oil being in the fractures, still you “mine).
http://www.ogj.com/content/dam/ogj/print-articles/volume-112/jan-06/z140106OGJxga02.jpg
Nony on Mon, 24th Feb 2014 1:11 am
I submitted a post but it went to moderation. Not sure if it was automatic spam control (for having supporting links) or if I’m now being censored by blog operator.
Nony on Mon, 24th Feb 2014 1:11 am
Looks like it was the urls. 🙂
Northwest Resident on Mon, 24th Feb 2014 1:48 am
Nony — Always the optimist, trying to dispel the negative and focus on the positive. That’s a very good quality to have. But there are some hard facts that have to be dealt with, and Nony, every time rockman or WT points at a hard fact that would tend to burst any optimism that shale trends are anything but a short term crutch that civilization is currently limping along on, you find a way to piece together an argument that re-inflates your optimism. Positive thinking works great in many aspects of life, but it won’t suck any more oil out of the ground than finances and physics allow — and that’s the part that you don’t seem to want to deal with.